Team:CSU CHINA/ODE Model
Dynamic mathematical model of Sweet Guard
Construction of ODEs Model to Characterize Gene Circuit
To quantitatively analyze the workflow of Sweet Guard, ensure the consistency of the step design, verify the experimental data, predict the product operation and make further improvement of the product, we developed a dynamic mathematical model. This model is mainly constructed by ODE, which is based on the existing data. It simulates the gene circuit of engineered cells that sense blood glucose and blue light, followed by insulin secretion and the main physiological processes associated with it.
We have improved the existing model to make it suitable for our Sweet Guard design. The ODEs model is mainly composed of three modules:
- Engineering cells. This module mainly includes the process that glucose enters the engineering cells to change the metabolic state of the cells, which leads to a series of responses and initiates the expression and secretion of insulin after blue light irradiation, and the process of negative feedback inhibition of their insulin expression after the engineering cells sense extracellular insulin.
- Capsule. The sodium alginate matrix where the engineering cells are located. This module includes the process of proliferation of engineered cells and the diffusion of substances such as glucose and insulin.
- Blood and tissue. It refers to the environment of blood and tissue metabolism throughout the body. This module simulates the dynamic changes of blood glucose in the body and the body's response to insulin.
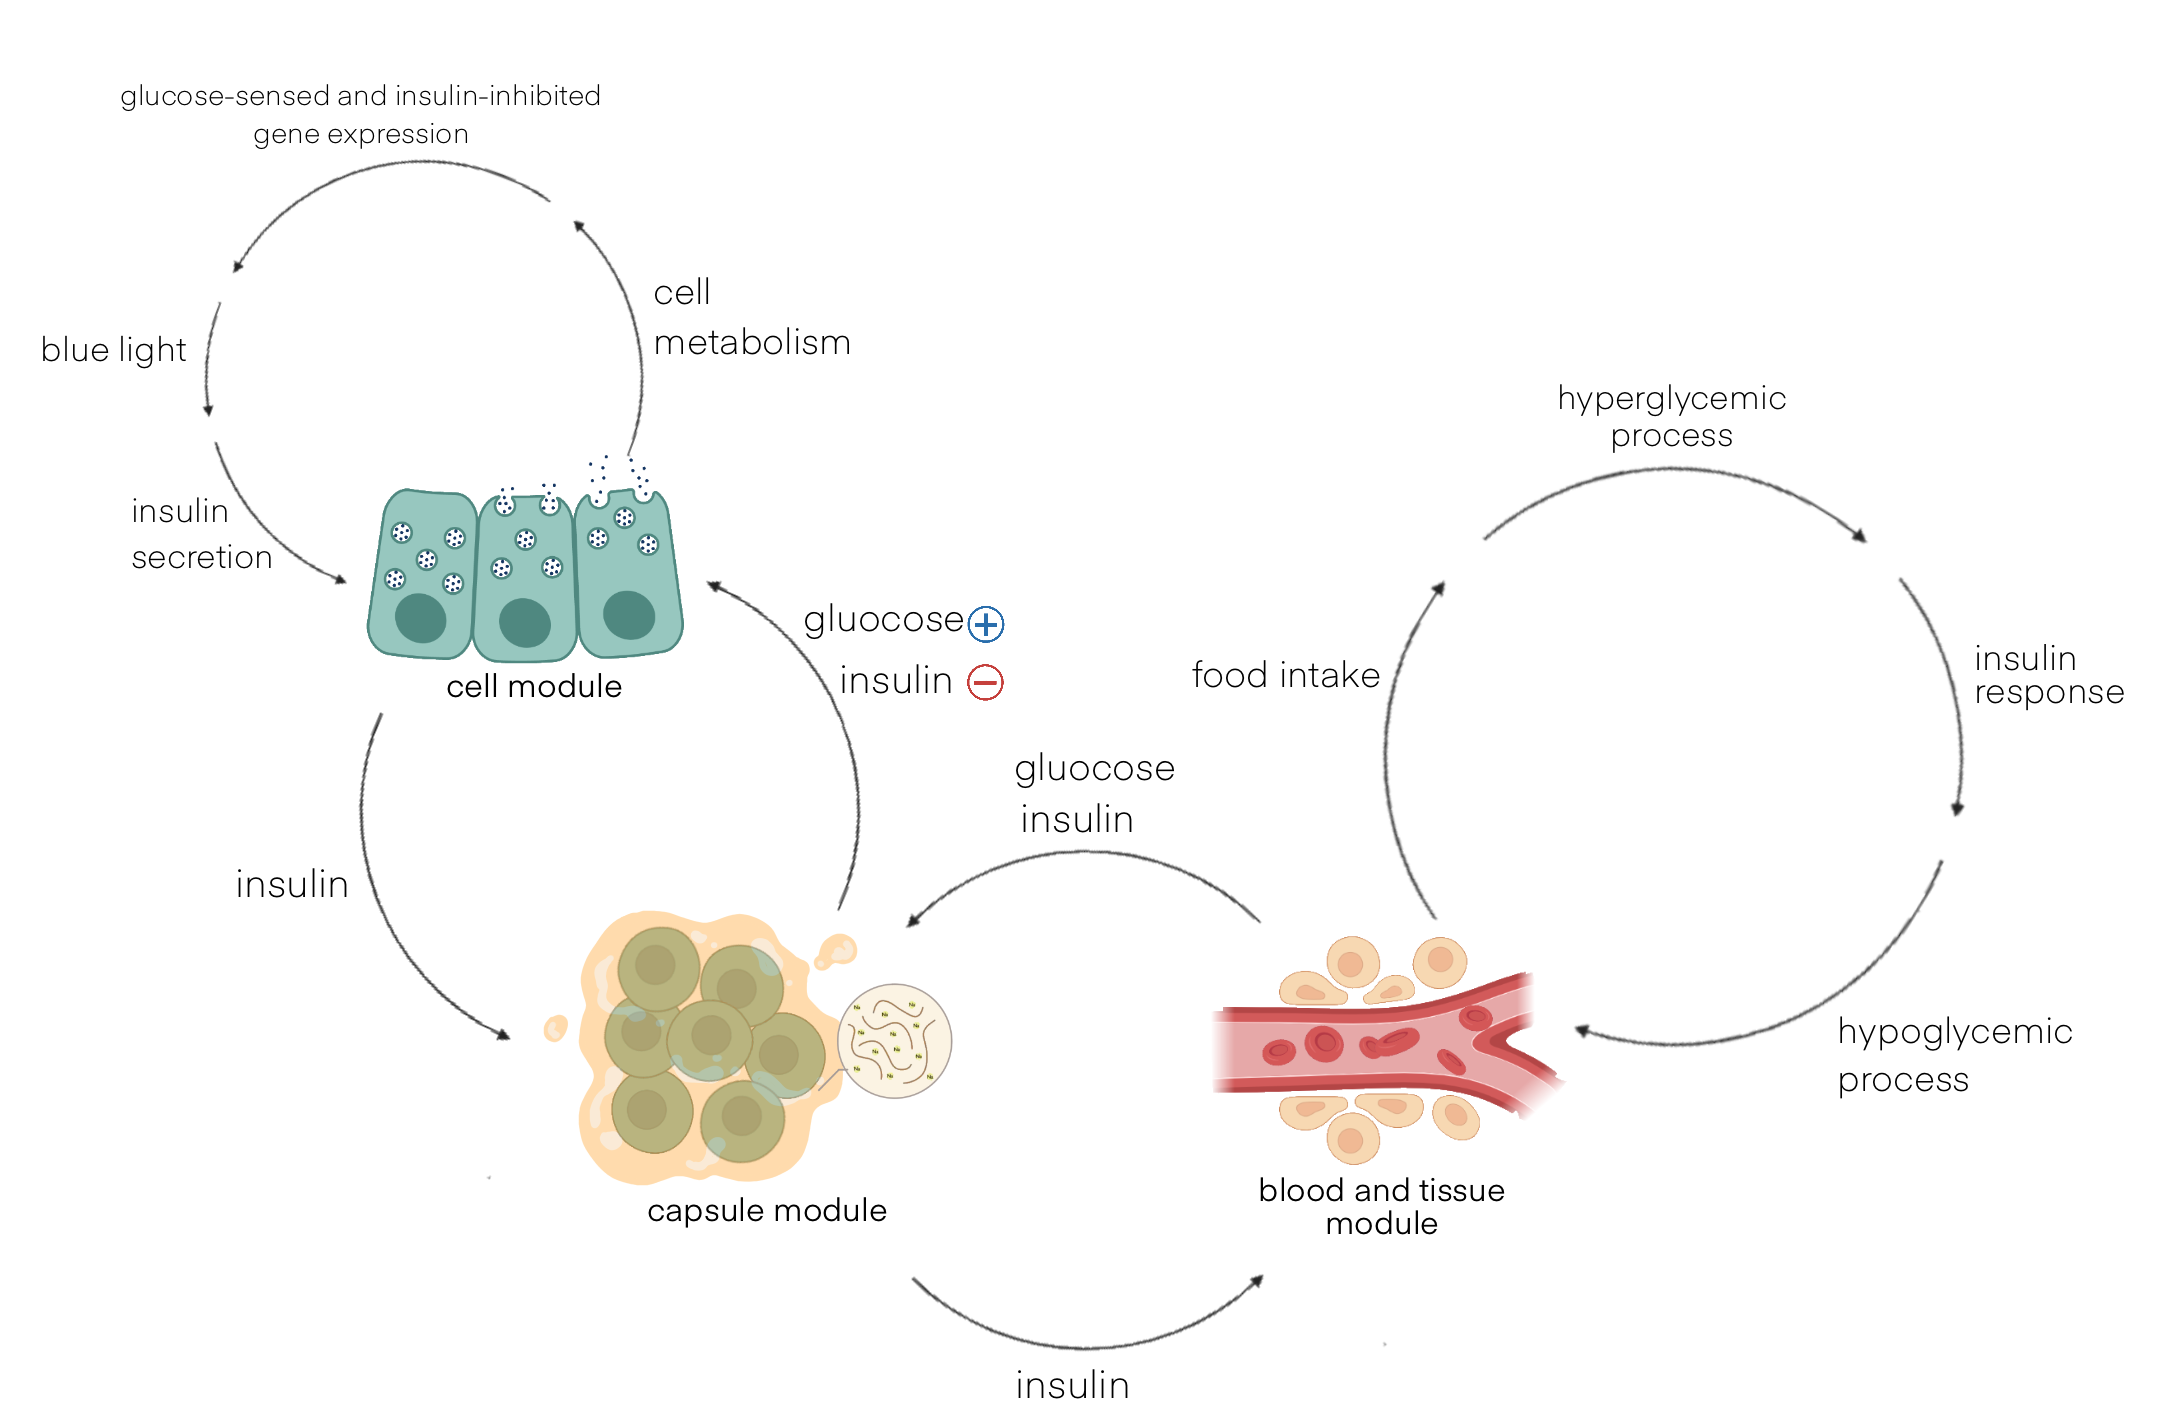
Figure1. Structure of the mathematical model.
Detailed description
Due to space limitations, the detailed description of the model will be briefly introduced in the selection of modules, instead of explaining every equation. The specific parameters can be downloaded in pdf to view. For detailed information, please refer to the references of our model.
The equations used in ODEs mainly include the chemical master equation, the Hill equation, and the Michaelis equation. The chemical master equation mainly characterizes the mutual transformation between various molecules; the Hill equation is used to characterize the degree of activation of a substance that is concentration-dependent on another substance; the Michaelis equation mainly simulates the instantaneous rate of a certain process with the maximum rate under specific conditions.
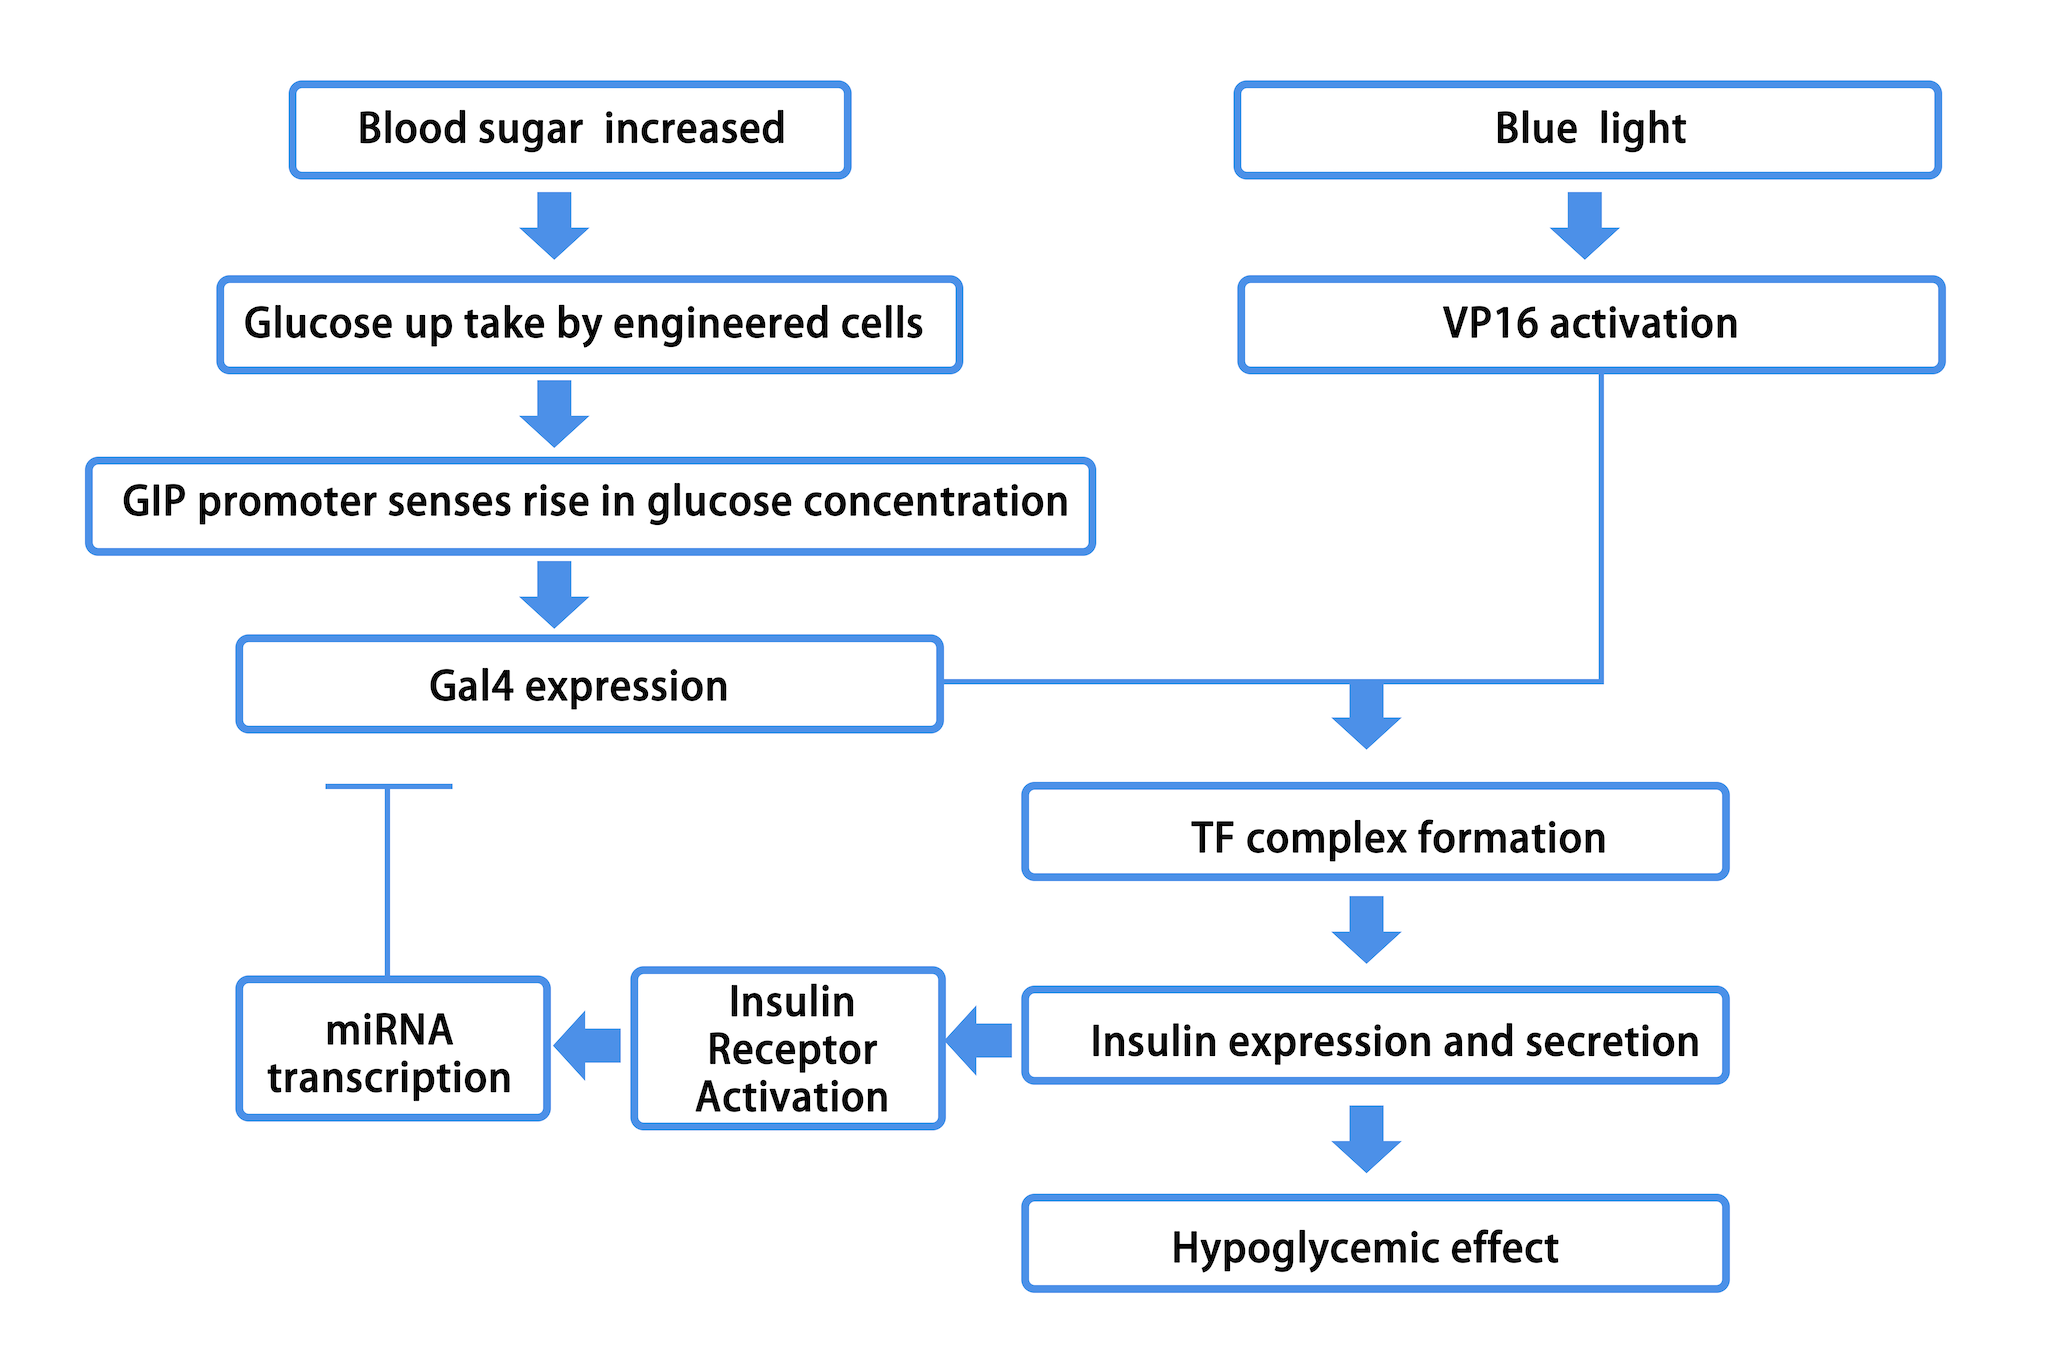
Figure2. Engineered cell gene expression process
Cell module
We assume that when glucose enters the engineering cell, the entire circuit starts. The glucose concentration in the capsule is

| Name | Definition |
|---|---|
| Number of cells | |
| Intracellular glucose concentration | |
| Glucose concentration in capsule matrix | |
| Maximum rate of extracellular glucose entry into the cell | |
| Maximum rate of intracellular glucose consumption | |
| Maximum rate of intermediate product consumption | |
| Michaelis-Menten constant of extracellular glucose entry reaction | |
| The Hill Constant of ATP Allosteric Regulation of Glucose Metabolism | |
| Michaelis constant of intracellular glucose metabolism | |
| The Hill coefficient for allosteric regulation of glucose metabolism by ATP | |
| ATP allosterically regulates the ATP consumed by glucose metabolism | |
| Volume of individual engineered cells | |
| Intracellular ATP concentration | |
| Concentration of Glucose Metabolite Intermediate | |
| Rate equation for ATP generation by consuming XG | |
| Hill constant for allosteric regulation of intermediate metabolism by ATP | |
| Hill coefficients for allosteric regulation of intermediate metabolism by ATP | |
| Maximum ATP concentration | |
| Stoichiometric number | |
| Maximum rate of ATP metabolic consumption | |
| Michaelis Constant of the Reaction Process of Depleting ATP | |
| Activated Gal4 Promoter Transcription Factor Concentration | |
| Unactivated Gal4 Promoter Transcription Factor Concentrations | |
| Hill coefficient for activating the Gal4 promoter transcription factor response | |
| Hill constant for activating the Gal4 promoter transcription factor response | |
| Concentration of intracellular VP16 mRNA | |
| Basal transcription rate of VP16 mRNA | |
| The number of VP16 plasmids transferred by each engineered cell | |
| Number of VP16 genes on each VP16 plasmid | |
| Degradation rate of VP16 mRNA |
The glucose metabolism intermediate product is the signal to activate the subsequent process, that is, the activation degree of the transcription activator of the Gal4 gene depends on the concentration of the intermediate product

| Name | Definition |
|---|---|
| Intracellular VP16 Concentration | |
| Translation rate of VP16 mRNA | |
| VP16 Degradation Rate | |
| Rate of spontaneous conversion of VP16 to the active form in the absence of blue light irradiation | |
| Rate of hydrolysis of the active form of VP16 back to the inactive form | |
| Concentration of intracellular active VP16 | |
| The rate at which VP16 changes to the active form upon blue light irradiation, taken as 0 when not irradiated | |
| Rate of spontaneous conversion of VP16 to the active form in the absence of blue light irradiation | |
| Degradation rate of active VP16 | |
| Rate of transcription factor hydrolysis back to Gal4 with active VP16 | |
| Intracellular transcription factor concentration | |
| Concentration of intracellular Gal4 mRNA | |
| Basal transcription rate of Gal4 mRNA | |
| Number of transferred Gal4 plasmids per engineered cell | |
| Number of Gal4 genes on each Gal4 plasmid | |
| Gal4 promoter basal expression fold | |
| Hill coefficient of product regulated promoter | |
| Hill Reaction Constants of Product Regulated Promoters | |
| Degradation rate of Gal4 mRNA | |
| Concentration of intracellular miRs | |
| Primary binding constant of miRNA to Gal4 mRNA | |
| Concentration of Gal4 mRNA bound once to miRNA | |
| Hydrolysis constant of primary bound mRNA | |
| Intracellular Gal4 Concentration | |
| Translation rate of Gal4 mRNA | |
| Gal4 degradation rate | |
| Rate of Gal4 binding to active VP16 | |
| Concentration of intracellular insulin mRNA | |
| Basal transcription rate of insulin mRNA | |
| Number of transferred insulin plasmids per engineered cell | |
| Number of genes on each insulin gene plasmid | |
| Basal expression fold of insulin promoter | |
| Insulin transcription factor concentration | |
| Hill coefficient of insulin transcription factor regulated promoter | |
| Hill Reaction Constants of Promoters Regulated by Insulin Transcription Factors | |
| Degradation rate of insulin mRNA | |
| The concentration of insulin in the engineered cell fraction | |
| Translation rate of insulin mRNA | |
| Insulin degradation rate |
There are insulin receptors on the surface of engineering cells, the concentration of which is set to

| Name | Definition |
|---|---|
| Intracellular insulin receptor concentration | |
| Basal expression rate of insulin receptor | |
| Number of insulin receptor plasmids transferred by each engineered cell | |
| Number of genes on each insulin receptor gene plasmid | |
| Degradation rate of insulin receptor | |
| Degradation rate of activated insulin receptor | |
| Rate of hydrolysis of activated insulin receptor back to ligand and receptor |
The activated
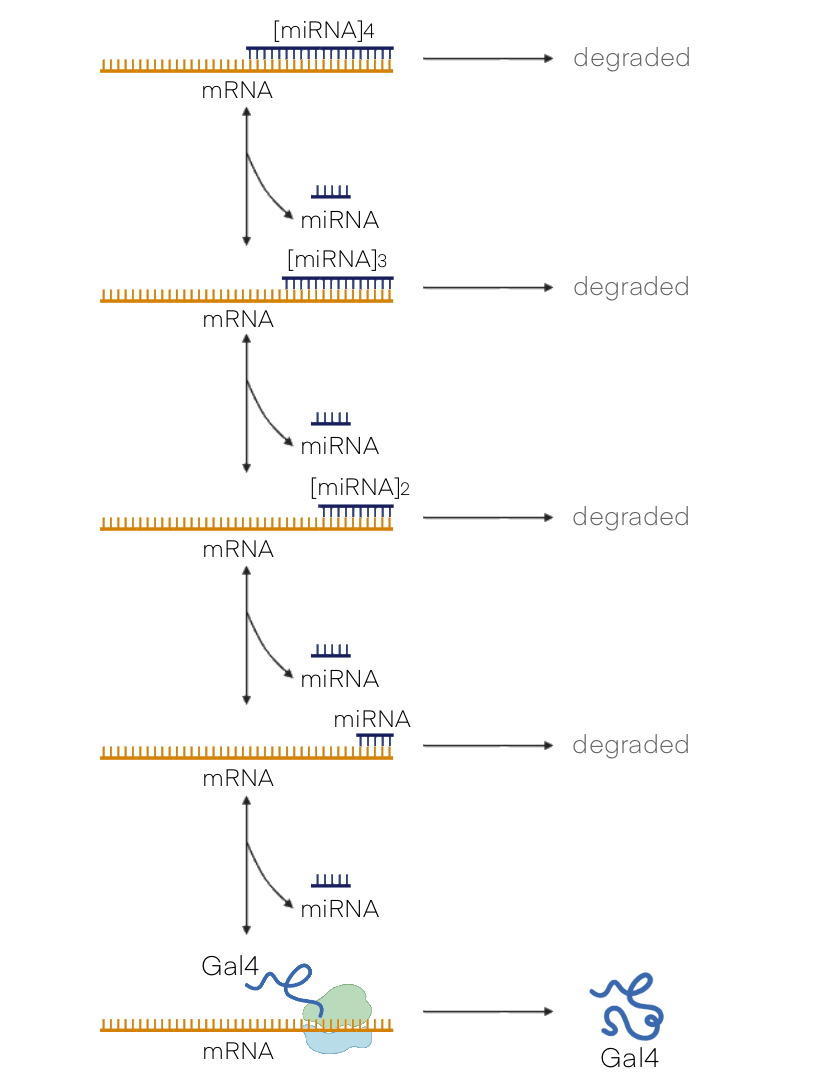
Figure3. Schematic representation of binding of Gal4 mRNA and miRNA

| Name | Definition |
|---|---|
| Insulin receptor concentration internalized by engineered cells | |
| Rate of insulin receptor internalization | |
| Rate of degradation of internalized insulin receptor | |
| Concentration of miR promoter transcription factors in engineered cells | |
| Basal expression rate of miR promoter transcription factors | |
| Number of miR promoter transcription factor plasmids transferred per engineered cell | |
| Number of genes on each miR promoter transcription factor plasmid | |
| Degradation rate of miR promoter transcription factors | |
| Basal enzymatic reaction rate at which miR promoter transcription factors are catalytically activated | |
| Michaelis constant for the catalytic activation of miR promoter transcription factors | |
| Degradation rate of activated miR promoter transcription factors | |
| MiR basal transcription rate | |
| Number of miR plasmids transferred per engineered cell | |
| Number of miR genes on each miR plasmid | |
| Basal transcriptional activity of the miR promoter | |
| Hill coefficients for activation of miR promoters by transcription factors downstream of IR | |
| Hill constant for activation of the miR promoter by transcription factors downstream of IR | |
| Degradation rate of miRs | |
| Secondary binding constant of miRNA to Gal4 mRNA | |
| Concentration of Gal4 mRNA secondarily bound to miRNA | |
| Hydrolysis constant of secondary bound mRNA | |
| Tertiary binding constant of miRNA to Gal4 mRNA | |
| Hydrolysis constant of triply bound mRNA | |
| Quaternary binding constant of miRNA to Gal4 mRNA | |
| Concentration of Gal4 mRNA bound to miRNA quartiles | |
| Hydrolysis constant of quarternary bound mRNA | |
| Quaternary binding constant of miRNA to Gal4 mRNA | |
| Degradation constant of primary bound mRNA | |
| Degradation constant of secondary bound mRNA | |
| Degradation constant of triply bound mRNA | |
| Degradation constant of quarternary bound mRNA |
Capsule Module
After

In addition, glucose also needs to diffuse into the matrix before entering the engineering cells.
| Name | Definition |
|---|---|
| Concentration of insulin in the action compartment | |
| Concentration of insulin in the virtual compartment | |
| Blood insulin concentration | |
| Insulin clearance from action compartment | |
| Insulin clearance from virtual compartment | |
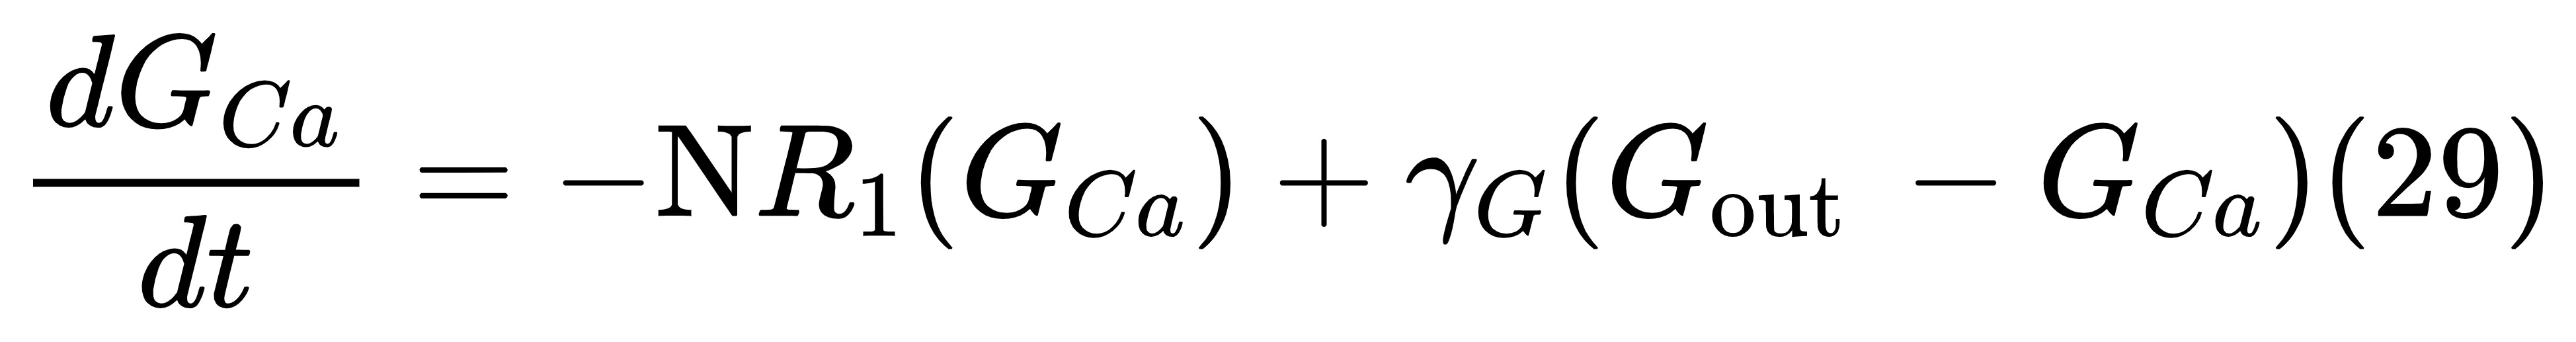
| Blood glucose concentration | |
| Glucose concentration in capsule matrix | |
| Virtual compartment glucose concentration | |
| unit conversion constant | |
| Blood basal insulin production rate | |
| Basal insulin production rate dependent on virtual compartment | |
| Rate constant of insulin production dependent on glucose excursion | |
| Diffusion Constants of Insulin in Blood and Matrix | |
| Diffusion Constants for Glucose in Blood and Matrix | |
| Blood Volume | |
| Buffered Tissue Volume | |
| Matrix Volume |
Blood and tissue module
This part of the model simulates the changes in blood glucose and insulin levels in the body under physiological and pathological conditions. When combined with the above two modules, the kinetic process of systemic blood glucose and insulin can be analyzed when Sweet Guard is running. Based on the analysis of existing data and our subsequent improvements, some notations in this module are as followed:
| Notation | Meanings |
|---|---|
| blood glucose concentration | |
| concentration of insulin in an action compartment to capture delayed insulin action | |
| insulin concentration in a virtual compartment to enable integral control action in the insulin system | |
| blood glucose concentration |
At the same time, we included an additional (virtual) intermediary compartment for glucose to allow for the adequate representation of dynamics in high intake of glucose in a short time, with a corresponding glucose concentration.
The core idea of this part is to use a proportional-integral-derivative (PID) controller to characterize the role of insulin (see references for details), and obtain equations about three insulin components:

Here, the parameters

| Name | Definition |
|---|---|
| Glucose production rate | |
| Glucose basal consumption rate | |
| Insulin-regulated glucose consumption rate | |
| Diffusion constant of glucose in blood and virtual compartment |