Team:CSU CHINA/Lab Notebook
W1(20210409-20210415)
Constructed the plasmids needed for blue light controlling system: GI-GAL4、LOV-VP16和9XUAS-Ad-LUC. We use E. coli to transform and expand complex plasmids and extract plasmids for transfection.
W2(20210416-20210422)
Prepare cell materials, serial subcultivated HEK239T cells used in formal experiments, and melt LUC cells, U2OS cells and HEK293 cell lines for backup.
W3-W5(20210423-20210513)
We practiced transformation and expansion technology and cell generation culture technology repeatedly. During this period, LUC cell contamination and HEK293T death occurred. We have summarized the problems existing in the experimental operation to avoid the same errors in the future.
W6-W7(20210514-20210527)
We conducted three preliminary experiments for blue light system, all of which are failed.
Reasons for our failure: (1) The endotoxin was not removed when extracting the plasmid, and the cell was in poor condition after transfection. (2) Transfection efficiency may be low, and components do not enter the cell. (3) The power of the blue light board is too high, and the device is overheated, resulting in cell death.
Solution: (1) Switch to a kit that can remove endotoxin. (2) Redesign the experiment and add a group of transfection GFP as a transfection efficiency monitoring group. (3) Design a blue light irradiator with lower power and better heat dissipation function.
W8(20210528-20210603)
1.Ordered new light source instruments.
2.Analisised the problems existed in experiment design and procedure, in the meantime carried out the preparation of plasmids and serial subcultivation of cells.
W9(20210603-20210609)
1. Checked the accuracy of the plasmid material sequence used for transfection in the opponent by sequencing.
2. Purchased a new reporting gene monitoring kit and received a new internal reference reporting gene plasmid.
3. Plasmids 9XUAS-As-insulin and TetR-ELK construction is completed.
W10(20210610-20210616)
Self-tested the transfection technology by transfecting GFP plasmids alone, and the transfection efficiency is about 60% after microscopic examination. After receiving the accurately sequenced sample, a large amount of amplification is carried out, and the enlarged sample is resequified to ensure accuracy.
W11 (20210617-20210623)
The blue light system test experiment in HEK293 was successful, and the absolute value of the data was low, which still needed further improvement.

W12 (20210624-20210630)
1.Plasmid INSR was successfully constructed

2.Verify INSR function
| INSR | A1 | A2 | A3 | A4 |
|---|---|---|---|---|
| INSR NC | B1 | B2 | B3 | B4 |
| NC | C1 | C2 | C3 | C4 |

 Green fluorescence of INSR expression
W13-W14 (20210701-20210714)
Review for the exam.
Cell passage.
We get the new instrument.


W15 (20210715-20210721)
1.PlasmidsGIP-miR21T-GI-Gal4-4XmiR21T,CHREBP-LUCand miR21T-LUC-4XmiR21T were built.


2.Verify that ChREBP can be induced by glucose
| 25mM | 5.6mM | 0mM | NC |
|---|---|---|---|
| A1 | A2 | A3 | A4(25mM) |
| B1 | B2 | B3 | B4(5.6mM) |
| C1 | C2 | C3 | C4(0mM) |
The experiment failed. The expression of ChREBP decreased with the increase of glucose concentration, which was contrary to the prediction. Luc / Ren = 1 / 7 for 25 mm and 5.6 mm groups, and Luc / Ren = 1 for 0 mm groups. It is speculated that the glucose solution added to sugar free DMEM was not filtered.
W16 (20210722-20210728)
1.The obtained plasmids were transformed and amplified, and the plasmids TetR elk, PMI mCherry, INSR, Ren, pEGFP, Gli Luc, mir21t-luc-4xmir21t were extracted
2.Validation experiment
| GIP promoter test experiment |
GIP-miR21T-GI-Gal4 DBD Lov-VP16 DAD pGL4.35-9xUAS-Luc Ren |
|---|---|
| Insulin expression test | GI-Gal4 DBD Lov-VP16 DAD Pgl4.35-9xUAS-insulin |
In HEK293 cells, light treatment was carried out 24 hours after transfection, and detection was carried out 24 hours after light treatment.
The result of GIP promoter test for reporting gene Luc was negative and failed. The main reasons may be insufficient sugar concentration, poor state of cells after transfection, inability of GIP promoter to play a role in HEK293 cells, etc. The solution is to detect the cell state at each time node of cell experiment, continue to consult the application literature of GIP promoter, choose sugar free medium and add glucose by yourself.
The insulin expression test was negative. At that time, it was thought that it was a problem at the level of cell experiment. Later, the experiment realized that it was a problem with the use of ELISA kit for insulin detection.
W17(20210729-20210805)
1.Plasmid pG-super-miR21 successfully constructed

2. We have conducted test experiment of GIP promoter repeatedly, test with qPCR and LUC, the results are good. GIP promoter can be used in HEK293. We continued the study of glucose concentration and the intensity of promotion.
3.The test experiment of blue light system is repeatedly conducted and the data is good as well as the reliability of the data.
4.Prove the efficiency of miR21
| pG-super-miR21 | A1 | A2 | A3 | A4 |
|---|---|---|---|---|
| pG-super | B1 | B2 | B3 | B4 |
| NC | C1 | C2 | C3 | C4 |
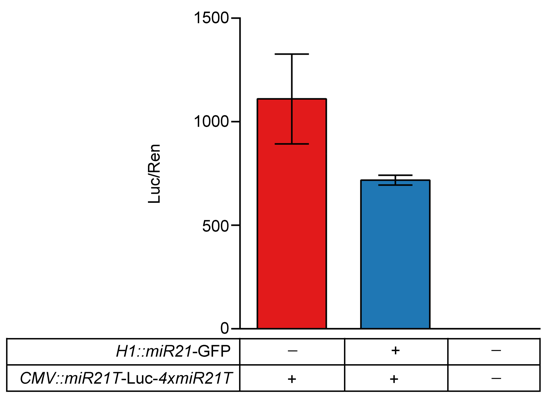
At the time of the design experiment, the first 48-hour test reported that the gene LUC/REN ratio was reported, and miR21 inhibited 40% of the expression, but this was not ideal for our design.
 .miR21 inhibited Luc expression 24h after transfection
 miR21 promoted the mRNA degradation efficiency of LUC
Considering that it may be the reason for the continuous accumulation of LUC expression, we did another 24-hour group, and the results proved that miR21 suppressed 90% of the expression, and the experimental results were very in line with our design requirements. At the same time, we also tested the mRNA degradation efficiency of miR21 accelerated target gene by qPCR method.
W18(20210806-20210812)
1.Plasmid pG-super-stemloop is constructed
2.The insulin expression test was carried out in HEK293, all of which were positive and the value was abnormally high. The main reason after analysis was that insulin was not removed from the serum used for cultured cells. The solution is to buy insulin-free serum after dialysis.
W19(20210812-20210818)
1. Repeat the insulin expression detection experiment to increase the concentration of insulin secreted as much as possible.
2. Repeat the GIP promoter test experiment, induce the sugar concentration gradient, and explore the promoter start gradient.
3. Validation experiments of repeated CHREBP and miR21T
| 25mM | 5.6mM | 0mM | NC |
|---|---|---|---|
| A1 | A2 | A3 | A4(25mM) |
| B1 | B2 | B3 | B4(5.6mM) |
| C1 | C2 | C3 | C4(0mM) |
 The expression level of inducible promoter CHREBP was respectively analyzed at 48h in 25mM, 5.6mm and 0mM glucose culture
Experiments show that CHREBP promoter is induced by glucose and the expression increases with the increase of glucose concentration.
 The expression level of inducible promoter CHREBP was respectively analyzed at 72h in 25mM, 5.6mm and 0mM glucose culture
In order to eliminate the effect of residual glucose in the culture group during transmission, we also did a 72-hour group, and the results were more in line with expectations.
W20(20210819-20210825)
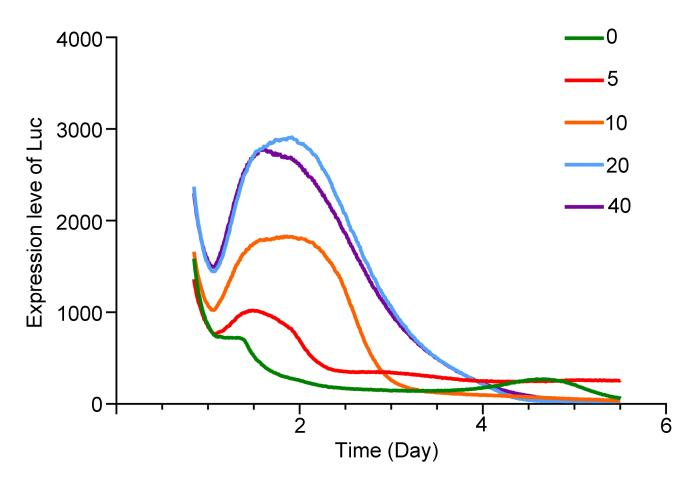
Optimization of experimental detection methods: In order to accurately determine the rhythmic period (kinetic cycle) of photocontrolled glucose-induced insulin expression in project cells, Lumincycle instrument was used for a period of continuous determination after transfection light treatment.
W21(20210826-20210901)
1. Verify the operation of MAPK phosphorylation pathway downstream of INSR, and use Western Blot to verify that the degree of phosphorylation of ERK increases with the increase of insulin concentration and insulin treatment time.
 ERK phosphorylation changes with different insulin treatment
The experimental results show that ERK can be phosphorylation, and (1) the insulin concentration must increase with the increase of insulin treatment time (2) When the insulin treatment time is fixed, the degree of phosphorylation increases with the increase of insulin concentration.
2.Verify the working situation downstream INSR MAPK phosphorylation pathway
 ERK phosphorylation changes with different insulin treatment
W22(20210902-20210908)
The glucose concentration gradient induction experiment was successful. The peak expression shown in the rhythm test was basically the same time, and the peak gradient was exactly the same as the glucose concentration induction gradient, showing a strong correlation between expression intensity and glucose concentration. The glucose perception threshold of the GIP promoter was explored, and the expression cycle after 2 hours of blue light treatment was explored. At the same time, two aspects of success were achieved!
 ERK phosphorylation changes with different insulin treatment
W23(20210909-20210915)
1. Continue to conduct blue light decision experiments with rhythm monitoring .
| Glucose | Light | Expression |
|---|---|---|
| Yes | Yes | Yes |
| Yes | No | No |
Continue to repeat the sugar concentration gradient induction experiment and improve the data as much as possible.
W24(20210916-20210922)
1.Buy colorless pedyl to make experiments involving LUC more accurate
2.Verify the entire NOT part loop. InsR, TetR-ELK, TRE-mCherry-miR21 were co-transferred with a 12-hole plate, and it was divided into insulin treatment group and control group according to the optimal conditions obtained in previous experiments. The detection methods of mCherry and qPCR by laser confocal microscope respectively were verified.
 Under Laser confocal microscopy, fluorescence of ZsGreen and mCherry expression downstream of Tet-Off system
 Transcriptional level analysis of downstream mCherry in TEt-OFF system without tetracycline
W25(20210923-20210929)
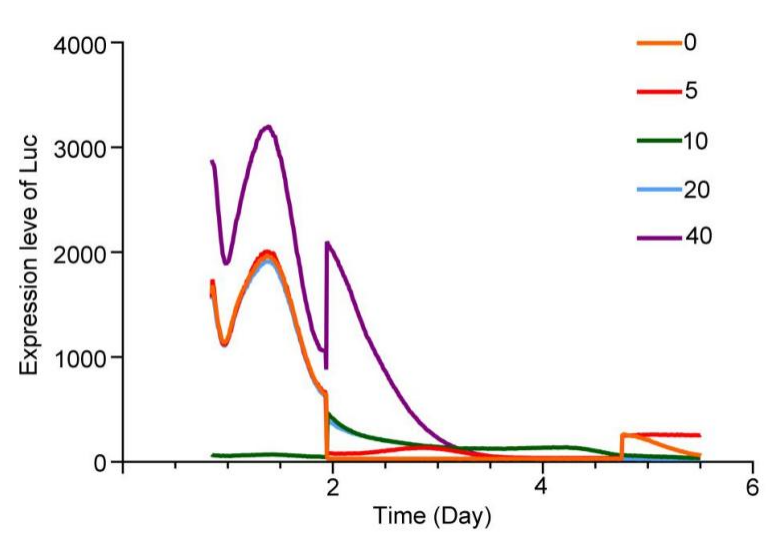
1.Using colorless culture group, glucose photocontrolled secondary induction experiments were carried out to detect the sustainability of project engineering cells.
| Group | Primary glucose concentration | Light | Second glucose concentration | Light(Second time adding the light, the light has higher intensity ) |
|---|---|---|---|---|
| 1 | 0 | Yes | 0 | Yes |
| 2 | 0 | Yes | 20 | No |
| 3 | 20 | Yes | 20 | Yes |
| 4 | Yes | No | 20 | No |
The results showed that the secondary induction reaction was rapid and obvious, and glucose concentration dependence and light intensity dependence dependence.
2. Sustained release experiment of sodium alginate for Shanghai University of Science and Technology
(1) Dissolve sodium alginate in DMEM and configure it into a 2% sodium alginate solution
(2) Add insulin to (1) sodium alginate solution to prepare 80ng/ml insulin DMEM solution
(3) Add 1.5ml sodium alginate to the 3cm petri dish, add 3ml filtered 5% CaCl2, crosslink 30s
(4) Put the cross-linked sodium alginate glue into a 10cm dish containing 10mlDMEM, collect 200 microliters of solution every 1 day, and detect insulin concentration with ELISA.
 Sodium alginate releases insulin
The results show that insulin can be released into the external environment in time through sodium alginate, which meets the requirements of our experiment.
At this point, all our loops have been tested.