Team:BUCT/Model

1 Overview
This year's modeling played an important role in our project, and due to the outbreak, we were unable to test the effectiveness of the animal testing system in order to predict the output of 5HTP and GABA and better regulate its synthesis. Our model is divided into two parts, the first part is to simulate the distribution of E. coli in the intestine over time to establish a functional relationship between E. coli volume and distribution of 5HTP and GABA yield, and the second part is to simulate suicide systems to predict the safety of engineering design.
2 Model one: Engineering bacteria movement
2.1 Basic assumptions
Considering that the linear length of the intestine is much larger than its internal diameter, in order to simplify the model, one-dimensional models may be established in the direction of its length. Based on the average intestinal length of adults, it is assumed that the total length of the intestine is 7.5 meters, of which 6 meters in the small intestine and 1.5 meters in the large intestine. At the same time, we consulted the normal 24-hour intake of fluids in the adult gut, simulating the distribution of engineered bacteria intake by adults at lunchtime until six hours later.
2.2 Engineering bacteria movement simulation
After looking up the literature, we know the frequency and magnitude of the intestinal creep in the air pressure state. Based on this, the length of the intestine is divided into reasonable intervals, and the moving equation of E. coli is cycled through time, and the distribution image is obtained.
Since the bacteria enter the human intestine in the form of distribution in a liquid, it should enter the intestines for a period of time slowly, we have made reasonable assumptions about the duration and amount of time and amount of food into the intestines.
For the movement of engineered bacteria in the intestines, we took into account factors such as E. coli moving with the eating palate and being driven by the oil attached to the surface of the intestine.
For safety reasons, E. coli intake needs to be excluded from the body for a certain period of time, and we assume that E. coli will be excluded over time by focusing on the end of the intestine waiting for the body to defecate. A suicide switch is also designed that, due to the relatively high concentration of oxygen outside, will trigger a suicide switch for the engineered bacteria, which in turn will kill E. coli.
2.3 Model results and pros and cons
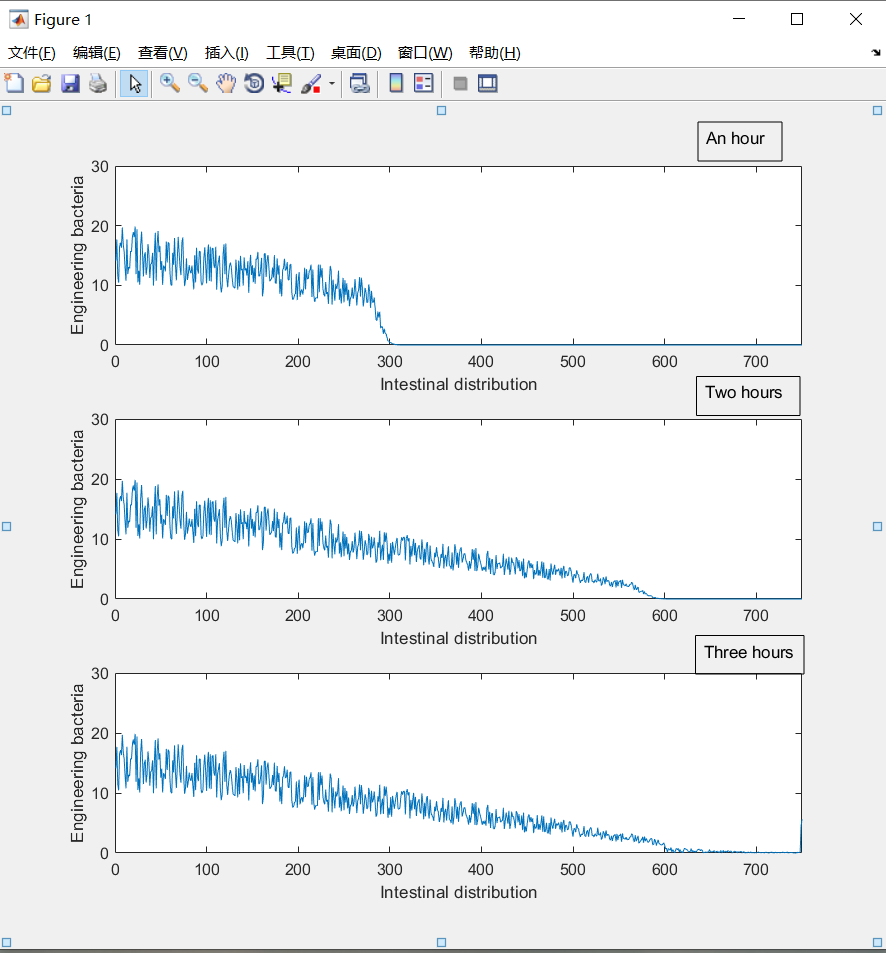
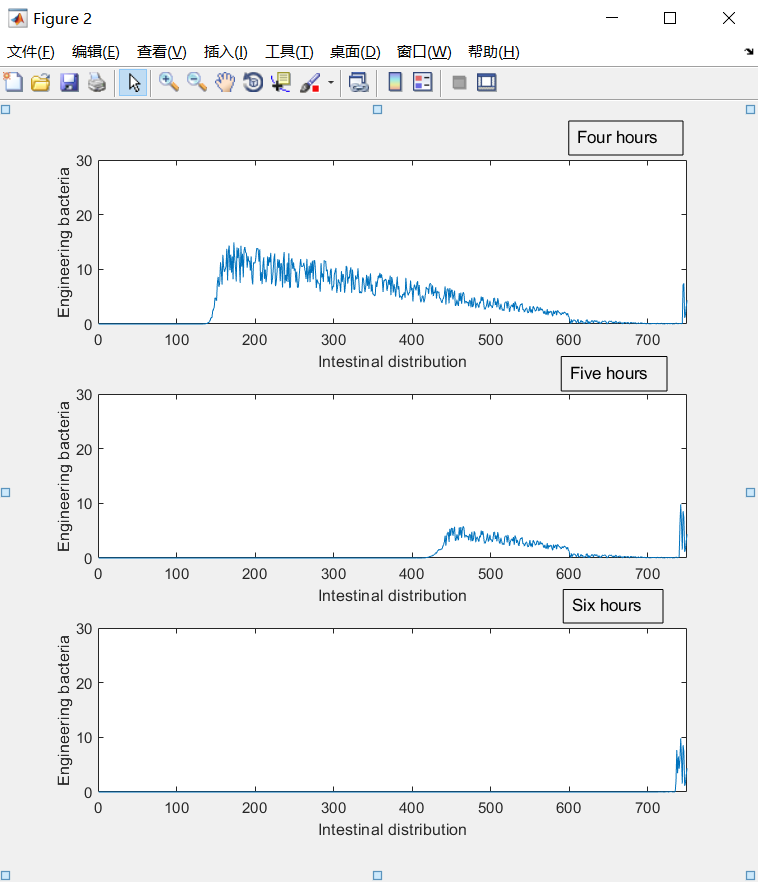
The distribution image can better reflect the relative distribution of E. coli in the intestine during this period. Considering the amount of engineered bacteria consumed, the distribution function of the model can only indicate the relative amount of E. coli ingested in various parts of the intestine, while the absolute amount of E. coli is positively correlated with the intake of E. coli.
The distribution image also reflects that after a short period of time, the vast majority of engineering bacteria will be excreted, will not affect the body.
2.4 Source
% assumes that the small intestine is 6 meters long and the large intestine is 1.5 meters long.
% is time in 10s and in 10mm intervals
%simulation predicts the distribution of E. coli populations over time within each interval
% assuming an initial E. coli population of 1 million
%2000ml liquid enters the digestive tract, where saliva 250ml, stomach fluid 500ml, bile 250ml, pancreatic fluid 500ml, food and drinking water 500ml
%90% of the liquid is absorbed in the small intestine and 8.5% of the liquid is absorbed in the large intestine
%Assuming that E. coli is evenly distributed in its initial state and that E. coli is attached to the diet, its position movement will not be affected by the absorption of moisture in the small intestine %
clc;clear;close all;
% liquid amount is calculated
T1 = zeros(3600,750);
U1 = 1000;
T1(1,1) = 1;
for i = 2:3600
T1(i,750) = T1(i-1,750)+T1(i-1,749)*0.8;
if(T1(i,750)>1)
T1(i,749) = T1(i-1,750)+T1(i-1,749)-1;
T1(i,750) = 1;
end
for j = 749:-1:701
sum1 = T1(i-1,j)*0.2+T1(i-1,j-1)*0.8;
if(T1(i,j+1)==1)
sum1 = T1(i-1,j)+T1(i-1,j-1)*0.8;
end
if(sum1>1)
T1(i,j-1) = T1(i-1,j)+T1(i-1,j-1)-1;
T1(i,j) = 1;
else
T1(i,j) = sum1;
end
end
for j = 700:-1:601
T1(i,j) = T1(i-1,j)*0.2+T1(i-1,j-1)*0.8*(1-1/((100/0.85)-(j-600)));
end
for j = 600:-1:2
T1(i,j) = T1(i-1,j)*0.2+T1(i-1,j-1)*0.8*(1-1/(600/0.9-(j-1)));
end
T1(i,1) = T1(i-1,1)*0.2;
if(U1>0.8)
T1(i,1) = T1(i,1)+0.8;
U1 = U1-0.8;
else
T1(i,1) = T1(i,1)+U1;
U1 = 0;
end
end
% Randomly simulates the lining oil of the intestine
Y1 = 5+5*rand(1,600);
Y2 = 5*rand(1,150);
Y3 = [Y1 Y2];
sumY = 0;
for i = 1:750
sumY = sumY+Y3(i);
end
Y = Y3/sumY;
%Simulated engineering bacteria move with liquids and greases
T2 = zeros(3600,750);
for i = 1:3600
for j = 1:750
T2(i,j) = T1(i,j)*Y(j)*10000;
end
end
% image display
figure(1)
for i = 1:3
subplot(3,1,i);
plot(T2(i*360,:))
xlabel('Intestinal distribution')
ylabel('Engineering bacteria')
axis([0,750,0,30])
end
figure(2)
for i = 4:6
subplot(3,1,i-3);
plot(T2(i*360,:))
xlabel('Intestinal distribution')
ylabel('Engineering bacteria')
axis([0,750,0,30])
3 Model Two
3.1 Basic assumptions
1. We assume that the suicide system of the engineered bacteria is regulated by the 2 parts .
a) The mazF by the lac promoter, while the lac promoter strength is related to the lactose concentration in the environment.
b) The mazE is regulated by the phyb promoter, and the phyb promoter is regulated by the oxygen concentration
2. We neglect the effects of dilution/ growth. We thus assume the cell’s volume to be constant over time.
3. Ignore the effects of translation regulation in this process.
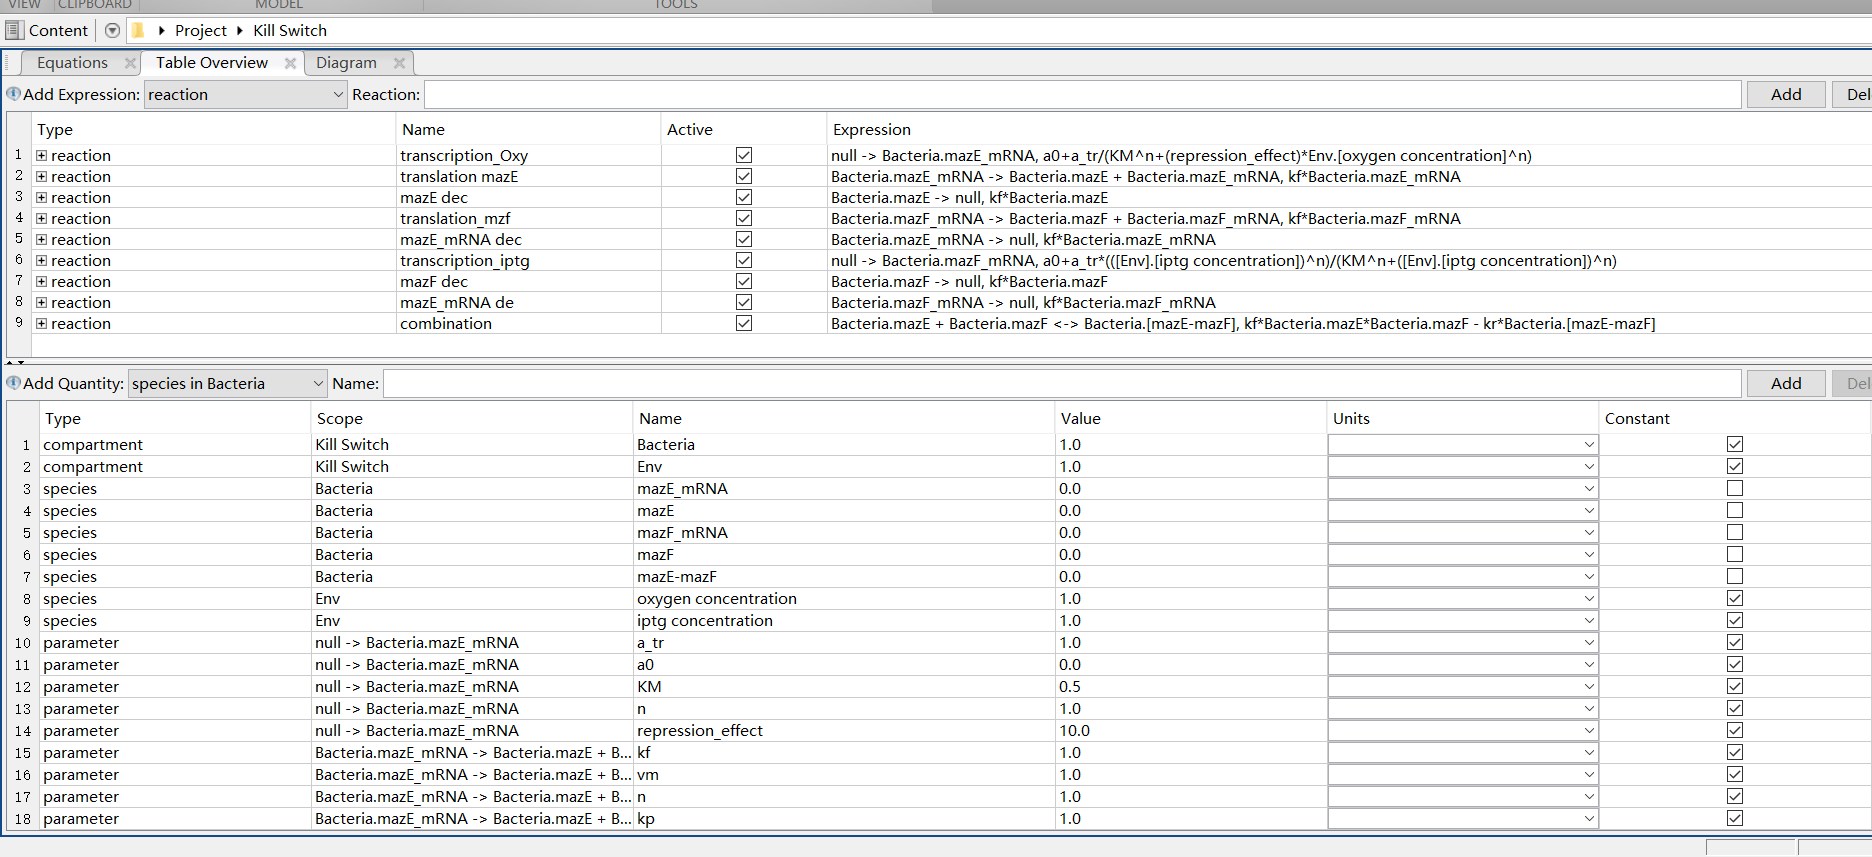
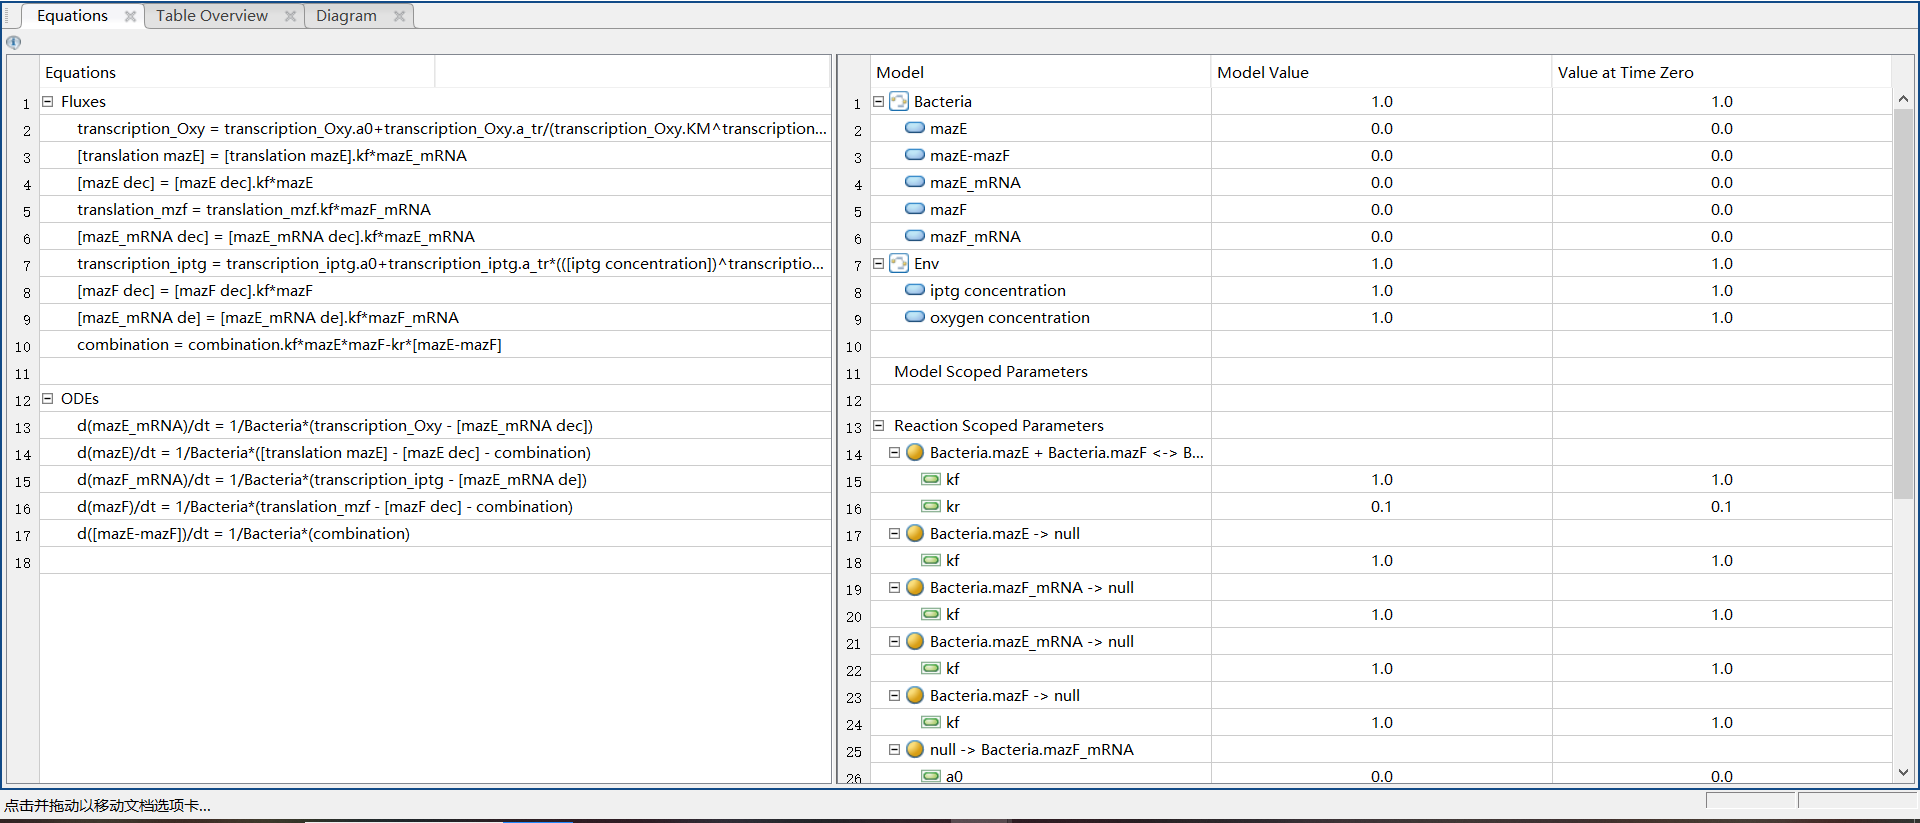
3.2 Suicide system simulation
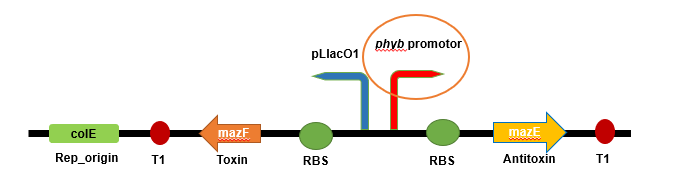
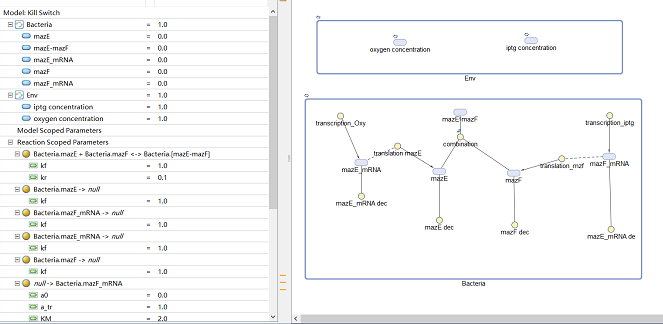
Figure. Suicide design
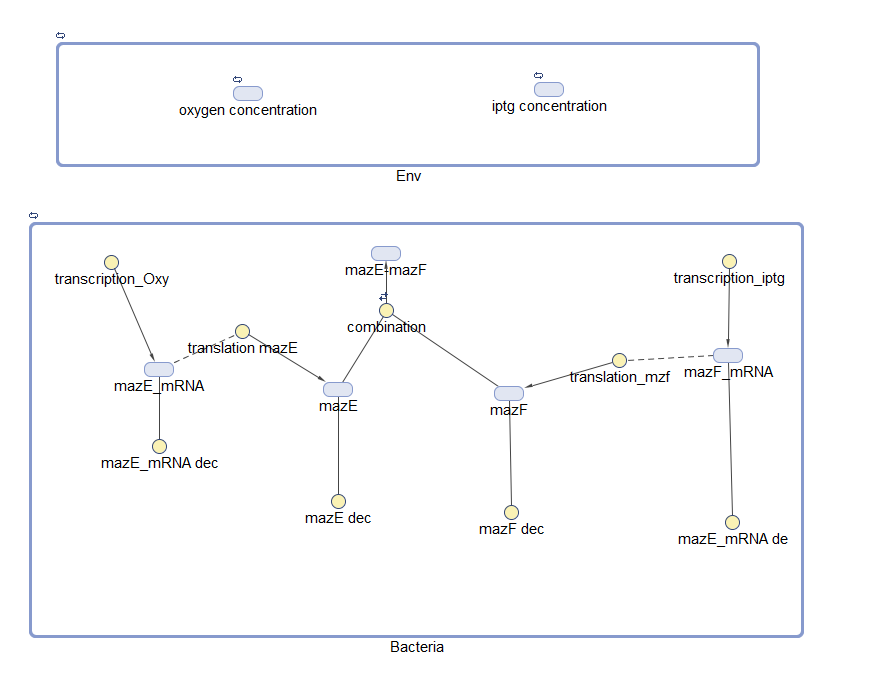
Figure. the Suicide model
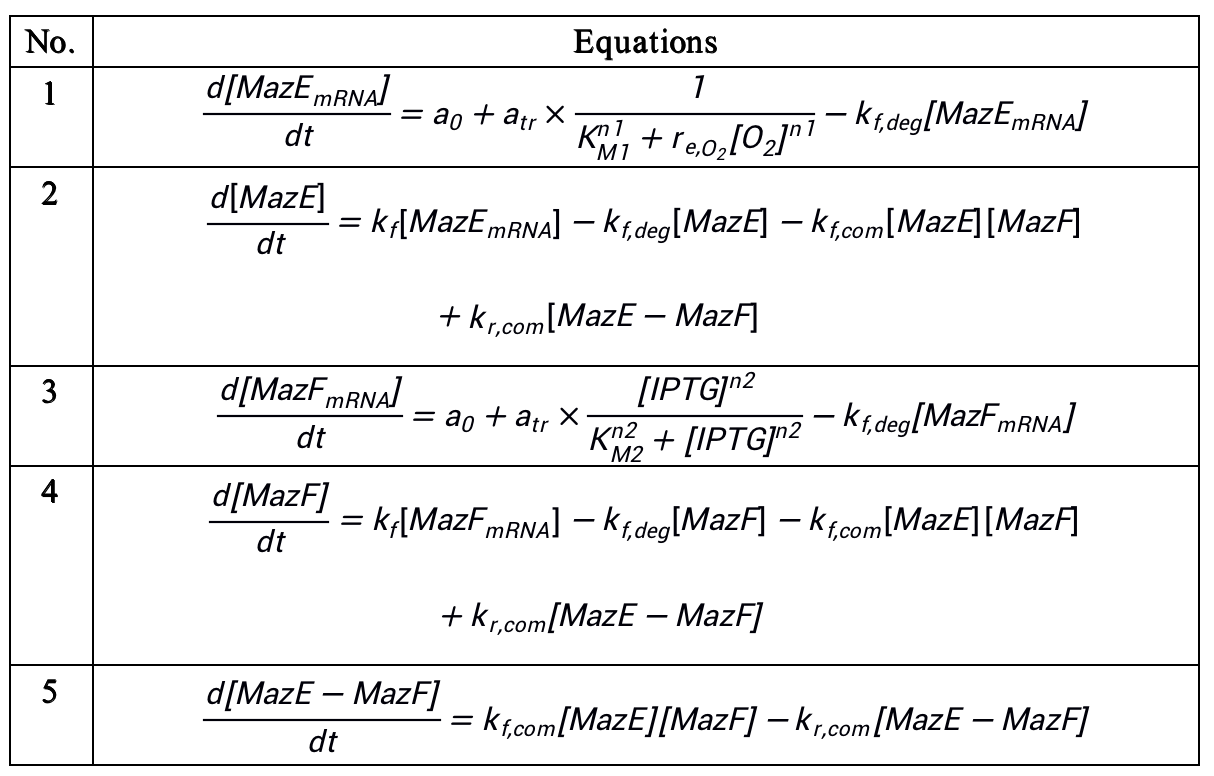
Table. 1 ODEs used in model
We simulated possible parameters, taking into account the expression of mazF and mazE, as well as the regulation of lactose concentration for lac promoters and oxygen concentration for phyb promoters, and considered that mazEF is a pair of toxin-antitoxin genes, which can be used to determine the death of bacteria.
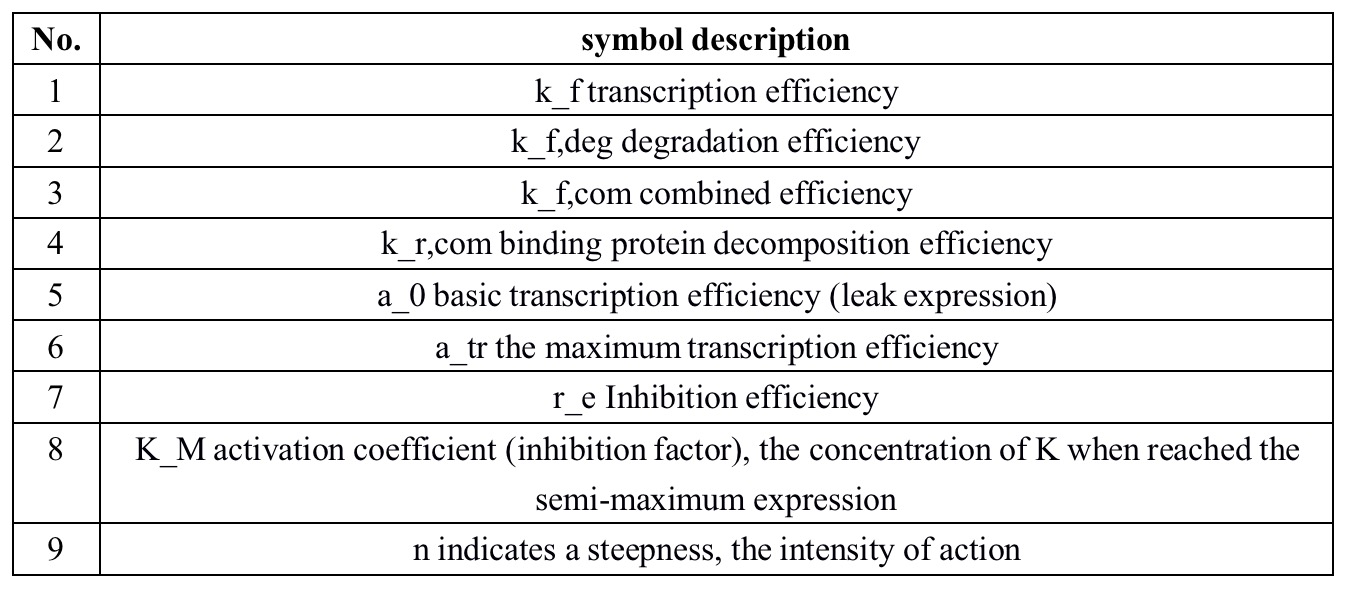
Table. 2 Symbol interpretation
3.3 Model results
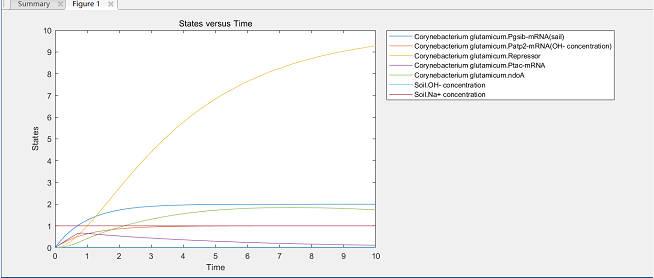
Through parameter adjustment, we believe that the vast majority of engineering bacteria will die under aerobic conditions, avoiding the problem of engineering bacteria leakage, in line with the principles of biosecurity, in the future, we plan to add more experimental parameters, add real data to optimize the modeling model.
3.4 Source
4 References
[1] Chemotaxis in Escherichia coli analyed by Three-dimensional Tracking, Nature 239:500-504, by Howard C. Berg & Douglas A. Brown
[2] Modeling E.coli Tumbles by Rotational Diffusion Implications for Chemotaxis, PLOS one, by Jonathan Saragosti, Pascal SilBerzran, Axel Buguin
[3] E. coli in Motion, Springer, by Howard C. Berg
[4] Directional persistence of chemotactic bacteria in a traveling concentration wave, PNAS, by J. Saragosti, V. Calvez, N. Bournaves, B. Perthame, A. Buguin, and P. Silberzan
The whole BUCT team would like to thank our sponsors. Especially:


Tel: 86+18718806286
Address: No.15 North Third Ring East Road,Chaoyang District,Beijing,P.R.China. Beijing University of Chemical Technology
 BUCT--iGEM
 BUCT--iGEM