
Results
Recombinant Plasmid Construction
 Figure 1. The electrophoresis results of enzyme digestion and PCR.
Lane 1 and 2: Plasmid pSU2718-p15A digested by Xba1 and BamH1.
Lane 3: Part 2, PttB344_HrpS_PJ23105_ttrR, got by PCR method with size of 2060bp.
 Figure 2 E-coil having the desired pSU2718-part2 (Left) and control (Right).
 Figure 3. The electrophoresis result of enzyme digestion identification.
Lane 1: Plasmid pSU2718-p15A digested by EcoR1.
Lane 2 to 5: Recombinant plasmid pSU2718-part2 digested by EcoRI. We got two bands with size of 2803bp and 1544bp.
The results show that we got the correct plasmid. And the plasmid was sent to sequence.
 Figure 4 The result of sequencing for plasmid pSU2718-part2.
Sequencing feedback shows we have obtained the correct plasmids which is consistent with their DNA profiles.
 Figure 5 The electrophoresis results of enzyme digestion (Middle) and PCR (Right).
Middle:
Lane 1 and 2: Plasmid pSU2718-part2 digested by HindIII.
Right:
Lane 1: Part 1, PyeaR_HrpR, got by PCR method with size of 1293bp.
 Figure 6 E-coil having the desired pSU2718-part2-part1 (Left) and control (Right).
 Figure 7 The electrophoresis result of enzyme digestion.
Lane 1: Recombinant plasmid pSU2718-part2-part1 without enzyme digestion.
Lane 2: Recombinant plasmid pSU2718-part2-part1 digested by EcoR1.
The result shows that we got the correct plasmid. And the plasmid was sent to sequence.
 Figure 8 The result of sequencing for plasmid pSU2718-part2-part1
Sequencing feedback shows we have obtained the correct plasmids which is consistent with their DNA profiles.
Function Test Results
Part1: PyeaR_HrpR, sensing NO3- to release the substance R;
Part2: PttB344_HrpS_PJ23105_ttrR, sensing S4O62- to release the substance S;
Part3: PhrpL_amilGFP_IL10_PJ23104_ttrS, will release fluorescence if sensing the substances, R and S released from Part 1(HrpR) and Part 2 (HrpS) both.
 Genetic Construction of IBD Distinguisher
Attempt 1
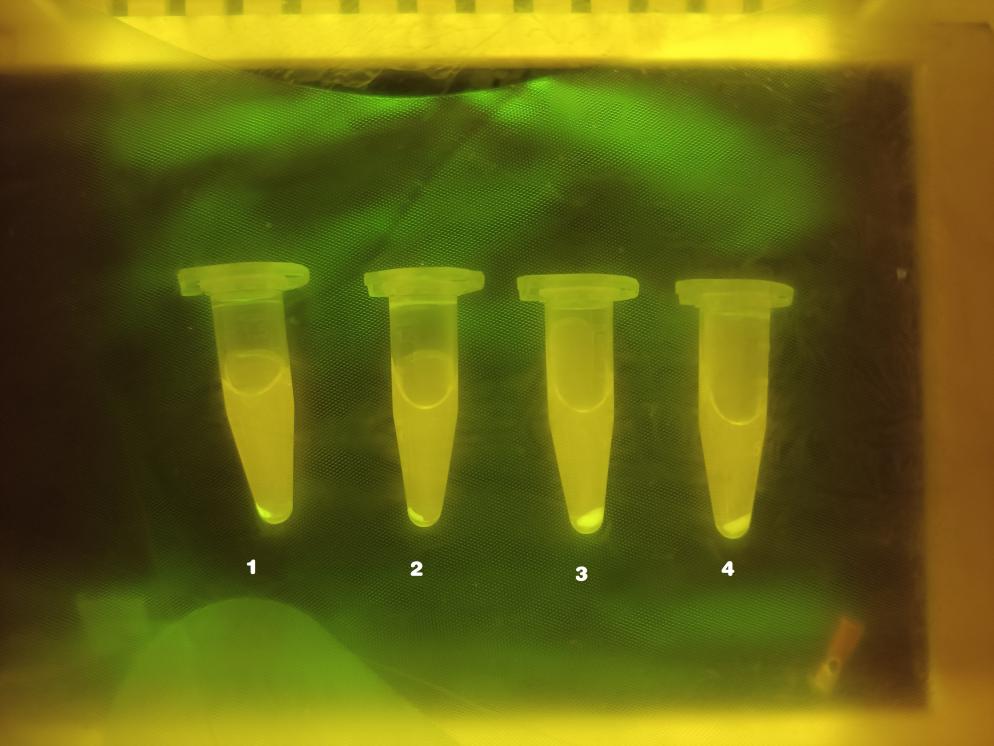 Graph 1.
Sample 1: NO3- + S4O62-
Sample 2: S4O62-
Sample 3: NO3-
Sample 4: Blank Control
As shown above, there is obvious fluorescence in sample 1 and sample 2; for sample 3 and sample 4, there also a slight fluorescence produced in the tubes. In order to scientifically quantify the result, we used ELIASA to read the accurate fluorescence intensity, respectively.

 Graph 2. Histogram of the fluorescence intensity of samples in Table 1
According to the histogram above, we can see that Sample 1 (NO3-+ S4O62-) presents obvious higher fluorescence intensity than the rest three samples which means our design working. But we do realize that Sample 2 (S4O62-) also presents fluorescence than the blank control which confused us a lot. According to our design, if we only add S4O62- without NO3-, this AND gate wouldn’t allow to pass into the reporter (Part 3) as there is a closed door of the NO3- sensor (Part 1). Therefore, we thought there was something wrong in Part 1.
In order to figure out the reason, we did several literature research and find out that the potential causes of Part 1’s failure may be that we didn’t build the NarX-NarL two-component regulator (Graph 3), which shall be the first one to sense nitrate and that is why Part 1 didn’t work fine as we expected.
 Graph 3. Genetic construction design map
Ref. Woo, Seung-Gyun, et al. "A designed whole-cell biosensor for live diagnosis of gut inflammation through nitrate sensing." Biosensors and Bioelectronics 168 (2020): 112523.
Graph 3. Genetic construction design map
Ref. Woo, Seung-Gyun, et al. "A designed whole-cell biosensor for live diagnosis of gut inflammation through nitrate sensing." Biosensors and Bioelectronics 168 (2020): 112523.
Attempt 2
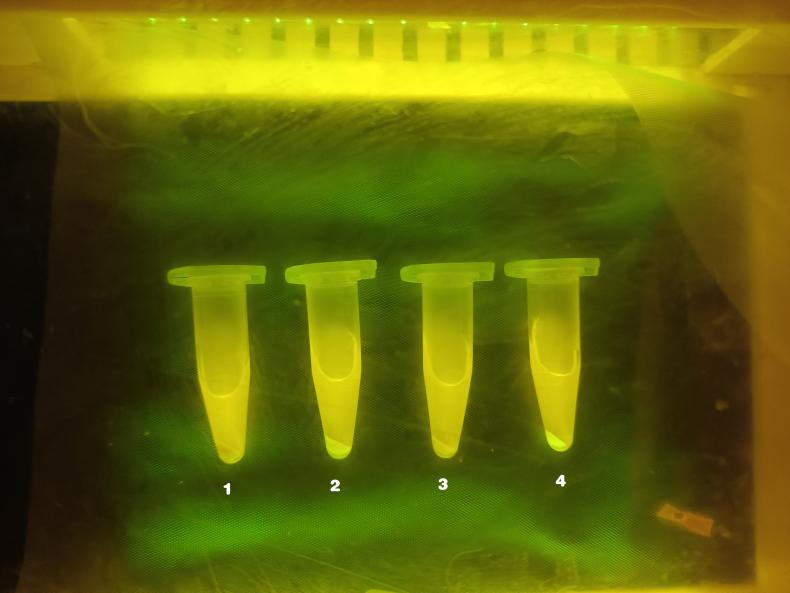 Graph 4.
Sample 1: Negative Control (E. coli)
Sample 2: Positive Control (E. coli/amilGFp)
Sample 3: E. coli/pUC-57_Part 3
Sample 4: E.coli/pSU2718-Part 1_Part 2+pUC-57_Part 3
In order to further analyze the performance of Part 2, we also designed the control groups as showing above where Sample 1 and Sample 2 were presented as the comparison of the fluorescence phenomenon. We can see that there was no fluorescence in Sample 3 (the report part, Part 3). According to the result of Sample 3 and Sample 4 (Graph 4), we could infer that the AND gate design works (HrpR_HrpS, PhrpL) as the Part 3 didn’t respond when there is no Part 1 and Part 2.
Of course, we also repeated the experiments and measured the fluorescence intensity by ELIASA. The data is given below.

 Graph 5. Histograms of the fluorescence intensity of samples in Table 2
 Graph 6. Trend Contrast of the fluorescence intensity between that under OD600=0.8 and that under OD600=1
According to the trend in Graph 6, the fluorescence intensity of pUC57-Part 3 presents the similar level as that of blank control and group NO3-, which means the “gate keeper” promoter, PhrpL works well and this conclusion also back up the conclusion that the AND gate design works well (HrpR_HrpS, PhrpL).
As the group S4O62- did present higher fluorescence intensity than that of group NO3- whenever OD600 equals to 0.8 or 1, it indicates that Part 2 and Part 3 both works well as Part 2 did show “green light” to the tetrathionate to finally “light” the Part 3.
Future Plan
So far we have ensured that Part 2, Part 3 and also the AND gate design work, we need to improve the design of Part 1 which is used to sense nitrate so that we could fully complete the whole biosensor construction to diagnose IBD.
Besides, we also have concerns about the biosensor carrier, E. coli. Firstly, we need ensure that our engineered bacteria would not be immediately degraded or eliminated by other enteric microorganism. Secondly, E.coli may have adverse effects such as septicemia in patients with immune deficiency to the gut microbiome. In the future, safer bacteria like lactobacillus should be found as carrier receptors for transformation.