
Modeling
In order analyze the relationship between OD600 and the fluorescence intensity, we built a model by MATLAB.
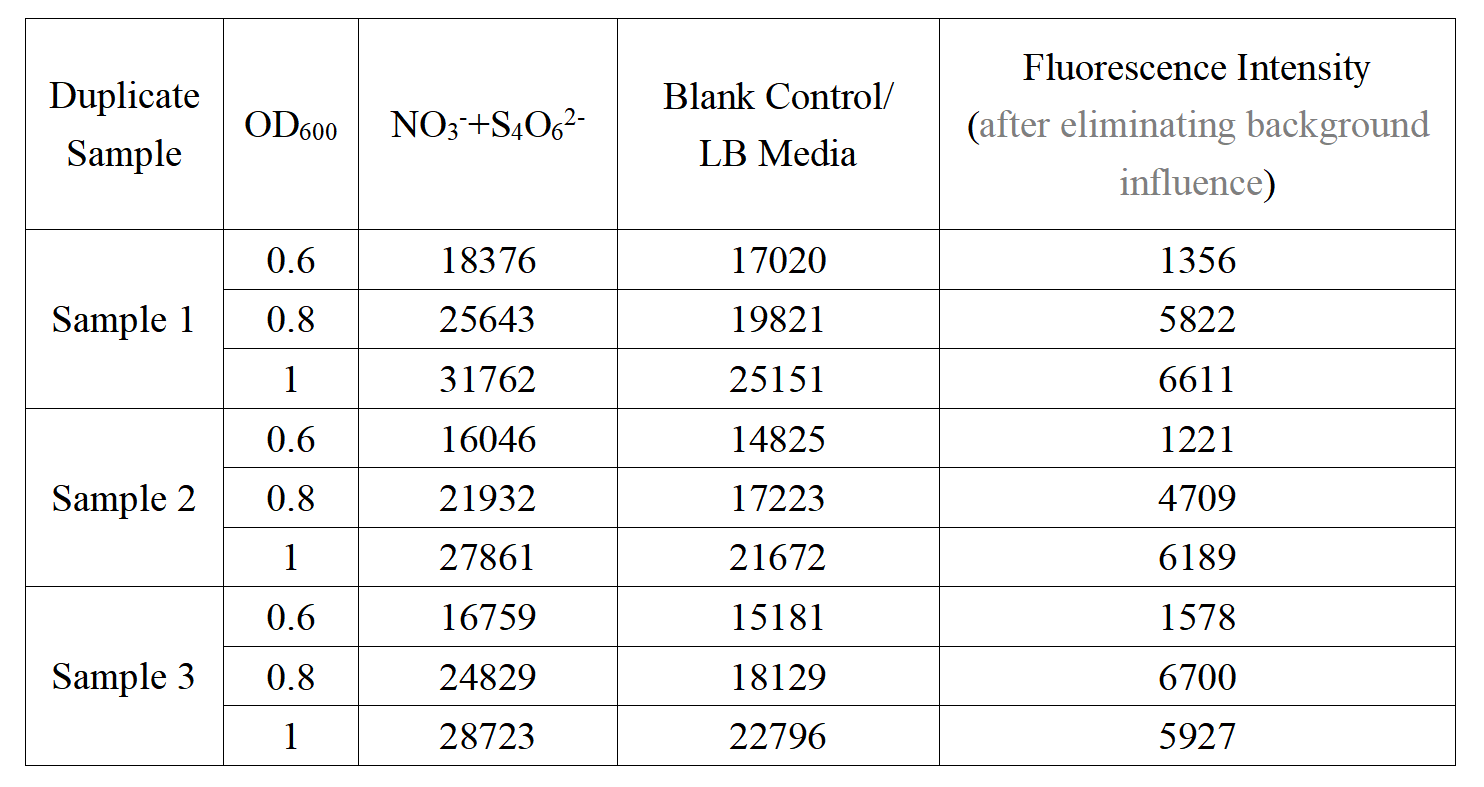
Below is the data table:
After roughly analyze the scatter plots, we chose to use the quadratic polynomial equation to adapt to our data:
Coding we used in MATLAB is given below:
clear;clc;
od0=[0.6 0.8 1];
intensity1=[1356 5822 6611];
intensity2=[1221 4709 6189];
intensity3=[1578 6700 5927];
intensity0=(intensity1+intensity2+intensity3)/3;
p=polyfit(od0,intensity0,2);
od=[0.6:0.01:1];
intensity=polyval(p,od);
plot(od,intensity,'LineWidth',2)
ymax=max(intensity)
i=find(intensity==max(intensity));
xmax=od(i)
hold on
plot(od0,intensity0,'r*','LineWidth',2)
plot(xmax,ymax,'g*','LineWidth',2)
hold off
After calculation, the constants of this model are listed below:
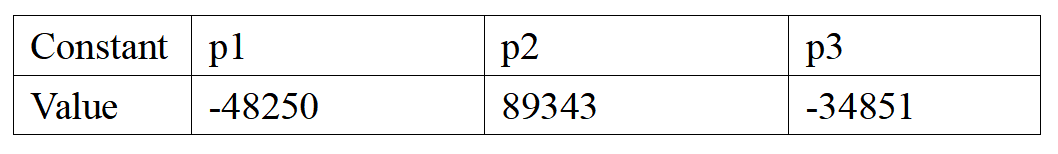
Therefore the final model would be:
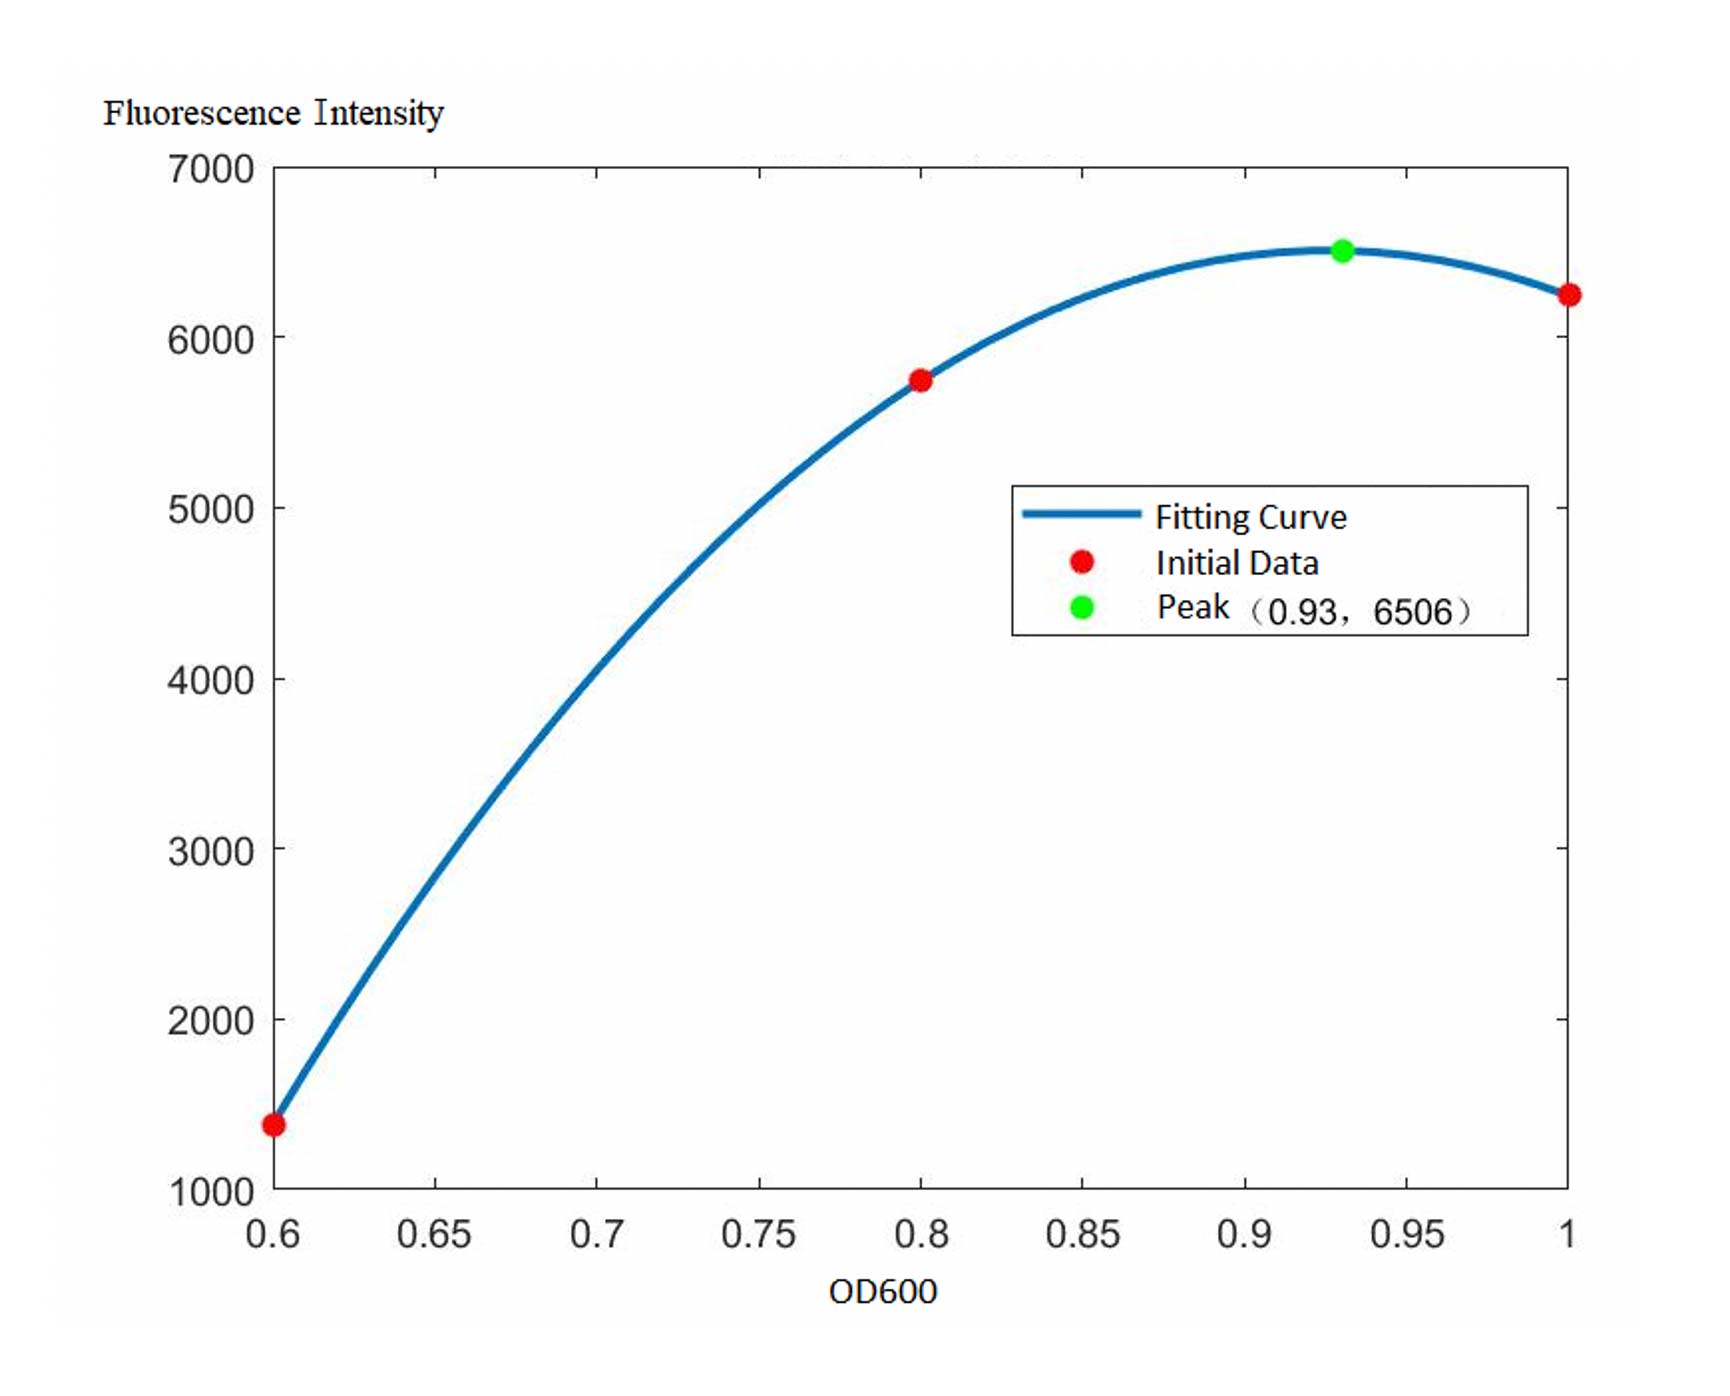 Figure 1. The fitting curve of the model f(x)=-48250x^2+89343x-34851
According to the fitting curve above, it indicates that the optimal condition for our biosensor to detect IBD related compounds, would be the time when OD600 reaches 0.93 around. This result could be also served as a reference for more performance tests in the future after we complete the improvement of our biosensor genetic design.