Team:Greece United/Model/Circuit


Introduction
As analyzed in the exosome model
overview,
we created a genetic circuit, utilizing the CellDesigner v4.4 software, aiming to investigate the
feasibility of our proposed implementation and
develop an approach to tackle the "low transfection" problem the Wet Lab team
encountered (Goal #3).
We also used this Genetic Circuit Model in combination with the Exosome Production Model to to draw
conclusions on the general
functionality of our proposed implementation (Goal #4).
The genetic circuit consists of 5 parts, those being the Sensor, the Amplifier, the Effector, the
Thresholder and the Repressor.
Each part plays a key role in the function of the genetic circuit, and its inclusion is vital for it
to work as intended.
The Sensor and the Amplifier, create and enhance the signal respectively, so that the Effector will
be activated.
At the same time the Thresholder and the Repressor keep the rest of the genes in check by forbidding
their activation
and/or stopping their production (“turning it off”) at will, through the Safety Switch, if need be.
You can find specific information on the exact function of each part in the Wet Lab section of our Wiki.
You can find our designed as .xml executable through CellDesigner, MatLab or anyother program that
works with SBML in our github.
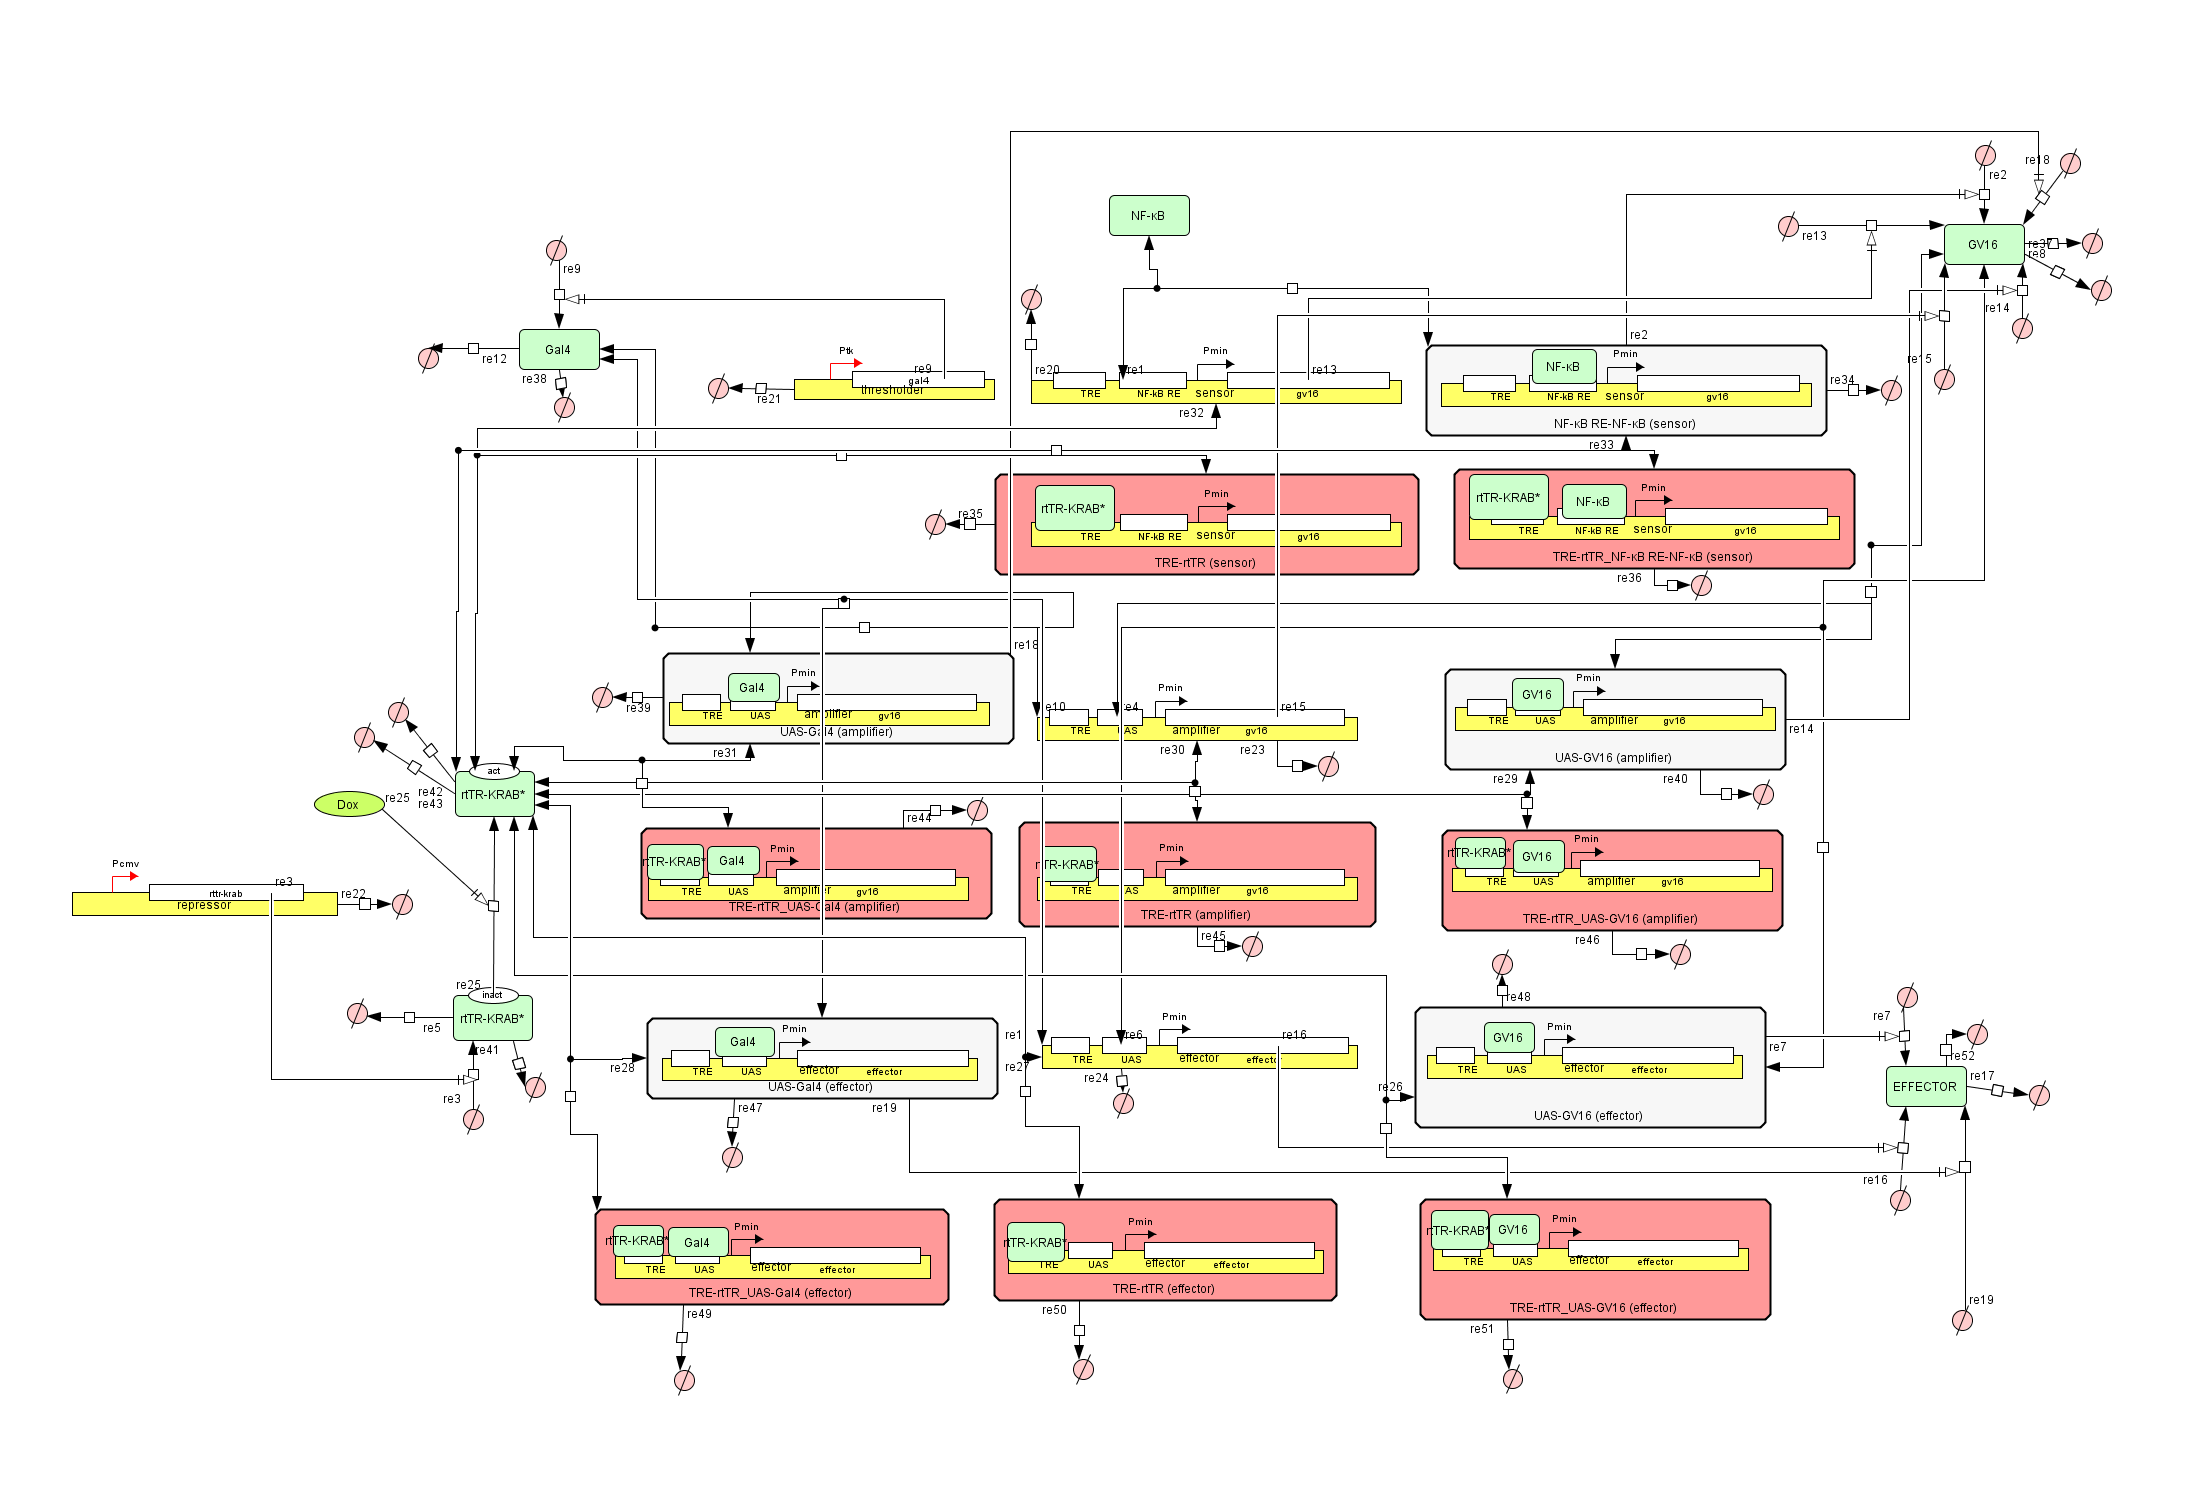
Figure 1: The Genetic Circuit Model in CellDesigner v4.4
How the Genetic Circuit Model works
At first glance the circuit might look intimidating, but it is composed of
small simple parts, working together in harmony.
Let’s take it step by step and explain how it works.
There are exactly 10 species used in the entirety of the circuit. Those are the above-mentioned
genes, the NF-kB, Gal4-GV16, Gal4 and rtTR-KRAB
proteins as well as the products of the Effector which can be anything.
The red and uncolored rectangles are complexes created from the combination of genes, transcription
factors and/or inhibiting proteins.
These complex formations are described by the following equation type:
$$\small \frac{d[𝑇𝐹-𝐷𝑁𝐴]}{dt} = k_a * [TF] * [DNA] − k_d * [TF-DNA]$$
where:
$$\small TF = \;Transcription \;factor$$
$$\small DNA = \;Concentration\; of\; the\; Gene$$
$$\small TF-DNA = \;Gene-Transcription\; Factor \;complex$$
$$\small k_a = \;Binding \;constant\; of \;the\; Transcription\; Factor \;to\; its\; corresponding\;
promoter$$
$$\small k_b = Unbinding constant of the Transcription Factor to its corresponding promoter$$
The correct combination of a gene and a transcription factor enables the gene to be expressed and
synthesize the corresponding protein.
$$\small \frac{d[P]}{dt} = k_s * [TF-DNA]$$
where:
$$ P = \;Protein\; product\; of\; the gene $$
$$ k_s = \;Protein \;synthesis \;constant$$
Complexes that contain the activated rtTR-KRAB* protein are considered inactive but have a small
synthesis rate due to leaky protein production.
$$\small \frac{d[P]}{dt} = k_l * [DNA]$$
where:
$$ k_l = \;Leaky\; protein \;synthesis\; constant $$
The Thresholder and Repressor genes are not activated by a protein of the genetic circuit.
They are constantly expressed utilizing transcription factors native to the cell, in order to
maintain their restrictive function.
Also, the product of the Repressor, the rtTR-KRAB protein, is in its inactivate state and can only
be activated via the existence of
the Doxycycline (Dox) in the cells environment. This interaction is described by the following
equation:
$$\small \frac{d[rtTR-KRAB^{*}]}{dt} = [rtTR-KRAB] * [Dox] * k_dox$$
where:
$$k_dox =\; Doxycycline – rtTR-KRAB \;association\;constant$$
Finally, we have the degradation of the proteins into aminoacids (aa) and the disassembly of the
gene array due to cell dilution.
$$\small \frac{d[aa]}{dt} = [P]* k_{deg-p}$$
and
$$\small \frac{d[lost]}{dt} = [Gene]* k_{dil}$$
where:
$$k_{deg-p} =\; Degradation \;rate \;of \;a\;protein$$
$$k_{dil} = \;Dillution \;constant$$
Why we created the Genetic Circuit model
During the development of the project, a problem occurred. We named the “low transfection” problem,
because Mesenchymal Stem Cells are very difficult to transfect considering time, skills and
resources.
The fact that we needed to do so with 5 different plasmids didn’t help our situation.
Our solution was to create this model, to determine whether we could exclude some parts of it in
order to reduce the number of plasmids while
maintaining a significant amount of its functionality. In a different turn of events, we would use
the simulations of the genetic circuit to
demonstrate how this solution would function in close to real-life conditions and compare the
results with the Wet Lab approach.
Results
The first exclusion was to the amplifier construct. We ran the simulation in CellDesigner and MATLAB.
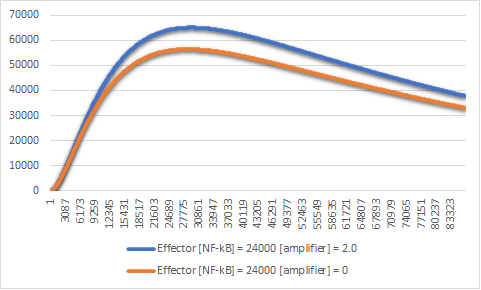
Figure 3:Effector expression levels in different values of the amplifier construct.
The exclusion of the amplifier construct reduces the expression of the effector by a significant
amount (Figure 3).
This small amount means that we can theoretically exclude it from the genetic circuit.
But in order for this solution to work, we have to exclude at least one more plasmid.
The next construct we tested was that of the thresholder.
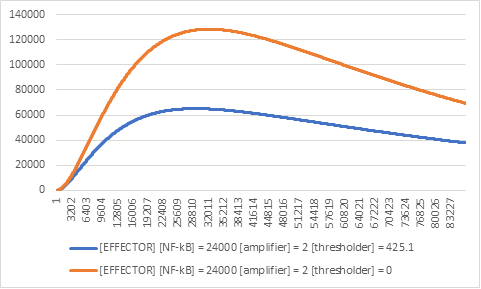
Figure 4:Effector expression levels in different values of the thresholder construct.
The results were like those of the exclusion of the amplifier construct, although in this case for a different reason. The fact that there is an increased expression of the effector construct (Figure 4), meant that if there was no NF-kB in the cells, we would have noticeable gene expression, therefore interfering with the wet lab results.
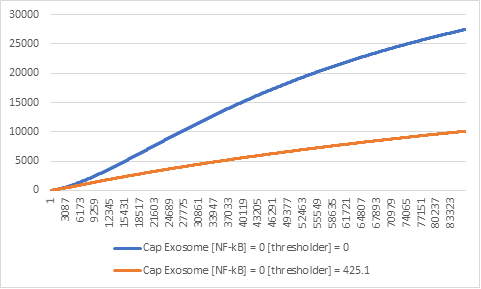
Figure 5: Effector expression levels in different values of Thresholder.
The absence of the thresholder construct can result in misleading results in the lab and
uncontrollable expression (Figure 5).
This comes in direct contrast with the reason we use the genetic circuit in the first place.
Therefore, we concluded that its existence is necessary.
The same can be said for the repressor construct, whose exclusion would leave us unable to turn off
the circuit entirely.
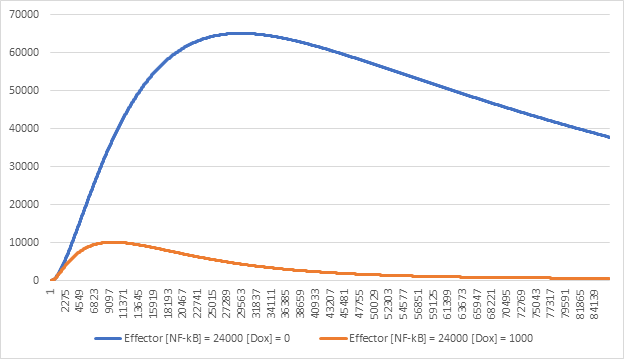
Figure 6:Effector expression levels in different values of Doxycycline (Dox)
As we can see in Figure 6 the repressor construct has a very important role in the regulation of our
circuit and its removal
might prove to be more of an obstacle rather than a boost.
After careful thought and examination of our simulation results, we concluded that we cannot use
less than 4 plasmid constructs
and abandoned the lab experiment altogether. This is how the genetic circuit model contributed to
the aid of the Wet Lab, as well
as the construction of the hybrid model that combines the genetic circuit and the exosome production
model, to test our idea from
NF-kB to CAP-Exosome production.
Equations : General Categories
In this table, you can find the general categories of the equations used to build our Genetic Circuit Model.
|
Equation |
Description |
| $$\small \frac{d[TF-DNA]}{dt} = [TF] * [DNA] * k_{a} - [TF-DNA] * k_{d}$$ |
This type of equation describes how a transcription factor (TF) binds and unbinds to a gene (DNA) to form a transcription factor-gene complex (TF-DNA), based on two constants named ka and kd for binding and unbinding respectively |
| $$\small \frac{d[Sensor NFkB Complex]}{dt} = [NFkB] * [Sensor] * k_{aNFkB} - [Sensor Complex] * k_{dNFkB}$$ |
Here is an example of the previously mentioned equation type. |
| $$\small \frac{d[P]}{dt} = [TF-DNA] * k_{s}$$ |
This type of equation describes the transcription and translation of a protein, based on the concentration of the transcription factor and gene complex (TF – DNA). |
| $$\small \frac{d[GV16]}{dt} = [Sensor NFkB Complex] * k_{s}$$ |
Here is an example of the previously mentioned equation type. |
| $$\small \frac{d[P]}{dt} = [DNA] * k_{l}$$ |
This type of equation describes the transcription and translation of a protein based on the basal protein expression rate. |
| $$\small \frac{d[Effector \; Construct]}{dt} = [Gal4 (effector)] * k_{l} * 0.01$$ |
Here is an example of the previously mentioned equation type. |
Equations
In this table, you can find the equations used to build our Genetic Circuit Model
|
Equation |
Description |
| $$\small \frac{d[Sensor NFkB Complex]}{dt}= $$ $$[NFkB] * [Sensor] * k_{aNFkB}$$ $$ - [Sensor Complex] * k_{dNFkB}$$ |
Binding and dissociation of NF-κB to the sensor construct |
| $$\small \frac{d[GV16]}{dt} = [Sensor NFkB Complex] * k_{s}$$ |
Production of Gal4 - VP16 from amino acids. |
| $$\small \frac{d[GV16 (amplifier)] } {dt} = [GV16]*[Amplifier]*k_{aGV16} - [GV16(amplifier)] * k_{dGV16}$$ |
Binding and dissociation of Gal4 - VP16 to the amplifier construct. |
| $$\small \frac{d[Amino Acids]}{dt} = [rtTR-KRAB] * k_{deg}$$ |
Inactive rtTR - KRAB degradation. |
| $$\small \frac{d[GV16 (amplifier)]}{dt} = $$ $$[GV16] * [Effector Gene] * k_{aGV16} - $$ $$ [GV16 (effector)] * {k_dGV16}$$ |
Binding and dissociation of Gal4 - VP16 to the effector construct. |
| $$\small \frac{d[Effector Construct]}{dt} = [GV16 (effector)] * k_{s}$$ |
Production of luciferase reporter from amino acids. |
| $$\small \frac{d[Amino Acids]}{dt} = [GV16] * k_{degGV16} $$ |
Gal4 - VP16 degradation to amino acids. |
| $$\small \frac{d[Gal4]}{dt} = [Thresholder Gene] * k_{s} * 0.01$$ |
Gal4 - VP16 degradation to amino acids. |
| $$\small \frac{d[Gal4(effector)]}{dt} $$ $$= [Gal4] * [Effector Gene] *k_{aGV16} - $$ $$[Gal4(effector)]*k_{dGV16}$$ |
Binding and dissociation of Gal4 to the amplifier construct. |
| $$\small \frac{d[GV16]}{dt} = [Sensors] * k_{l} $$ |
Leaky production of Gal4 - VP16 from amino acids. |
| $$\small \frac{d[GV16]}{dt} = [GV16 (amplifier)] * k_{s} $$ |
Production of Gal4 - VP16 from amino acids. |
| $$\small \frac{d[GV16]}{dt} = [Amplifier Gene] * k_{l} $$ |
Leaky production of Gal4 - VP16 from amino acids. |
| $$\small \frac{d[Effector Protein]}{dt} = [Effector Gene] * k_{l} $$ |
Leaky production of luciferase reporter from amino acids. |
| $$\small \frac{d[Amino Acids]}{dt} = [Effector Construct] * k_{degGluv} $$ |
Luciferase reporter degradation to amino acids. |
| $$\small \frac{d[GV16]}{dt} = [Thresholder Gene] * k_{l} * 0.01$$ |
Leaky production of Gal4 - VP16 from amino acids. The repressed leaky production rate was set to 1% of the unrepressed leaky production rate. |
| $$\small \frac{d[Effector Construct]}{dt} = [Gal4 (effector)] * k_{l} * 0.01$$ |
Leaky production of luciferace from amino acids. The repressed leaky production rate was set to 1% of the unrepressed leaky production rate. |
| $$\small \frac{d[Cell Division]}{dt} = [Sensor] * k_{dil} $$ |
Dilution of the sensor construct due to cell division. |
| $$\small \frac{d[Cell Division]}{dt} = [Thresholder Gene] * k_{dil} $$ |
Dilution of the thresholder construct due to cell division. |
| $$\small \frac{d[Cell Division]}{dt} = [Repressor Gene] * k_{dil} $$ |
Dilution of the repressor construct due to cell division. |
| $$\small \frac{d[Cell Division]}{dt} = [Amplifier Gene] * k_{dil} $$ |
Dilution of the amplifier construct due to cell division. |
| $$\small \frac{d[Cell Division]}{dt} = [Effector Gene] * k_{dil} $$ |
Dilution of the effector construct due to cell division |
| $$\small \frac{d[rtTRKRAB Dox Complex]}{dt} = [rtTR-KRAB] * [Dox]*k_{dox} $$ |
Binding of doxycycline to an inactive rtTR–KRAB, producing an active rtTR–KRAB*. |
| $$\small \frac{d[rtTRKRAB GV16 Complex (effector)]}{dt} = $$ $$[rtTR-KRAB Dox Complex] * [GV16 (effector)]*k_{artTR} - $$ $$[rtTR-KRAB - GV16 Complex (effector)] * k_{drtTR}$$ |
Binding and dissociation of rtTR – KRAB to the Gal4 - VP16 bound effector construct. |
| $$\small \frac{d[rtTRKRAB (effector)]}{dt} = $$ $$[rtTR-KRAB Dox Complex] * [Effector Gene]*k_{artTR} - $$ $$[rtTRKRAB(effector)]*k_{drtTR}$$ |
Binding and dissociation of rtTR – KRAB to the effector construct. |
| $$\small \frac{d[rtTRKRAB-GV16 Complex (amplifier)]}{dt} = $$ $$[rtTR-KRAB Dox Complex] *[GV16(amplifier)] * k_{artTR} - $$ $$ [rtTRKRAB-GV16 Complex (amplifier)]* k_{drtTR}$$ |
Binding and dissociation of rtTR – KRAB to the Gal4 - VP16 bound amplifier construct. |
| $$\small \frac{d[rtTRKRAB-Gal4 Complex (amplifier)]}{dt} = $$ $$ [rtTR-KRAB Dox Complex] * [Gal4 (amplifier)] * k_{artTR} - $$ $$ [rtTRKRAB -Gal4 Complex (amplifier)] * k_{drtTR}$$ |
Binding and dissociation of rtTR – KRAB to the Gal4 bound amplifier construct. |
| $$\small \frac{d[rtTRKRAB (sensor)]}{dt} =$$ $$ [rtTR-KRAB Dox Complex] * [Sensor] * k_{artTR} - $$ $$ [rtTRKRAB (sensor)] * k_{drtTR}$$ |
Binding and dissociation of rtTR – KRAB to the sensor construct. |
| $$\small \frac{d[rtTRKRAB NFkB (sensor)]}{dt} =$$ $$ [rtTR-KRAB Dox Complex] * [NFkB (Sensor)] *k_{artTR} - $$ $$[rtTRKRAB NFkB Complex (sensor)] * k_{drtTR}$$ |
Binding and dissociation of rtTR – KRAB to the NFkB bound sensor construct. |
| $$\small \frac{d[Cell Division]}{dt} = [NFkB (Sensor)] * k_{dil} $$ |
Dilution of the NFkB bound sensor construct due to cell division. |
| $$\small \frac{d[Cell Division]}{dt} = [rtTR-KRAB (Sensor)] * k_{dil} $$ |
Dilution of the rtTR – KRAB bound sensor construct due to cell division. |
Model Parts
In this table, you can find the parts (DNA, RNA, Proteins) used to build our Exosome Production Model.
|
Class |
Name |
id |
Boundary Condition |
Description |
|
GENE |
sensor |
S1 |
False |
Sensor construct |
|
GENE |
amplifier |
S19 |
False |
Amplifier construct |
|
GENE |
effector |
S28 |
False |
Effector Construct |
|
GENE |
repressor |
S15 |
False |
OFF-switch construct |
|
GENE |
thresholder |
S29 |
False |
Thresholder construct |
|
PROTEIN |
GV16 |
S54 |
False |
Gal4-VP16 Transcription Factor |
|
PROTEIN |
NF-kappa-B |
S45 |
False |
NF-kB input signal |
|
PROTEIN |
EFFECTOR |
S57 |
False |
Genetic circuit output |
|
PROTEIN |
rtTR-KRAB |
S8 |
False |
Inactive rtTR-KRAB transcriptional repressor |
|
COMPLEX |
NF - _kappa_B RE - NF - _kappa_B (sensor) |
S43 |
False |
NF-κB in complex with the sensor construct |
|
COMPLEX |
TRE-rtTR (sensor) |
S40 |
False |
rtTR-KRAB in complex with the sensor construct |
|
COMPLEX |
TRE - rtTR_NF - _kappa_B RENF - _kappa_B (sensor) |
S39 |
False |
NF-κB and rtTR-KRAB in complex with the sensor construct |
|
COMPLEX |
UAS-GV16 (effector) |
S34 |
False |
Gal4 in complex with the effector construct |
|
COMPLEX |
TRE-rtTR_UAS-Gal4 (effector) |
S36 |
False |
Gal4 and rtTR-KRAB in complex with the effector construct |
|
COMPLEX |
TRE-rtTR (effector) |
S42 |
False |
rtTR-KRAB in complex with the effector construct |
|
COMPLEX |
TRE-rtTR_UAS-GV16 (effector) |
S38 |
False |
Gal4-VP16 and rtTR-KRAB in complex with the effector construct |
|
COMPLEX |
UAS-Gal4 (amplifier) |
S31 |
False |
Gal4 in complex with the amplifier construct |
|
COMPLEX |
UAS-GV16 (amplifier) |
S33 |
False |
Gal4 in complex with the amplifier construct |
|
COMPLEX |
TRE-rtTR_UAS-Gal4 (amplifier) |
S35 |
False |
Gal4 and rtTR-KRAB in complex with the amplifier construct |
|
COMPLEX |
TRE-rtTR (amplifier) |
S41 |
False |
rtTR-KRAB in complex with the amplifier construct |
|
COMPLEX |
TRE-rtTR_UAS-GV16 (amplifier) |
S37 |
False |
rtTR-KRAB in complex with the amplifier construct |
|
SIMPLE_MOLECULE |
Dox |
S58 |
False |
Amino acids |
|
DEGRADED |
aa |
S30 |
False |
Amino acids |
|
DEGRADED |
lost |
S30 |
False |
Lost DNA constructs due to dilution through cell division |
Constants
In this table, you can find the values of the constants we used in the equations of the Exosome Production Model.
|
ID |
Value |
Units |
Comments |
|
kaGV16 |
1.66 * 10-6 |
N-1 * s-1 |
Gal4-VP16 - DNA on-rate binding constant |
|
kdGV16 |
0.01 |
s-1 |
Gal4-VP16 - DNA off-rate constant. |
|
kl |
0.00125 |
s-1 |
Leaky protein production rate |
|
kdeg |
2.79045 * 10-5 |
s-1 |
Average protein degradation rate |
|
kaNFkB |
1.66 * 10-6 |
s-1 |
NF-κB - DNA on-rate binding constant |
|
kdNFkB |
0.01 |
s-1 |
NF-κB - DNA off-rate constant |
|
ks |
0.25 |
s-1 |
Protein production rate |
|
kdil |
8.02254 * 10-6 |
s-1 |
Dilution rate |
|
kartTR |
1.66 * 10-6 |
s-1 |
Dilution rate |
|
kdox |
1.66 * 10-6 |
N-1 * s-1 |
Doxycycline – rtTR-KRAB association constant |
|
kdrtTR |
0.01 |
N-1 * s-1 |
rtTR-KRAB - DNA off-rate constant |
|
kdegluc |
9.62704 * 10-5 |
s-1 |
Firefly luciferase degradation rate |
|
kdeggal4 |
1.15525 * 10-4 |
s-1 |
Gal4 degradation rate |
|
kdeggv16 |
1.54033 * 10-4 |
s-1 |
Gal4-VP16 degradation rate |
The Genetic Circuit - Exosomes Model Hybrid Model
Since we were unable to conduct the necessary experiments in the wet lab, we decided to create a
model to simulate it from start to finish.
We simply replaced the effector of the Genetic Circuit with the Exosome Model.
This way, the miRNA-140 carrying exosomes are produced when the cell is in an inflammatory
environment,
such the one of Osteoarthritis, via the NF-kB transcription factor.
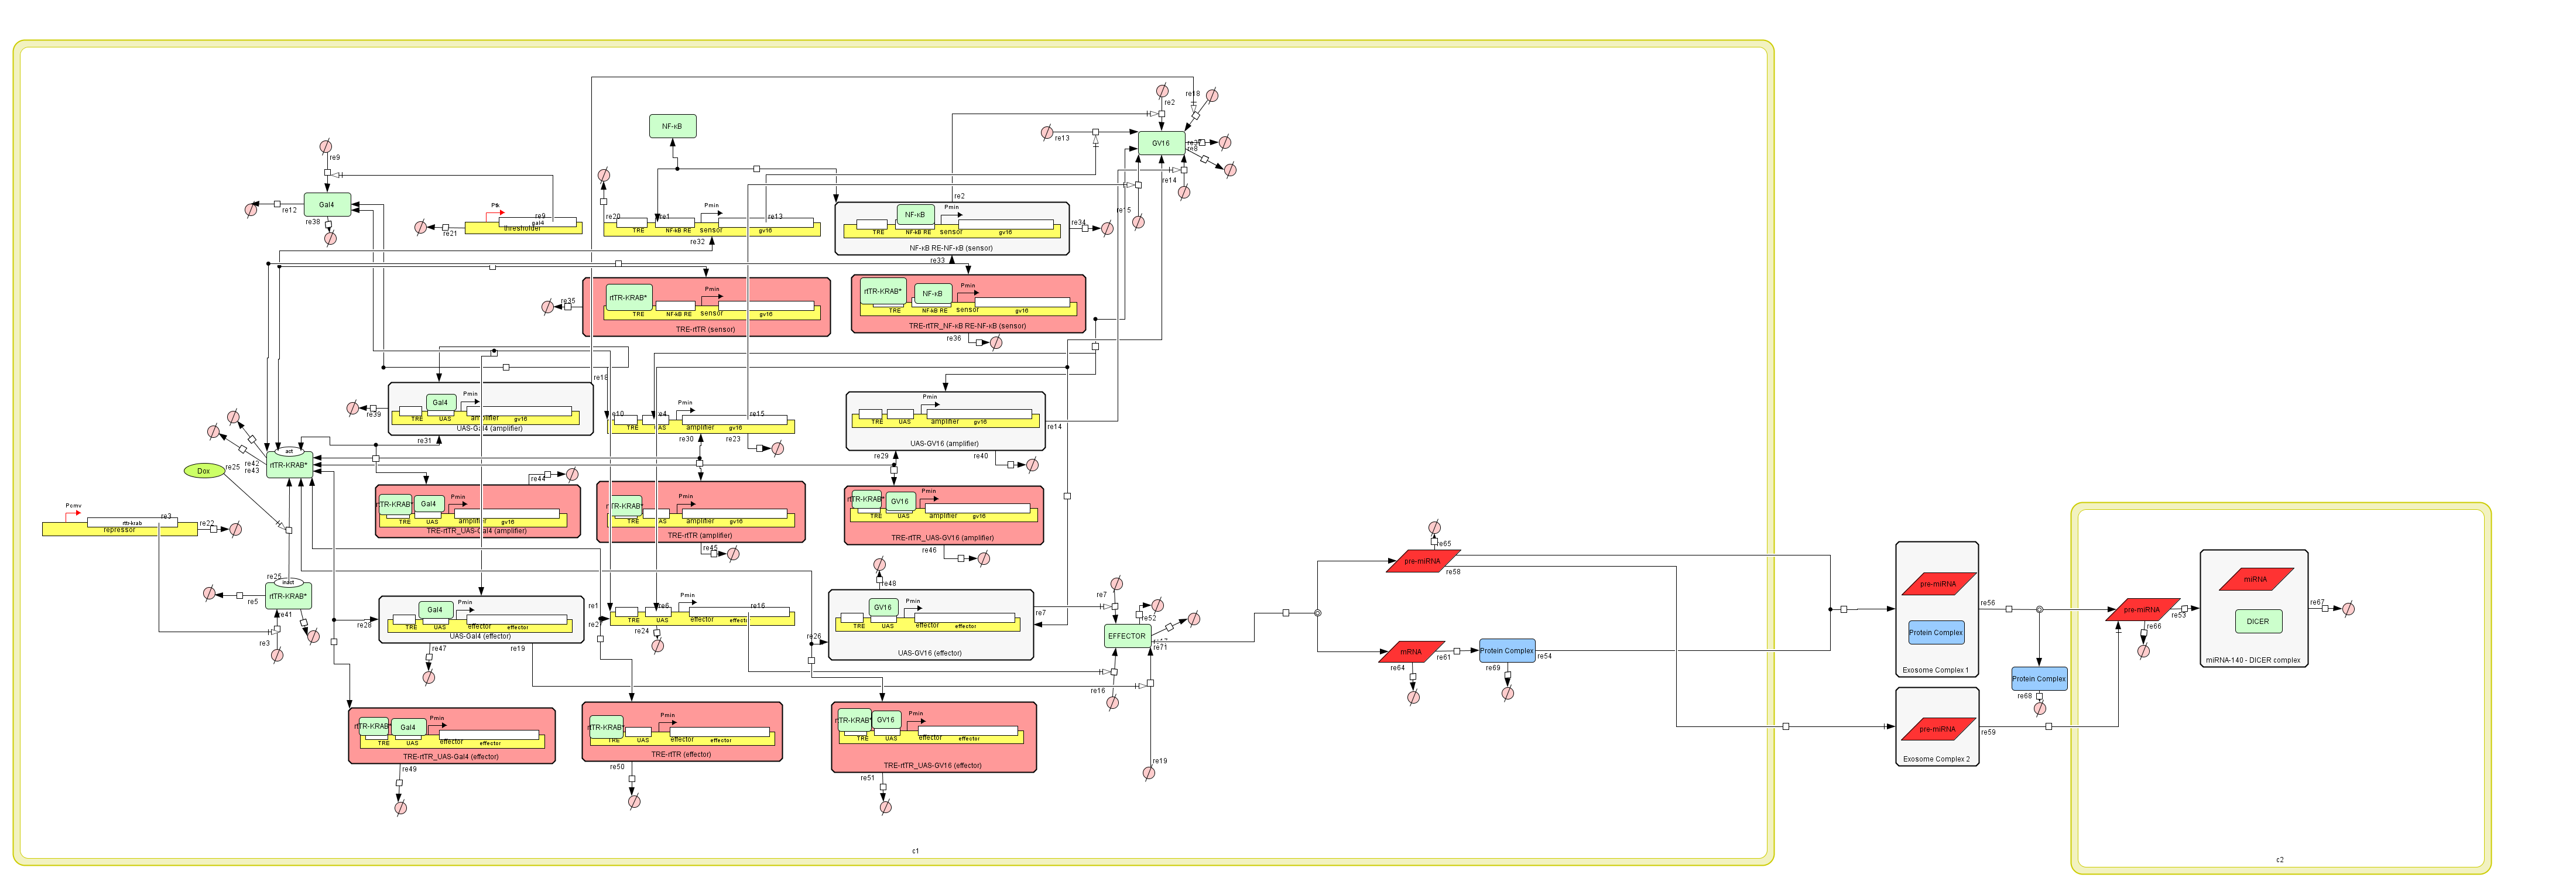
Figure 7:The Genetic Circuit – Exosome Production Hybrid Model in CellDesigner v4.4
Results
To compare our results, we are going to measure the effects of different values on the production of exosomes.
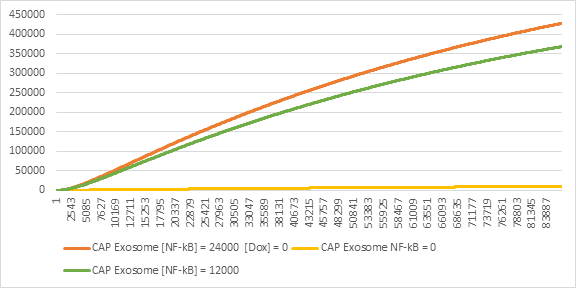
Figure 8:CAP Exosome production in different levels of NF-kB
Having the Genetic Circuit as part of the exosome production, gives it the flexibility of activating only when necessary and according to the levels of NF-kB in the cell (Figure 8). This means that the production of exosomes is dynamic and reactive to the level of the inflammation, instead of constant and pro-active.
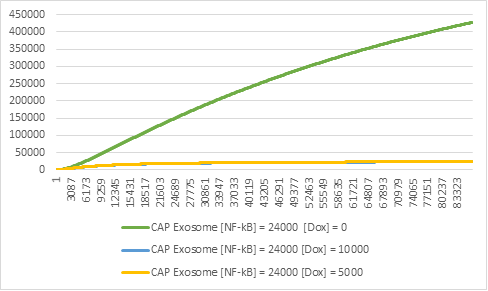
Figure 9:Exosome production in different levels of Doxycycline (Dox).
It is also important to note that the inclusion of the genetic circuit means that we can switch off the production of exosomes at any given moment (Figure 9), simply by inducing Doxycycline to the system. This is important, because it makes the system considerably more secure and allows for more complicated experiments to be conducted in the lab.
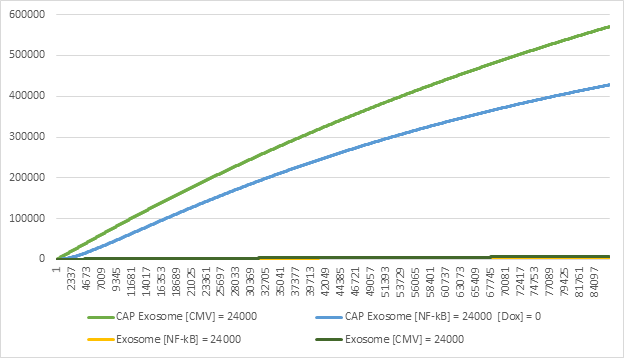
Figure 10:Exosome production in the Exosome Production Model & Genetic Circuit-Exosome Production Hybrid Model.
On the other side of the spectrum, we can see that the single plasmid transfected cell that utilizes
the CMV promoter for constant expression produces a
significant amount more exosomes (Figure 10). This is mostly since the genetic circuit is designed
to be expressed under certain conditions and have
control over the expression of the effector. It is also important to note that the difference
between the two models is not significant enough to mark
the genetic circuit as significant.
Although the genetic circuit model produces less CAP Exosomes, it provides safety measures and an
adaptable dynamic expression system, both of which are crucial elements to
designing a solution of Osteoarthritis with the aid of synthetic biology.
Tools
To create our models and calculate our results we used the software CellDesigner v4.4, as well as
MATLABs SimBiology Model
Builder and Model Analyzer, to validate our results. Both software's have a user interface that
enables the user to create visual
representation of the models (architecture of the model) and use equations to model their
interactions. Then you can use the built-in
simulator of CellDesigner v4.4 or MATLAB's SimBiology Model Analyzer to simulate the model.
More information on how these two pieces of software work, can be found in our educational page,
where we have fully documented their functionality by creating two tutorials for beginners.
References
- A. Smole, D. Lainšček, U. Bezeljak, S. Horvat, and R. Jerala, “A synthetic mammalian therapeutic gene circuit for sensing and suppressing inflammation,” Molecular Therapy, vol. 25, no. 1, pp. 102–119, 2017.


