Team:GreatBay SCIE/Optimum Aptamer Concentration


Introduction
The aim for this modeling is to utilize the least amount of aptamer to reach the highest binding affinity.
As a single liposome molecule can bind with numerous aptamers, we built up a mathematic model to estimate the best ratio between aptamer and liposome. Which we can use the least amount of aptamer to reach the highest binding affinity.
Theory
At the beginning, we had to obtain some significant parameters.
We first use pymol(A mathematical modeling software) to measure the length between the epitopes on Her2 and cell surface which we estimate it as 5nm.
Thus two adjust aptamer on the liposome surface linear distance should be 10nm, as you can see in our schematic diagram below. The HER2 receptor can move around randomly around its conjugate sequence with cell membrane to form a circle, the conjugate sequence which we labelled that sequence in our protein graph as blue. In this distance, no matter which part of the liposome collides with HER2, there is at least one aptamer can attach with HER2.
By using the data from liposome group, we know that the liposome we used have a radius of 158nm.
By using the law of cosine, we can obtain the intersection angle between two adjust aptamer
$$\frac{r^2+r^2-(2d)^2}{2r^2}=\cos\theta$$ $$\theta=\cos^{-1}(1-\frac{2d^2}{r^2})$$
Hence by using the definition of radian we can obtain the arc between two adjust aptamer
$$S=\theta\times r$$
As the arc distance compared to the liposome radius is extremely small, hence we can assume the surface of the sphere can be cut into numerous hexagon. The side of length of each hexagon is the length of the arc.

Assume that the hexagon separated on the sphere averagely. Then use the area of the sphere surface divided by the surface area of the equilateral triangle, we can obtain how many triangles are presented on its surface. Then times 3 as each triangle contain three vertex, then divided by 6 as each vertex act as center as well. Therefore we can obtain the amount of the optimum aptamer number. Hence the ratio can be estimated.
$$(\frac{4\pi r^2}{\frac{\sqrt{3}}{4}S^2}\times\frac{1}{2}):1=n:1$$
(n is the concentration of the aptamer, S is the arc of two adjacent aptamers. r is the radius of the liposome. d is the length between an aptamer and cell membrane)
After we conjugated the aptamer and the drug we then designed an experiment based on ELISA to ensure our model is valid.
By using the data from liposome group we can know that the radius of liposome r=158. Therefore we can calculate that the optimal ratio between this size of liposome and aptamer is about 1:3600
In order to make sure the aptamer can allow these number of binding, we generally calculate the maximum number of aptamer can bind with. Assume the surface of phospholipid is an ellipse, a represent the semi-major axis of the ellipse and b represent the semi-minor axis.
$$S_{area}=\pi\times \frac{a\times b}{4}$$
The ratio between phospholipid and PEG molecule is 10:1, so
$$N_{PEG}=\frac{4\pi r^2}{11S_{area}}$$
thus there is approximately 18060 individual PEG molecules on the surface of liposome
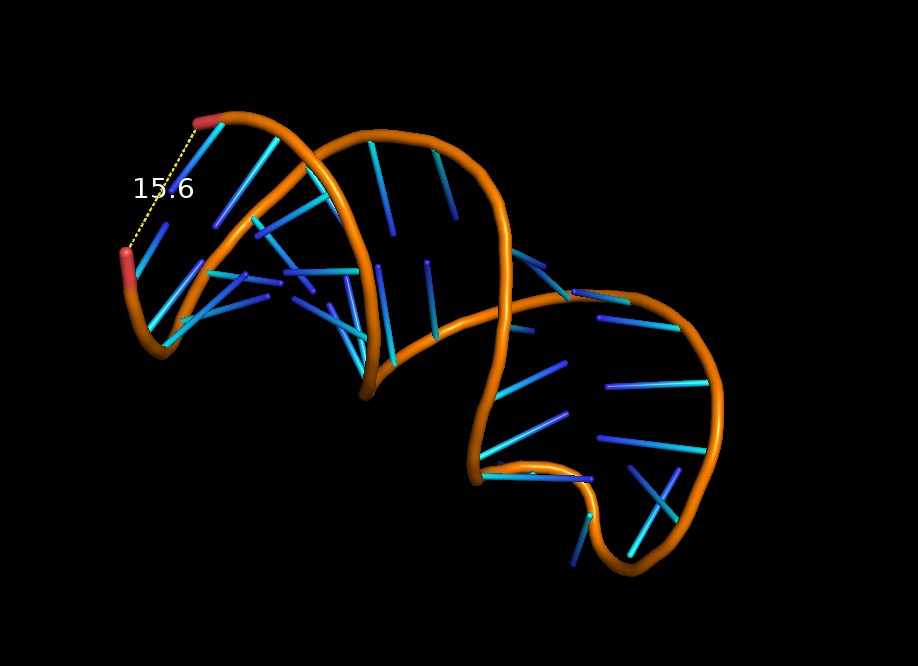
The width of aptamer is 15.6Å, due to the steric effect, the surface area can be calculated, assume each aptamer occupies a circle area. Using the sphere surface area divided by the occupied area by aptamer we can get the number of maximum aptamer of 10258
$$N_{APTAMER}=\frac{4\pi r^2}{4\pi 1.56^2}$$
As 10258<18060, so there is enough PEG molecules for aptamer to bind with. Since the liposome can approximately tolerance the maximum number of 10258 individual aptamers. Hence we can conclude that the liposome can tolerate the aptamers of 3600, which is much smaller than the theoretical maximum.
Experiment
The result of the experiment is shown on the graph
We conduct the experiment by modify the protocol of ELISA, which we change the independent variable from concentration gradient to time gradient and get the result. You can click hereto obtain more information on our protocol page.
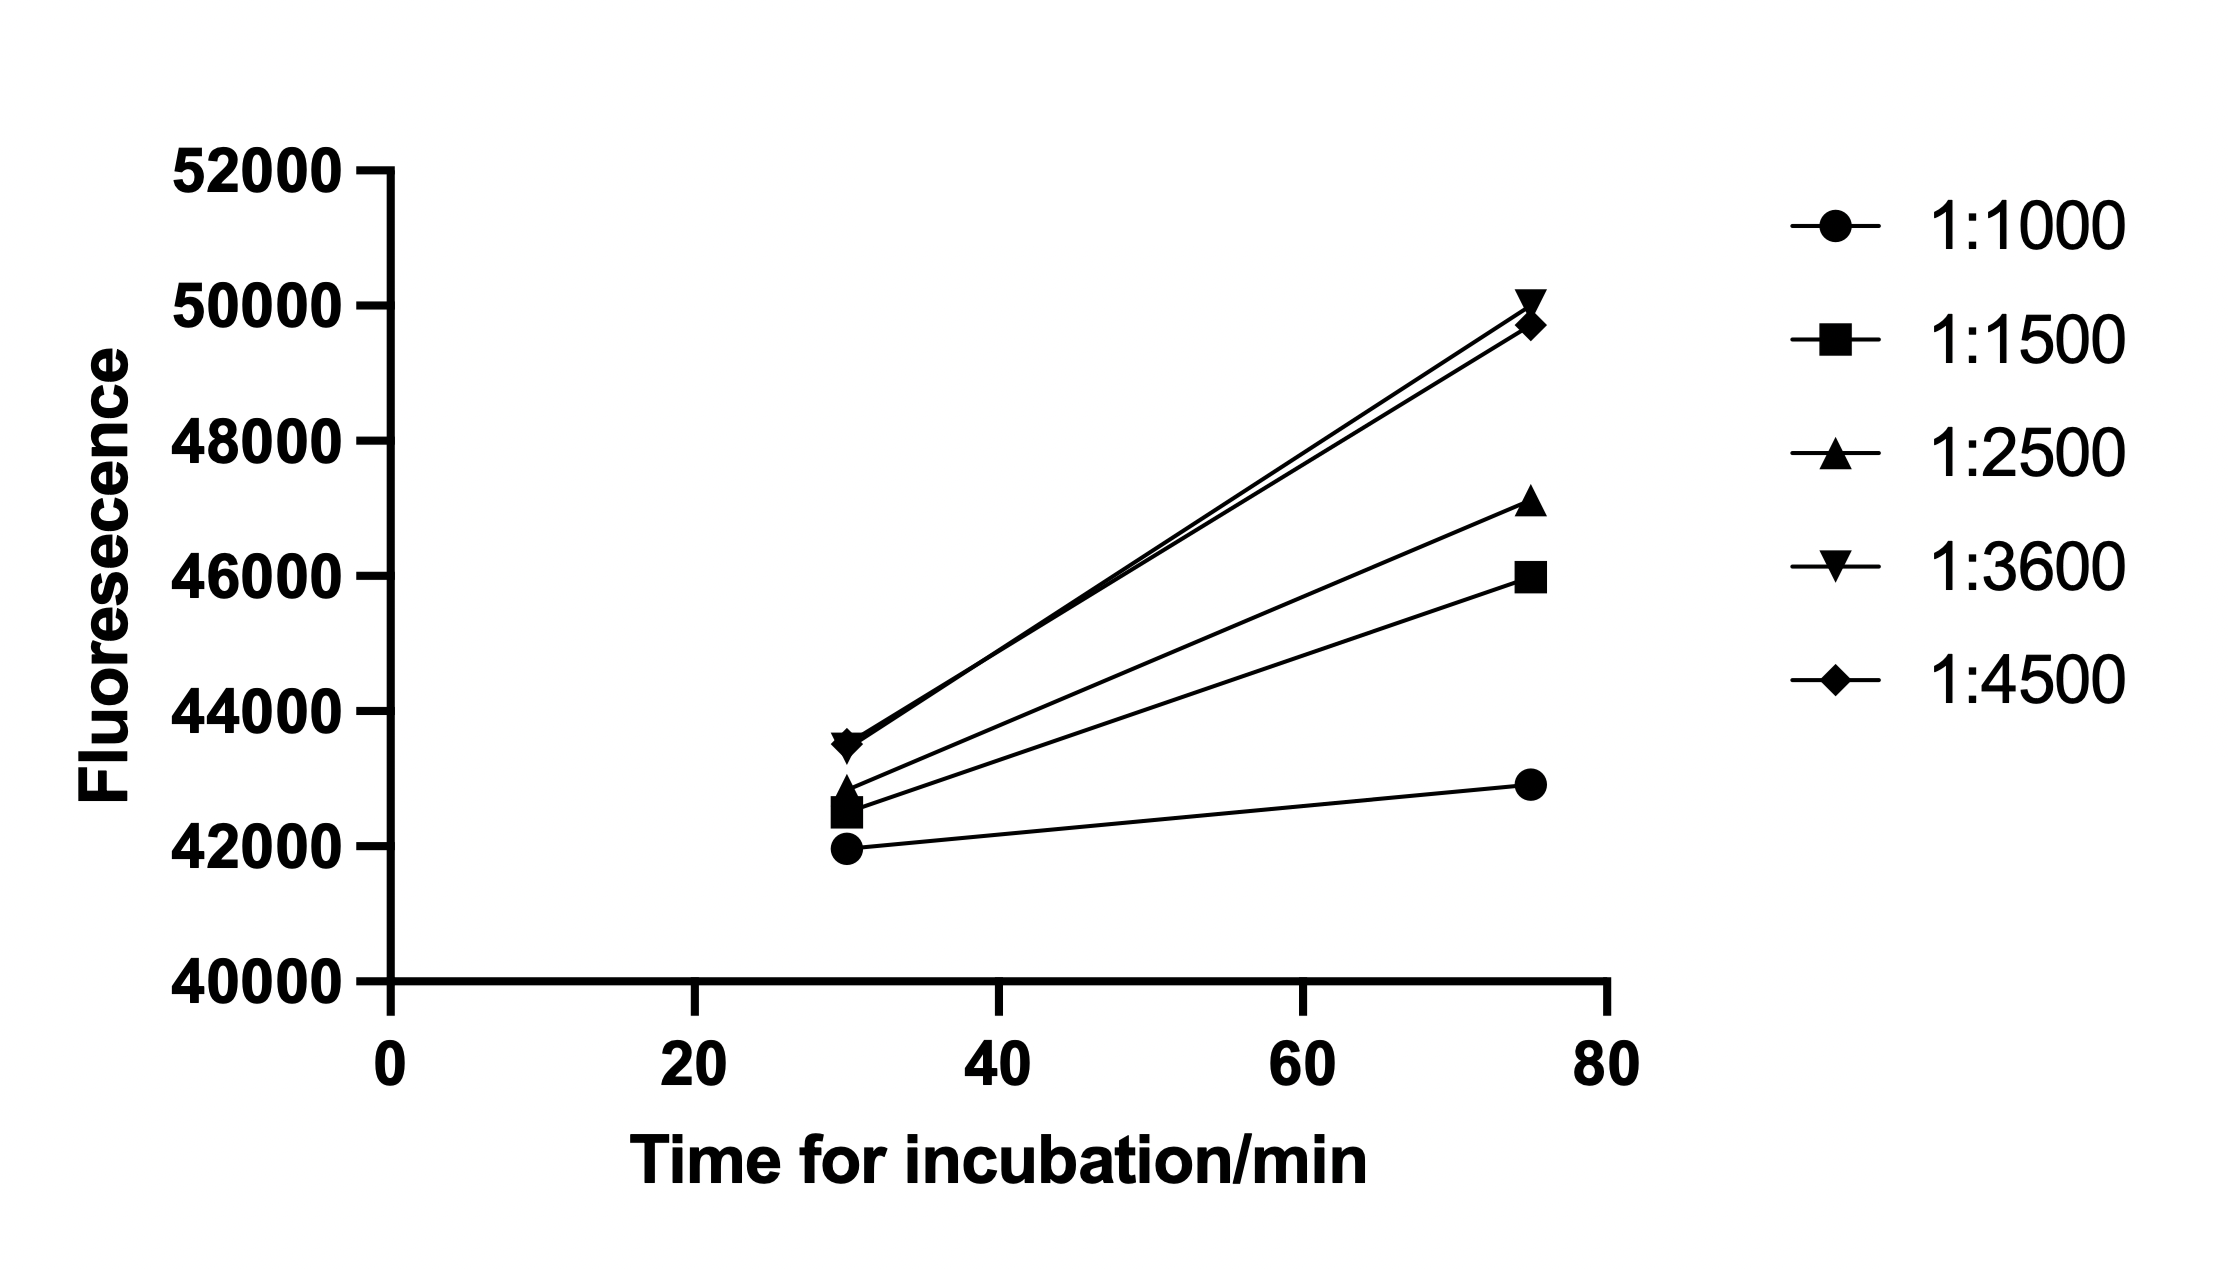
As you can see in our graph, if only consider the incubation time at 30 minutes and 75 minutes(which is 15 minutes longer than the required incubation time), the fluorescence is extremely close between the ratio of 1:3600 and 1:4500, therefore the rate of binding is almost the same. Which means by adding more aptamer on the liposome can't get a high binding affinity if the ratio is above 1:3600. Meanwhile, the ratio between 1: 1500 and 1:2500 shows a significant lower fluorescence which is a lower binding rate. This can support our modeling is correct.
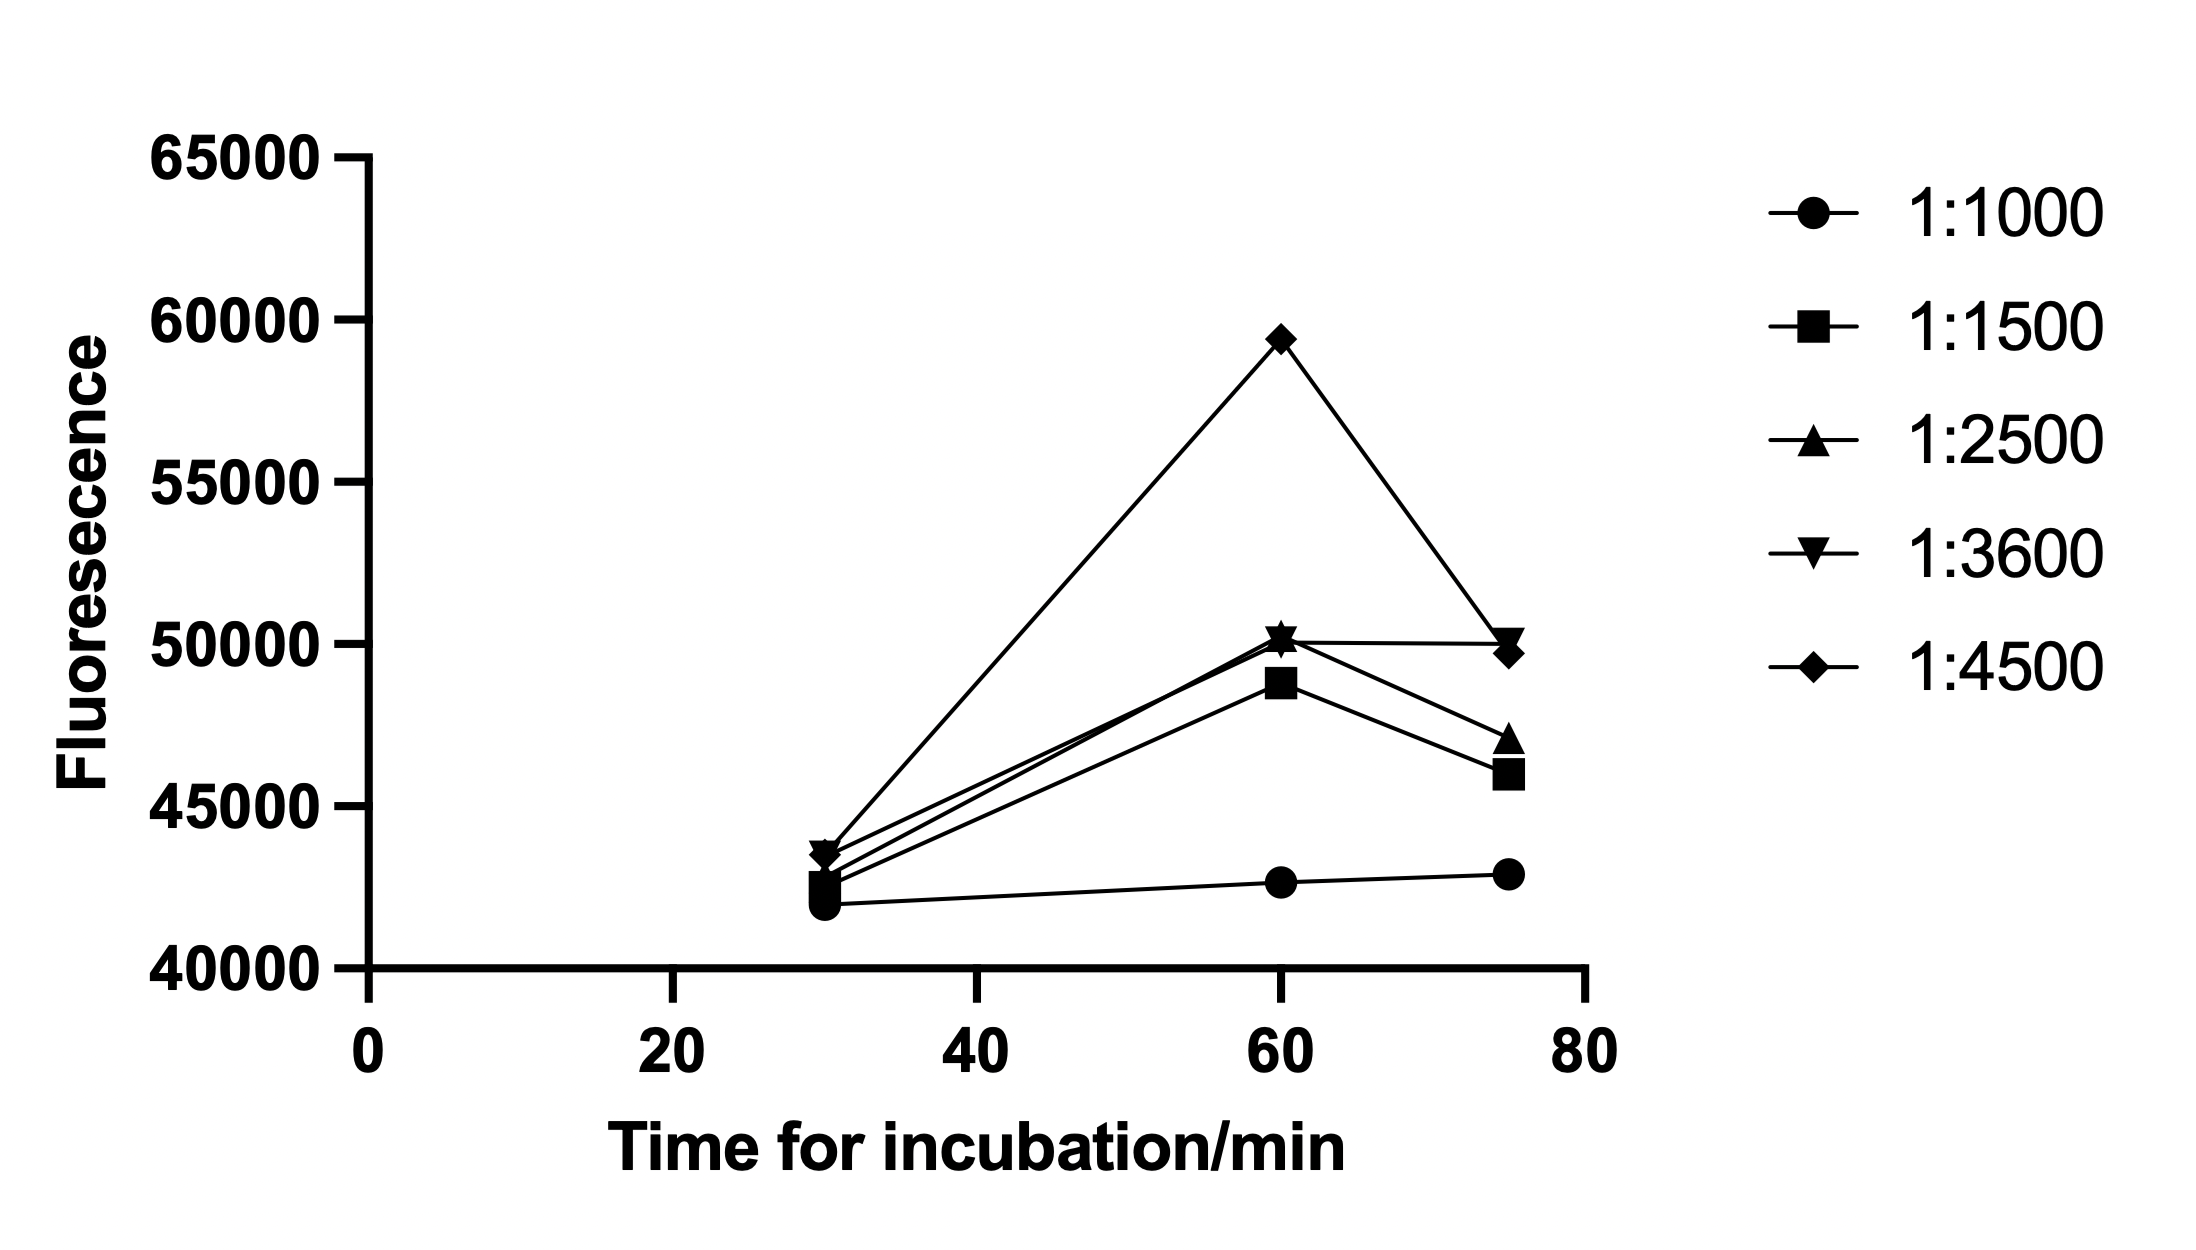
However, if we check the graph include the fluorescence at 60 minutes, there is a large increase in fluorescence, that can be caused by our manipulate error, as we placed the conjugated liposome-aptamer under room temperature for a long period of approximately 60 minutes and the liposome may decomposed before we add them for incubate, hence the concentration of aptamer is different in each group so the data in 60 minutes would be meaningless.
Conclusion
From the experiment we can conclude that the overall idea of this modeling has no error, however, in the actual manipulation, the ratio should be more lower because the aptamer has the ability of non-specific bind hence a lower amount of aptamer is required. But, we can't afford to take another experiment to test and verify our assumption due to the financing limit.
Besides, we can also obtain the binding constant of our modeling by using the system carried by Prism which Kd=
click here to obtain more information on dissociation constant.
Reference
- Cryo-EM structure of Her2 extracellular domain-Trastuzumab Fab-Pertuzumab Fab complex https://www.rcsb.org/structure/6OGE
- 1,2-Distearoyl-sn-glycero-3-phosphocholine https://pubchem.ncbi.nlm.nih.gov/compound/94190