Difference between revisions of "Team:GreatBay SCIE/Dissociation constant"
| Line 42: | Line 42: | ||
<p>As we know the aptamer has the ability to bind with non-specific regions.</p> | <p>As we know the aptamer has the ability to bind with non-specific regions.</p> | ||
<center> | <center> | ||
| − | <img | + | <img src="https://static.igem.org/mediawiki/2021/5/52/T--GreatBay_SCIE--Model_OApt_Kd.png" width="30%; height: auto;"> |
| − | <img | + | <img src="https://static.igem.org/mediawiki/2021/2/2c/T--GreatBay_SCIE--Model_Kd_Graph.png" width="30%; height: auto;"> |
| − | <img | + | <img src="https://static.igem.org/mediawiki/2021/3/3e/T--GreatBay_SCIE--Model_Kd_Graphs.png" width="30%; height: auto;"> |
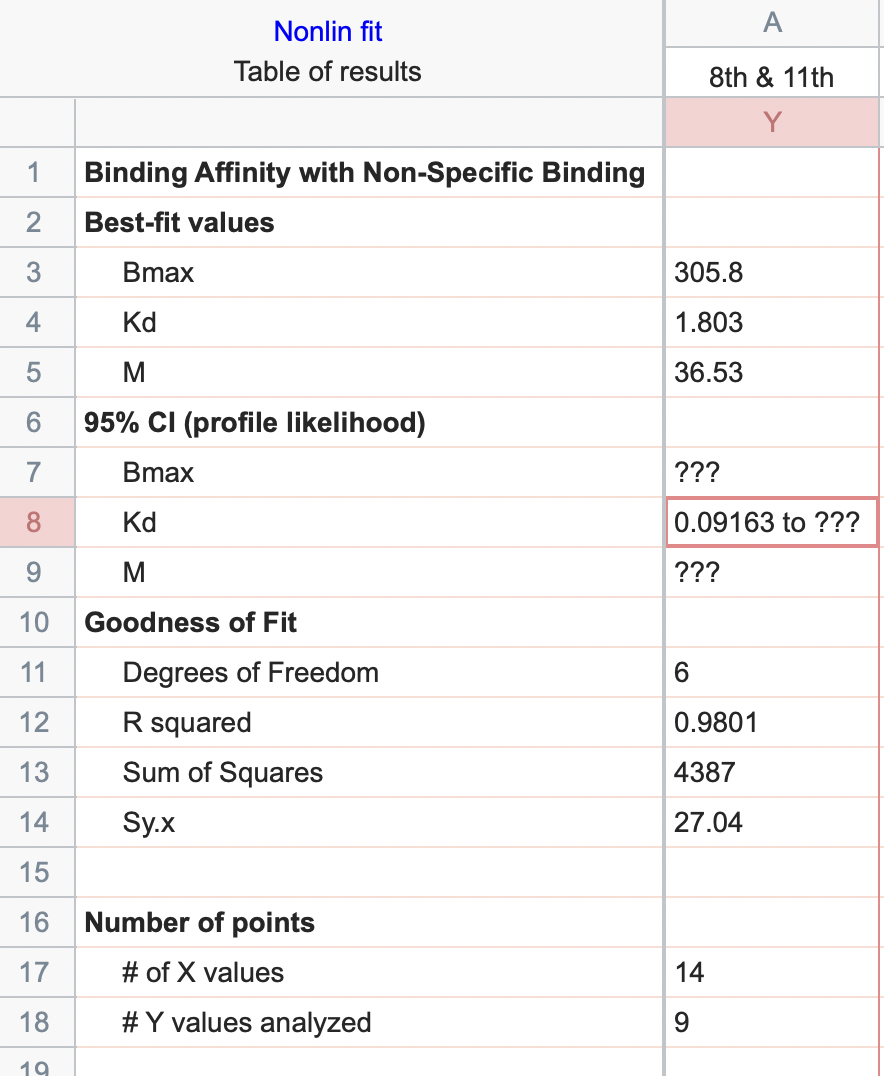
<div class="image_text"> <strong>Figure 1 (Left). The Kd of HR2 aptamer</Strong></div> | <div class="image_text"> <strong>Figure 1 (Left). The Kd of HR2 aptamer</Strong></div> | ||
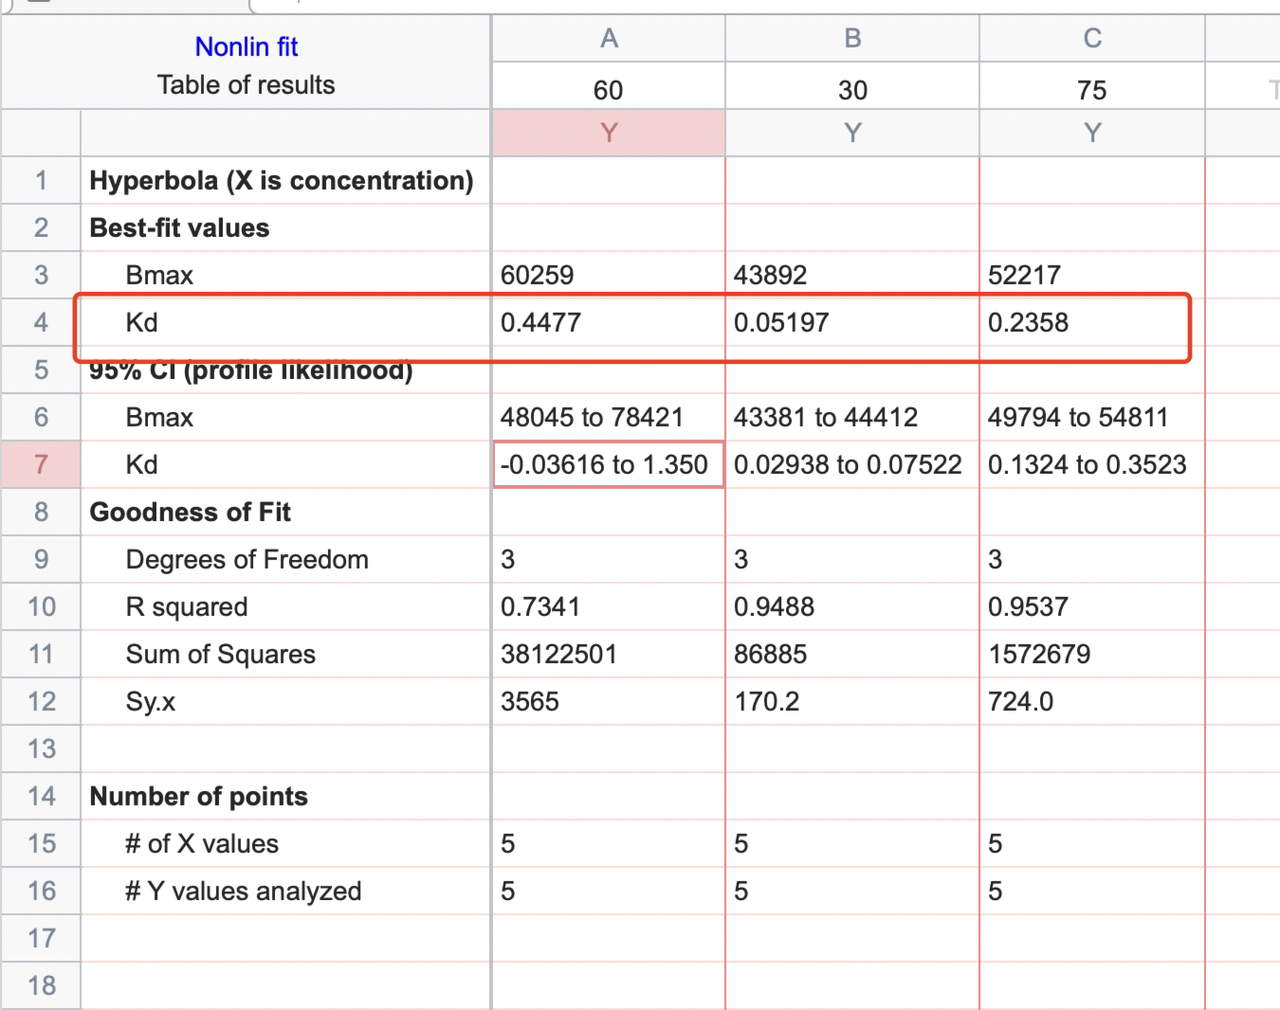
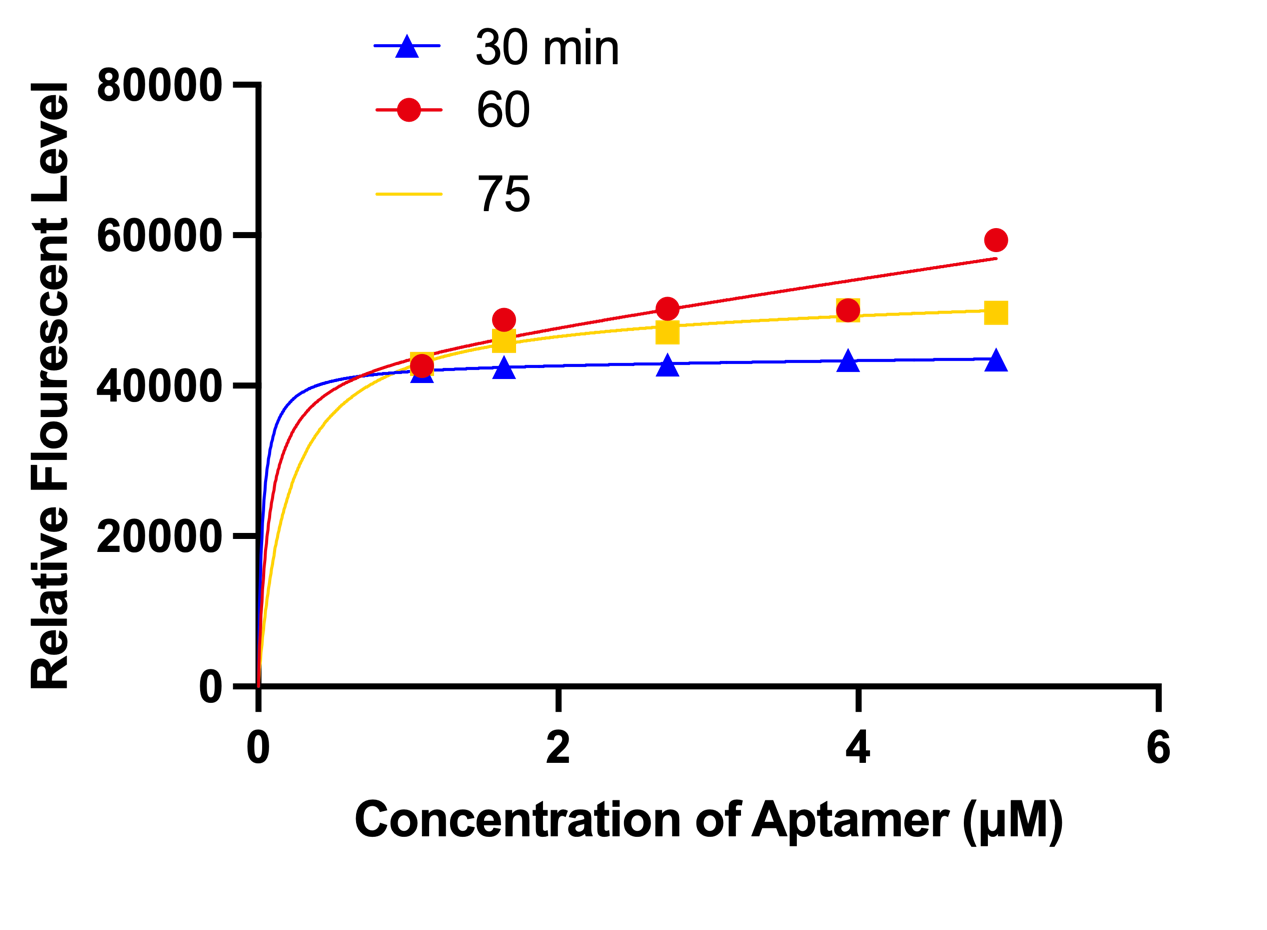
<div class="image_text"> <strong>Figure 2 (Mid). The Kd of incubation time at 30 mins, 60mins, 75mins</Strong></div> | <div class="image_text"> <strong>Figure 2 (Mid). The Kd of incubation time at 30 mins, 60mins, 75mins</Strong></div> | ||
Revision as of 23:43, 21 October 2021
At first we planned to calculate Kd which can be derived from Hill equation
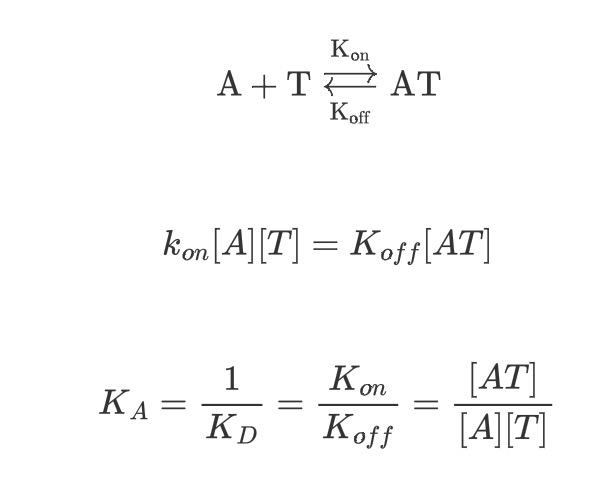
But soon we found that it is impossible to calculate in this way as the seller of the ELISA kit can't tell us the concentration of the aptamer so we had to find another way.
This equation is derived from Michaelis–Menten kinetics
$$V=V_{max}\frac{[P]}{K_M\times{[P]}}$$
With slightly modification, we can obtain the following equation
$$Y=\frac{B_{max}\times X}{K_d+X}+M\times X$$
Where Bmax is the maximum specific binding in the same units as Y.
Kd is the equilibrium dissociation constant, in the same units as X. It is the radio-ligand concentration needed to achieve a half-maximum binding at equilibrium.
MX is the slope of nonspecific binding in Y units divided by X units.
By plotting the data into the prism and doing the following steps, the system can calculate automatically
Using the data from the Aptamer experiments we can evaluate that the Kd of our aptamer is 1.806 μM
As we know the aptamer has the ability to bind with non-specific regions.
Reference
Equation: One site -- Specific binding https://www.graphpad.com/guides/prism/latest/curve-fitting/reg_one_site_specific.htm