Team:ZJU-China/Model
Some ordinary differential equation models were used to verify the rationality of our design, and a conceptual model was proposed to guide the analysis of adenovirus killing effect on cancer cells.
Basic ideas
Introduction
Before we get into our model, I'd like to start with some basic modules that make up our projects.
Michaelis-menten equation
Michaelis-menten equation is used to describe the kinetics of an enzymatic reaction. It can derive reaction speed from substrate concentration $[s]$, maximum reaction rate $v_{max}$, Michaelis constant $k_m$. The equation is shown in the following. Michaelis constant equals the concentration of the substrate at half the maximum reaction rate.
\begin{equation} v = \frac{v_{max} [S]}{K_m + [S]} \label{eq: M eq} \end{equation}
Miley's equation can help us model enzymatic reactions. Another important parameter is $k_{cat}$, which is also called turnover number. $k_{cat} = \frac{V_{max}}{[E]}$ where $[E]$ is the the concentration of the enzyme.
Half-life and decomposition rate
In many cases we need to measure the rate of decay. The equation used to describe decay is shown in the following. The solution to the equation is $N = N_0 \cdot e^{-rt}$ where $N_0$ is the initial population and $r$ is the decomposition rate. In most cases, we'll also get a half-life $t_{half}$ to characterize the rate of decay. Compared to the solution we can get $r = \ln{(2)}/t_{half}$.
\begin{equation} \frac{\mathrm{d}N}{\mathrm{d}t} = -rN \label{eq: decomposition} \end{equation}
RNAi
Introduction
RNAi(RNA interference) refers to the highly specific degradation of homologous mRNA induced by double-stranded RNA(dsRNA) in the process of evolution. Here we build a new dynamic equation to describe this process.
In our design, we selected miRNA with significantly different expression levels in normal cells and cancer cells, so as to achieve the purpose of making adenovirus behave differently in different cells. Our model can verify the feasibility of the idea and estimate the results.
Description
Let's start with the RNAi pathway, cf. Fig. 1.
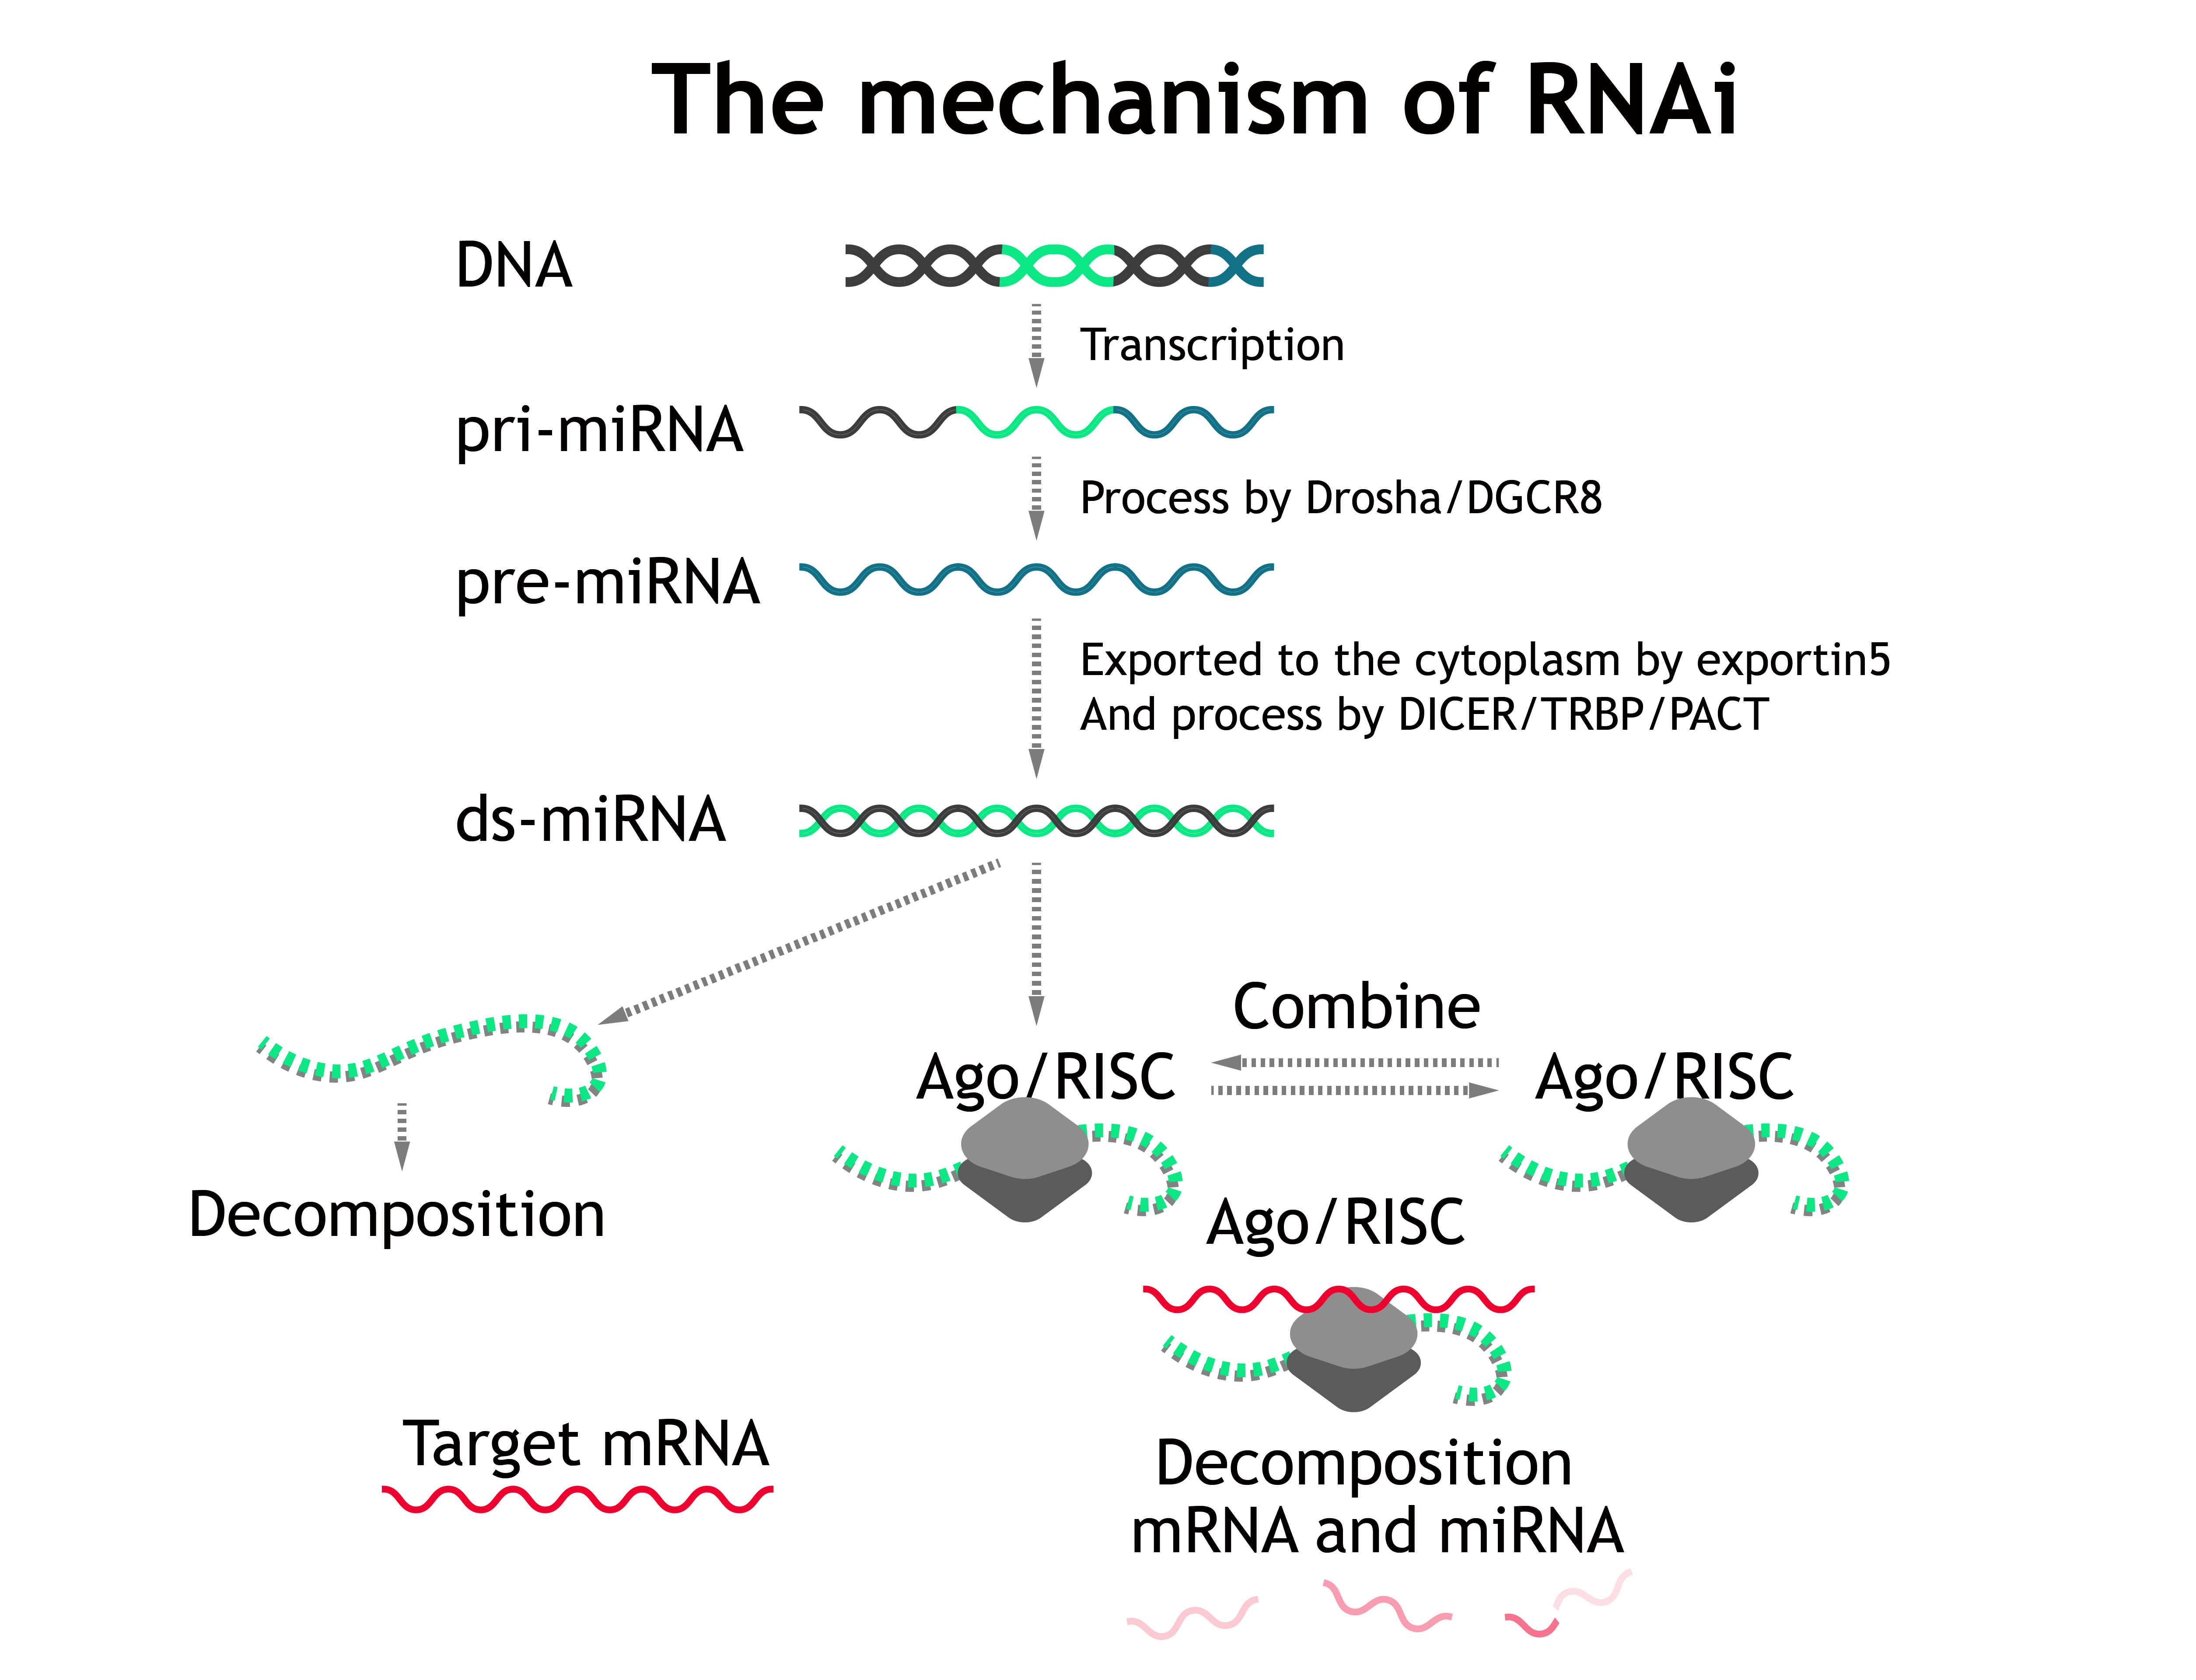
Most miRNAs are transcribed as primary miRNAs (pri-miRNAs), which are cleaved to single hairpins termed precursor miRNAs (pre-miRNAs) and subsequently to shorter, mature miRNA duplexes. Of the mature miRNA duplex, one strand (miR) is loaded onto (bound by) Ago and stabilized, whereas the other strand (miR*) is expelled and degraded[1]. Then the complex will explore and scan for targeted mRNA within cells and then degrades them or form p-body to invalidate mRNA.
First, we use a constant rate($\alpha_{pri-miRNA}$) to describe transcription of pri-miRNA. And pri-miRNA can be be processed by enzymes Drosha/DGCR8 into pre-miRNA. The catalytic reactions of enzymes are described by the Michaelis equation. Term $d$ represents decomposition and the same for the following.
$$\frac{\mathrm{d} pri\_miRNA }{\mathrm{d}t} = \alpha_{pri\_miRNA} \cdot gene - \frac{V_{max,Drosha\&DGCR8} pri\_miRNA}{K_{m,Drosha\&DGCR8} + pri\_miRNA} - d_{pri\_miRNA} \cdot pri\_miRNA $$
The pre-miRNA comes from pri-miRNA and will be exported to the cytoplasm by \textbf{exportin5}. The export rate is described by a const $v_{exp}$ multiply by the concentration of pre-miRNA
$$\frac{\mathrm{d} pre\_miRNA }{\mathrm{d}t} = \frac{V_{max} \cdot pri\_miRNA}{K_{m,RNApoly} + pri\_miRNA} - v_{exp} \cdot pre\_miRNA - d_{pre\_miRNA} \cdot pre\_miRNA$$
The pre-miRNA in cytoplasm comes from pre-miRNA in nucleus and will be procesed by \textbf{DICER/TRBP/PACT} into ds-miRNA.
$$\frac{\mathrm{d} pre\_miRNA_{out} }{\mathrm{d}t} = v_{exp} \cdot pre\_miRNA - \frac{V_{max,DICER} \cdot pre\_miRNA_{out}}{K_{m,DICER} + pre\_miRNA_{out}} - d_{pre\_miRNA_{out}} \cdot pre\_miRNA_{out} \\$$
The ds-miRNA comes from pre-miRNA and can combine Ago\&RISC complex. We use association rate and disassociation rate ($v_{as}$ and $v_{dis}$ respectively) to describe the chemical reaction.
\begin{equation*} \begin{aligned} \frac{\mathrm{d} ds\_miRNA }{\mathrm{d}t} = & \frac{V_{max,DICER} \cdot pre\_miRNA_{out}}{K_{m,DICER} + pre\_miRNA_{out} } - d_{ds\_miRNA} \cdot ds\_miRNA \\ & - v_{as,RISC} \cdot ds\_miRNA \cdot RISC + v_{dis,RISC} \cdot Ago\&RISC\&miRNA \end{aligned} \end{equation*}
We claim that the total avaliable amount of RISC is a constant (including Ago\&RISC, Ago\&RISC combining miRNA, Ago\&RISC combining miRNA and target mRNA).These three complex are interchangeable and Ago\&RISC combining miRNA and target mRNA can be decomposed in order to downregulate target mRNA.
\begin{equation*} \begin{aligned} \frac{\mathrm{d}mRNA}{\mathrm{d}t} = & \alpha_{mRNA} \cdot gene \\ & - v_{as, RIM} \cdot RISC\&miRNA \cdot mRNA + v_{dis, RIM} \cdot RISC\&miRNA\&mRNA \\ & - d_{mRNA} \cdot mRNA \\ \end{aligned} \end{equation*}
\begin{equation*} \begin{aligned} \frac{\mathrm{d} RISC\&miRNA }{\mathrm{d}t} = & v_{as,RISC\&miRNA} \cdot ds\_miRNA \cdot RISC - v_{dis,RISC\&miRNA} \cdot Ago\&RISC\&miRNA \\ & - v_{as, RIM} \cdot RISC\&miRNA \cdot mRNA + v_{dis, RIM} \cdot RISC\&miRNA\&mRNA \\ \end{aligned} \end{equation*}
\begin{equation*} \begin{aligned} \frac{\mathrm{d} RISC\&miRNA\&mRNA }{\mathrm{d}t} = & v_{as, RIM} \cdot RISC\&miRNA \cdot mRNA - v_{dis, RIM} \cdot RISC\&miRNA\&mRNA \\ & - d_{RIM} \cdot RISC\&miRNA\&mRNA \end{aligned} \end{equation*}
\begin{equation*} \begin{aligned} RISC + RISC\&miRNA + RISC\&miRNA\&mRNA = constant \end{aligned} \end{equation*}
The above parameters can be found in subsection Parameters
Results
We determine whether RNAi plays a role by the concentration of target mRNA. The solution to the ODEs is shown below, cf. Fig. 2.
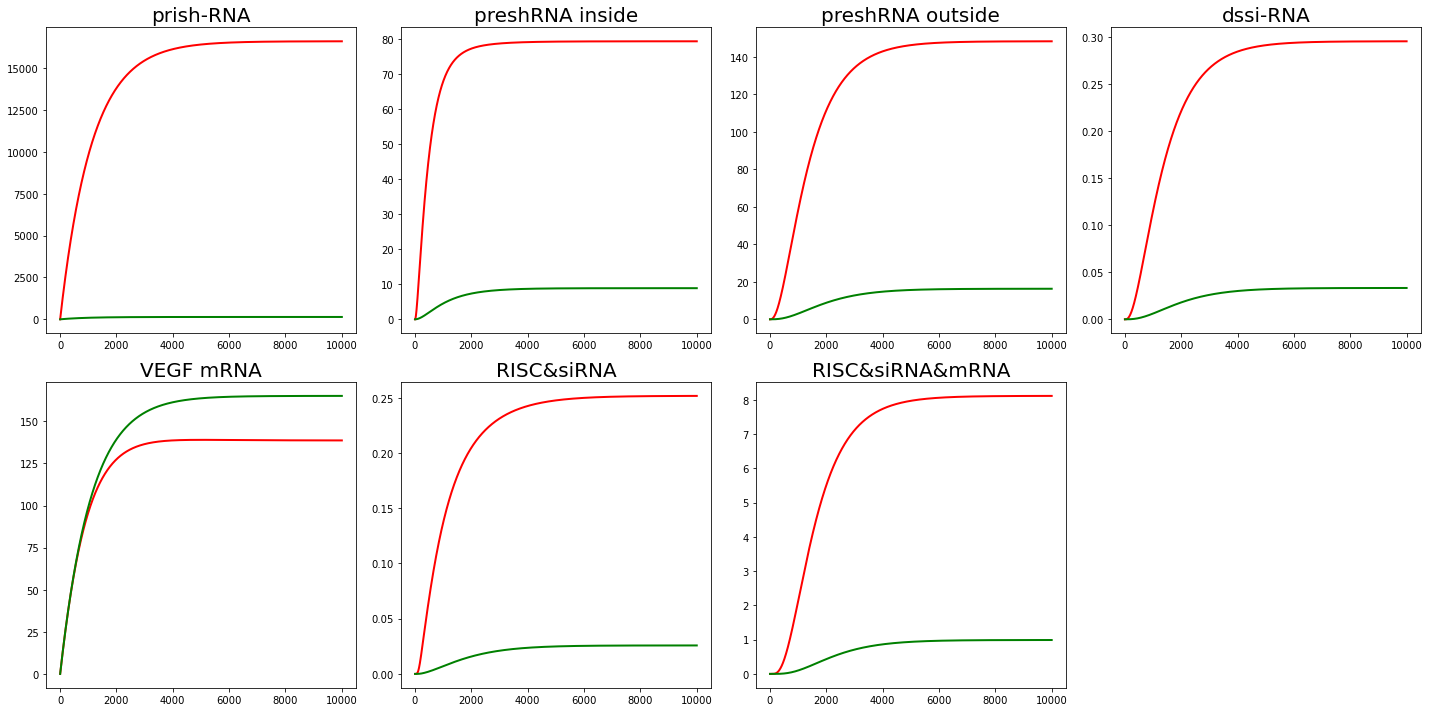
From Fig. 2, we find that in our interpretation, RNAi does reduce the mRNA content of the target protein.
Parameters
Here we are going to introduce the basis of our choice of parameters.
First we need to consider the copies of gene. Due to the experimental environment and many other factors, it is hard for us to quantitative analysis. As we are doing qualitative analysis, we just need to provide a baseline for the number of copies of genes. Assume the copies of gene is $100$. We also estimate the constant of RISC content to be $100$.
We use a constant rate of transcription to estimate the process of transcription, representing the number of RNA generated per second per copy of gene. We use the transcription rate for RNA polyII.($1.5\times 10^{-3} s^{-1}$)[2]
The number of proteins produced per unit time, per RNA for our genes is estimated as $0.000162$[3].
The kinetic constant of Miltonian equation is estimated from [4]. $k_m \approx 1.2 \mu M$, $k_{cat} \approx 7.2 min^{-1}$, $c$ is from $0.35$ to $0.75$ $nM$. $v_{max} \approx k_{cat} \cdot \bar{c}$
The transport rate can be estimated as $2 \times 10^{-3}$ from [5].
Considering decomposition rate. The decomposition rate can be derived from half-life, and the decomposition rate for mRNA is estimated as $3.3 \times 10^{-3}$[6]. The decomposition for protein is estimated as $5.22 \times 10^{-3}$[7]. The decomposition of siRNA is estimated as $8.887 \times 10^{-4}$[8]. The decomposition rate of RISC\&mRNA\&miRNA complex is also estimated as the decomposition rate for mRNA.
Because the RISC binding process itself is still being studied, the relevant parameters $v_{as}$ and $v_{dis}$ are estimated by ourselves. Here we assume $v_{as} = v_{dis} = 1 \times 10^{-3}$. Later we will do sensitive analysis on our own estimation of the parameters.
Sensitivity Analysis
There are many paramaters are estimated by ourselves. Here we are going to do sensitivity analysis on them to make sure that the model is stable for these parameters.
First for $v_{as}$ and $v_{dis}$.The ratio $\frac{v_{as}}{v_{diss}}$ actually represents the equilibrium constant of chemical reaction $K$. In our previous hypothesis, $K$ was equal to $1$. Here we change the value of $K$($v_{as}$ and $v_{dis}$) and see how it affect our results.
Set $K=10$($v_{as} = 1\times 10^{-2}$, $v_{dis} = 1 \times 10^{-3}$) and $K=0.1$($v_{as} = 1\times 10^{-4}$, $v_{dis} = 1 \times 10^{-3}$). The results are shown in Fig. 3,4.
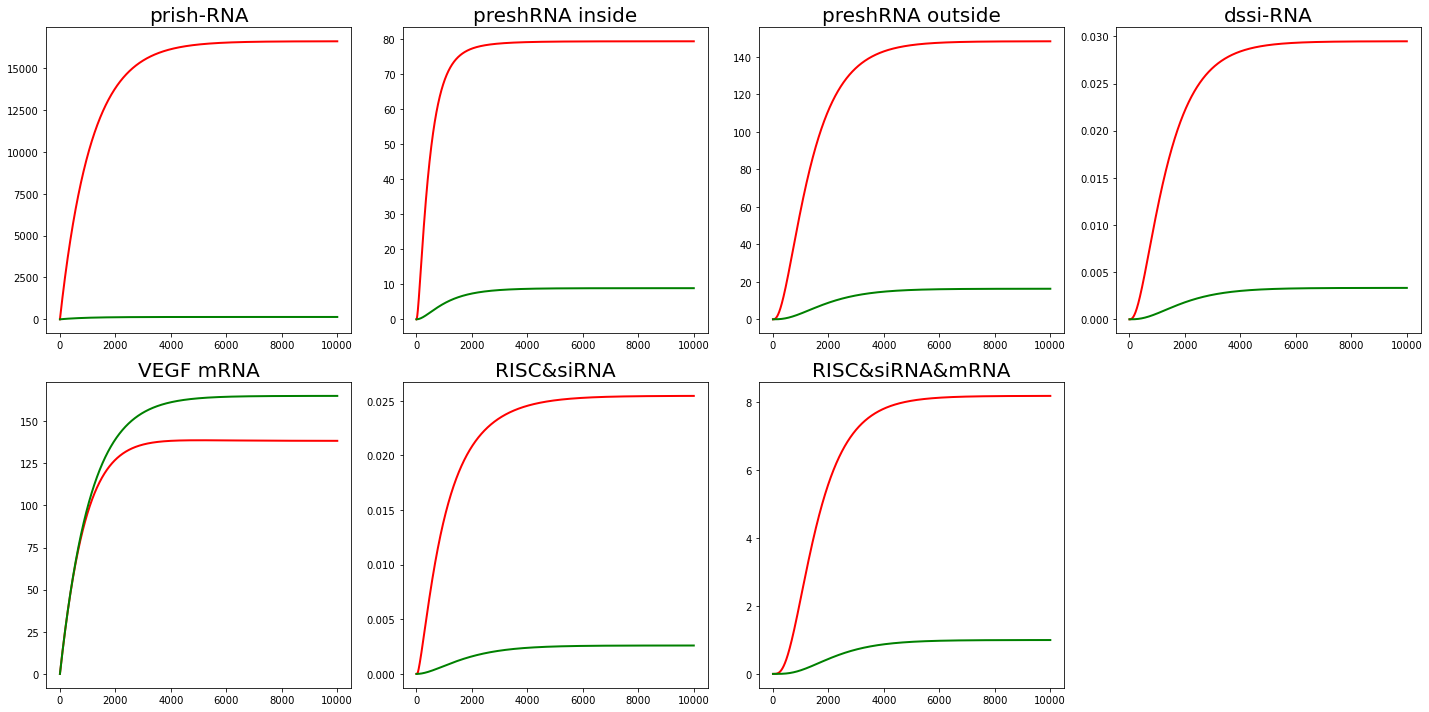
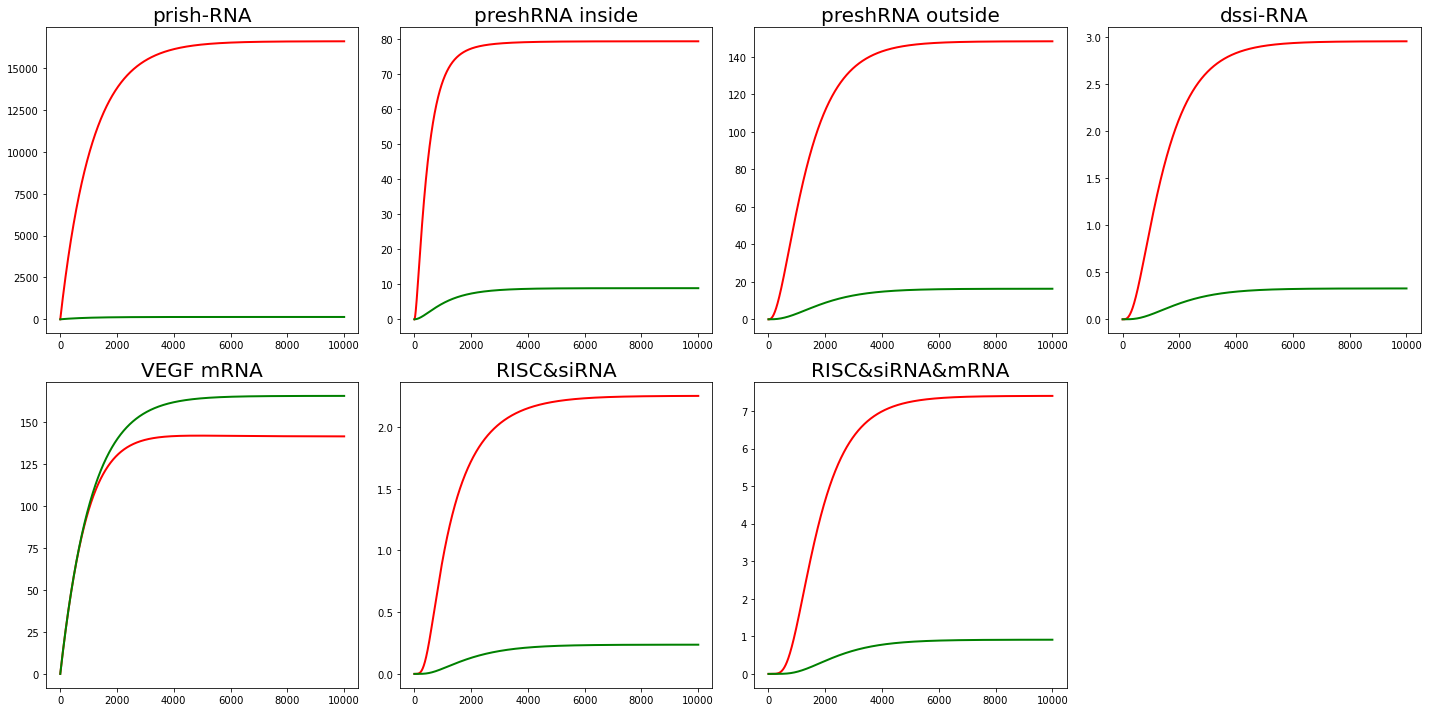
From the results of sensitivity analysis, $v_{as}$ and $v_{dis}$ can affect the amount of intermediate product accumulation like $RISC\&siRNA\&mRNA$. But tt doesn't have much effect on mRNA content, which is our main concern.
Specific Proliferation
Introduction
In this part of the design, we want the adenovirus to multiply only in cancer cells. A more complete introduction can be found in Section Design. Here we want to verify the feasibility of the Design part from the perspective of dynamics.
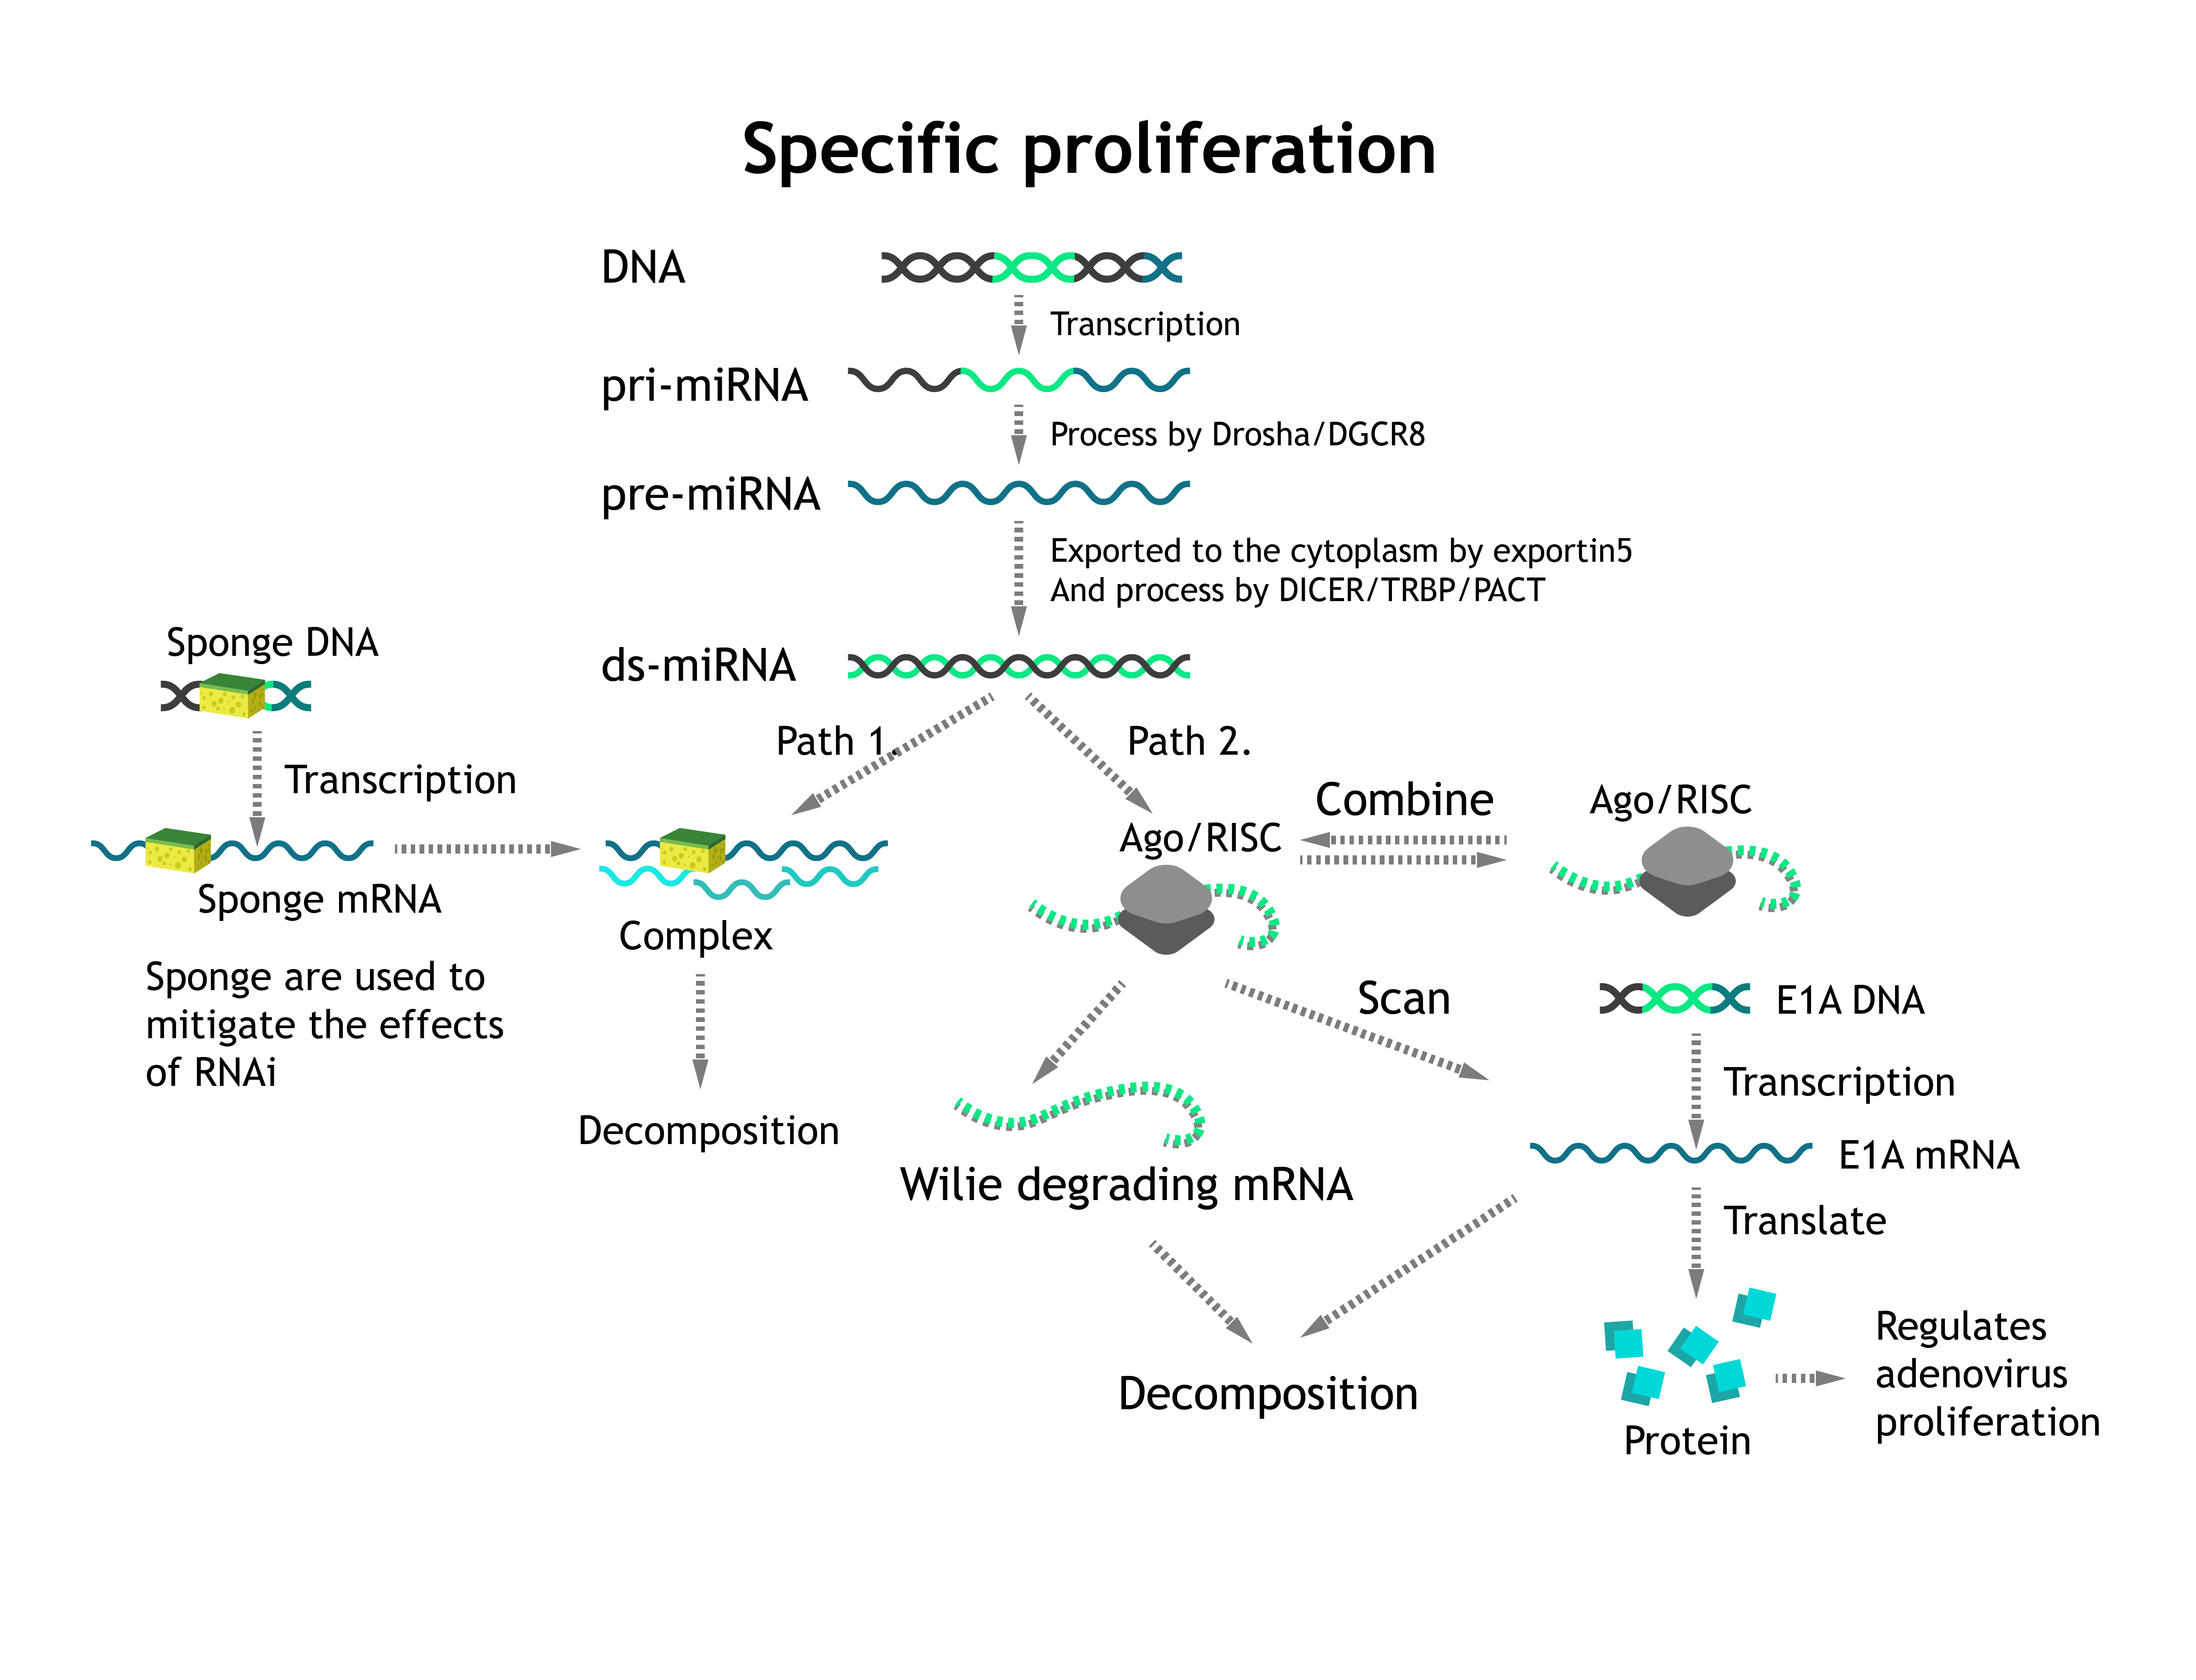
According to Fig. 5. In normal cells, miRNA is highly expressed, and the weakening effect of sponges is limited. As a result, miRNA will eventually combine with E1A mRNA in large quantities to achieve an inhibitory effect. In cancer cells, miRNA is low expressed, and he restriction on E1A mRNA has little effect and is weakened by sponge mRNA. So our virus can only multiply in cancer cells and not in normal cells.
Description
Based on the equation in RNAi. We need to add new presentations of sponge. The ds-miRNA can be combined with sponge mRNA which reduces miRNA's ability to decompose target mRNA via RISC. But in normal cells the miRNA is highly expressed. So the effect of sponges is negligible. While in cancer cells, this weakens RNAi, achieving the purpose of virus specific proliferation.
The combination of sponge and ds-miRNA is represented by $v_{as, miRNA\&sponge}$ and $v_{dis, miRNA\&sponge}$. The whole ODEs can be viewd below. And the parameters are introduced in subsection \textbf{Parameters} Except for the RNAi part, the ODEs for sponge is listed as following:
\begin{equation*} \left\{ \begin{array}{rcl} \frac{\mathrm{d}Sponge}{\mathrm{d}t} & = & \alpha_{DNA} \cdot gene - d_{Sponge} \cdot Sponge\\ & & - v_{as,Sponge\&miRNA} \cdot Sponge \cdot miRNA + v_{dis, Sponge\&miRNA} \cdot Sponge\&miRNA\\ \frac{\mathrm{d}Sponge/miRNA}{\mathrm{d}t} & = & v_{as,Sponge\&miRNA} \cdot Sponge \cdot miRNA - v_{dis, Sponge\&miRNA} \cdot Sponge\&miRNA \\ & & - d_{Sponge\&miRNA} \cdot Sponge\&miRNA \end{array} \right. \end{equation*}
Results
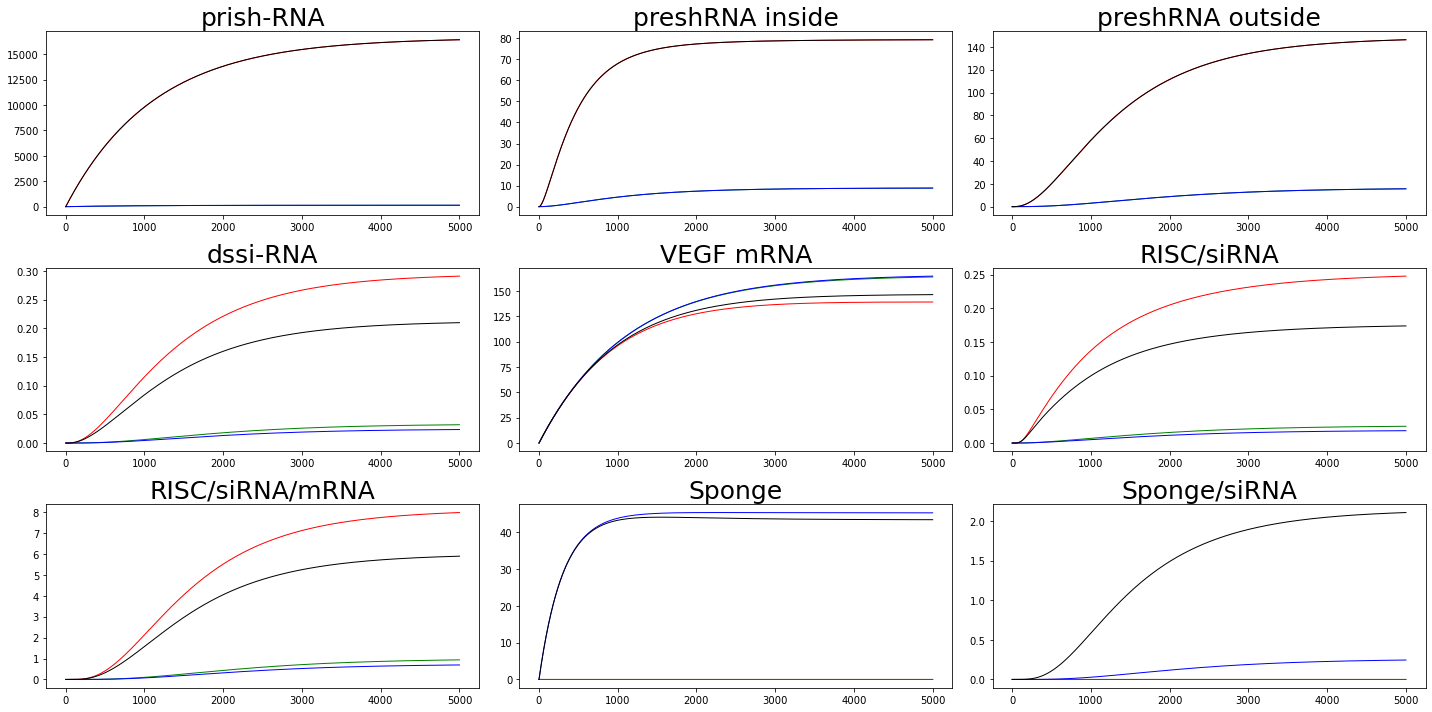
We adjust the value of $\alpha_{prishRNA}$ to represent ordinary cell($\alpha_{prishRNA} = 1 \times 10^{-3}$) and cancer cell($\alpha_{prishRNA} = 1 \times 10^{-1}$). Similarly, we adjust the value of $\alpha_{Sponge}$ to distinguish whether or not a sponge is considered. $\alpha_{Sponge} = 1\times 10^{-3}$ means we are considering sponge effects while $\alpha_{Sponge} = 1\times 10^{-10}$ means we are not taking sponge into consideration.
From the figure we can find that in ordinary cell, sponge can do attenuate the effects of RNAi while in cancer cells, the attenuated effect is not enough to offset the effects of RNAi.
Parameters
The parameters in this part are estimated using the same method as before(RNAi). The value can be found in appendix.
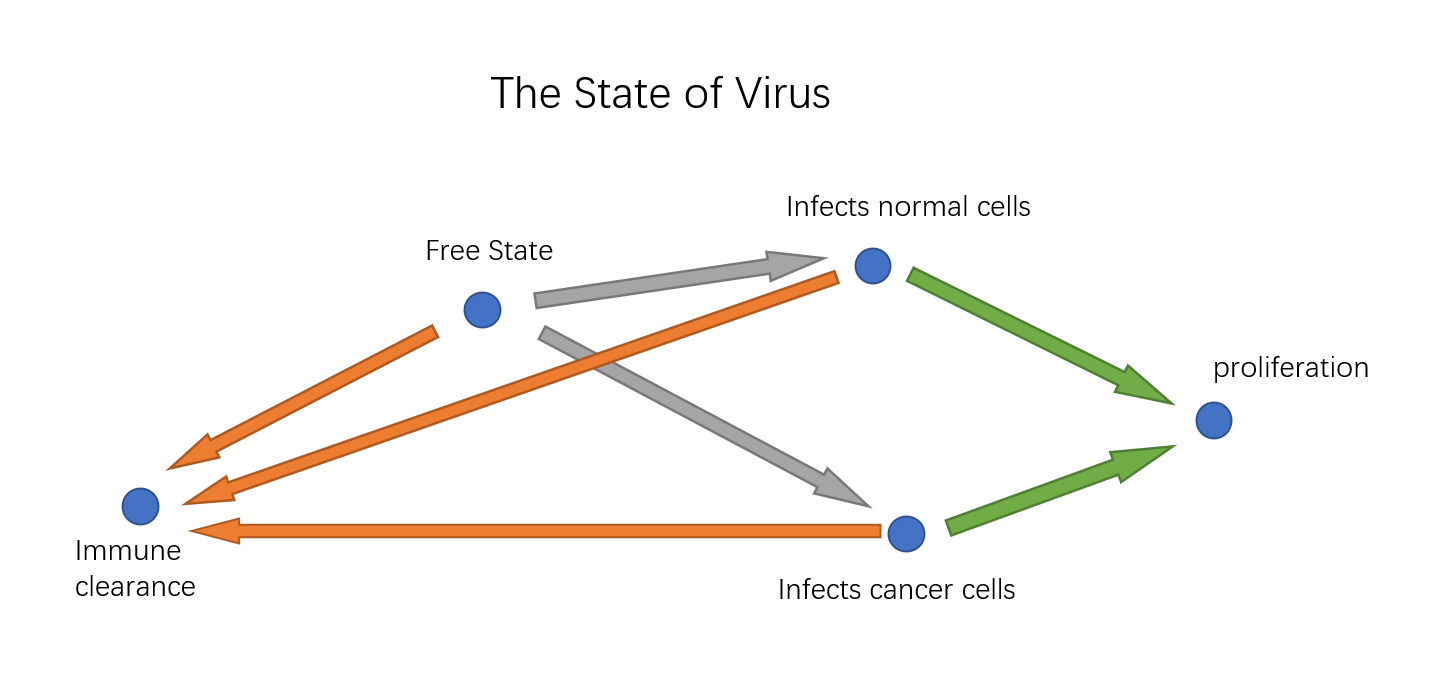
Automata Model
Introduction
Though we have \textbf{Specific Killing Design} and \textbf{Specific Proliferation Design}, we still don't know for sure whether the virus have unintended consequences in human body. We propose a conceptual model using a automata model to simulate the state of the virus in the body, observing whether there will be too much virus proliferation or too much innocent killing.
Description
Because the model is much simplified compared with the actual situation, the parameters are estimated by ourselves.
The key to the model is how the number of virus and cells varies from period to period. We need to give a way to infer the amount in the next period from the information in this period. We have five amounts to consider: the number of free virus ($v_1$), the number of virus infecting normal cells($v_2$), the number of virus infecting cancer cells ($v_3$), the number of normal cells($c_1$), the number of cancer cells($c_2$). Besides, we need some assumptions to simplify the transition process:
-
The total number of cells is constant ($N$).
-
Since the total number of cells is constant, the number of viruses entering the infected state from the free state is constant in proportion to the total number of viruses. Let's call this ratio $\alpha$.
-
Within each cycle, the proportion of virus deaths from various causes is constant, set as $d$.
In one period, free virus can infect cells. We think that the ratio of normal cells to cancer cells is the same as the ratio of normal cells to cancer cells. And considering infecting virus can replicate, suppose virus infecting normal cells and cancer cells can produce $r_1$ and $r_2$ times as many offspring as itself in one period. These factors allow us to give a transfer formula for the number of viruses.
\begin{equation*} v_{1}' = v_{1} - d v_{1} - \alpha v_1 + r_1 v_2 + r_2 v_3 \end{equation*}
Then we need to consider how our specific infection, specific killing ,specific proliferation works in our model. For specific infection, we think cancer cells are $spi$ times more likely to be infected than normal cells under the same conditions. Considering specific killing, assume the virus in an infected state for normal cells and cancer cells are $k_1$ and $k_2$ respectively. Then we can give other transfer formula.
\begin{equation*} \begin{aligned} v_2' & = & v_2 - d v_2 + \alpha v_1 \frac{c_1}{c_1 + c_2 \cdot spi} \\ v_3' & = & v_3 - d v_3 + \alpha v_1 \frac{c_2 \cdot spi}{c_1 + c_2 \cdot spi} \\ \end{aligned} \end{equation*}
When we are going to update the number of cells. First we consider the part killed by adenovirus. We use max function to prevent negative values. The $1$ in max function is to prevent division by zero.
\begin{equation*} \begin{aligned} c_1' &=& max(1, c_1 - k_1 v_2) \\ c_2' &=& max(1, c_2 - k_2 v_3) \\ \end{aligned} \end{equation*}
Then considering the constant total cell number hypothesis, we map the number of cells to scale.
\begin{equation*} \begin{aligned} c_1'' &=& \frac{c_1'}{c_1' + c_2'} N\\ c_2'' &=& \frac{c_2'}{c_1' + c_2'} N\\ \end{aligned} \end{equation*}
Parameters and Results
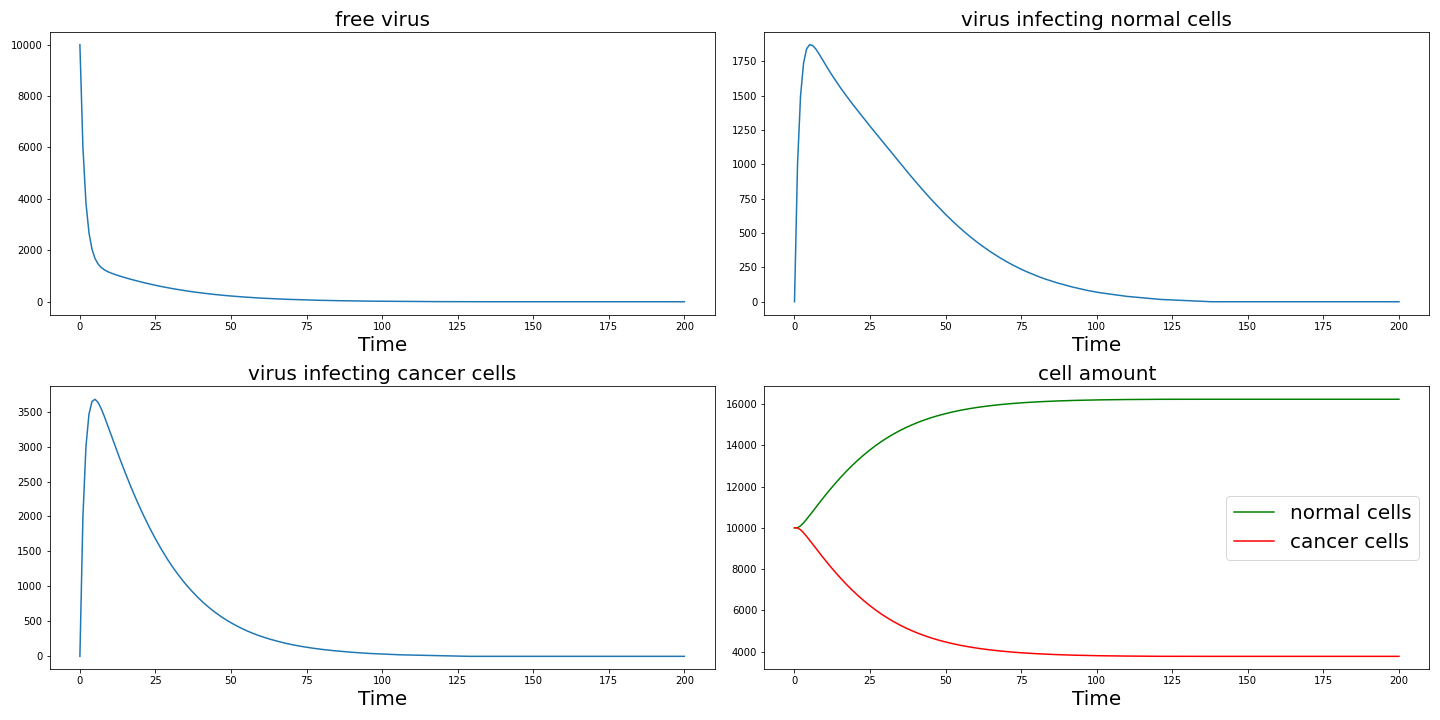
First we choose $N=20000, d=0.1, \alpha=0.3$, $spi=5$, $k_1 = 0.02, k_2 = 0.2$,$r_1=0.05, r_2=0.2$. The initial free virus number is chosen as $10000$, the initial normal cell amount and cancer cell amount are both set to $10000$.
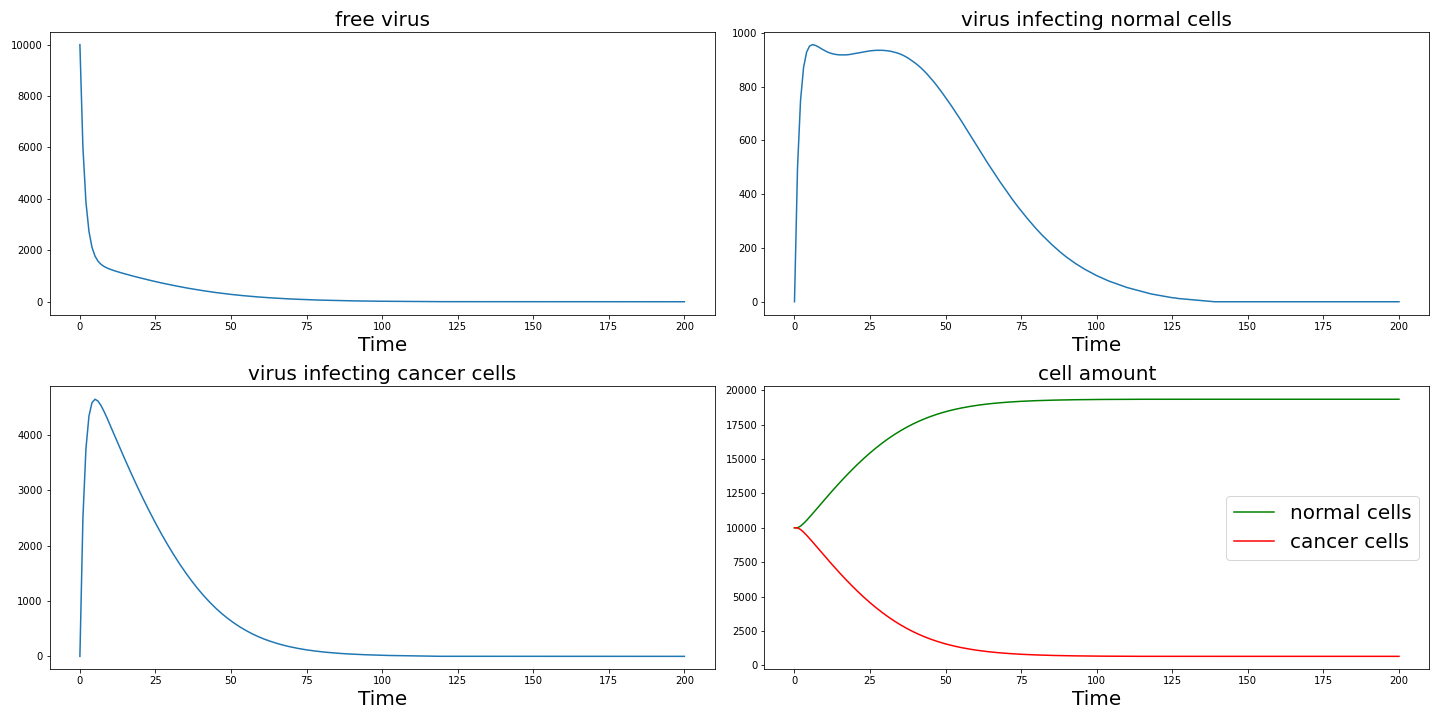
From the result figure, we can find adenoviruses can effectively kill cancer cells before they are cleared.
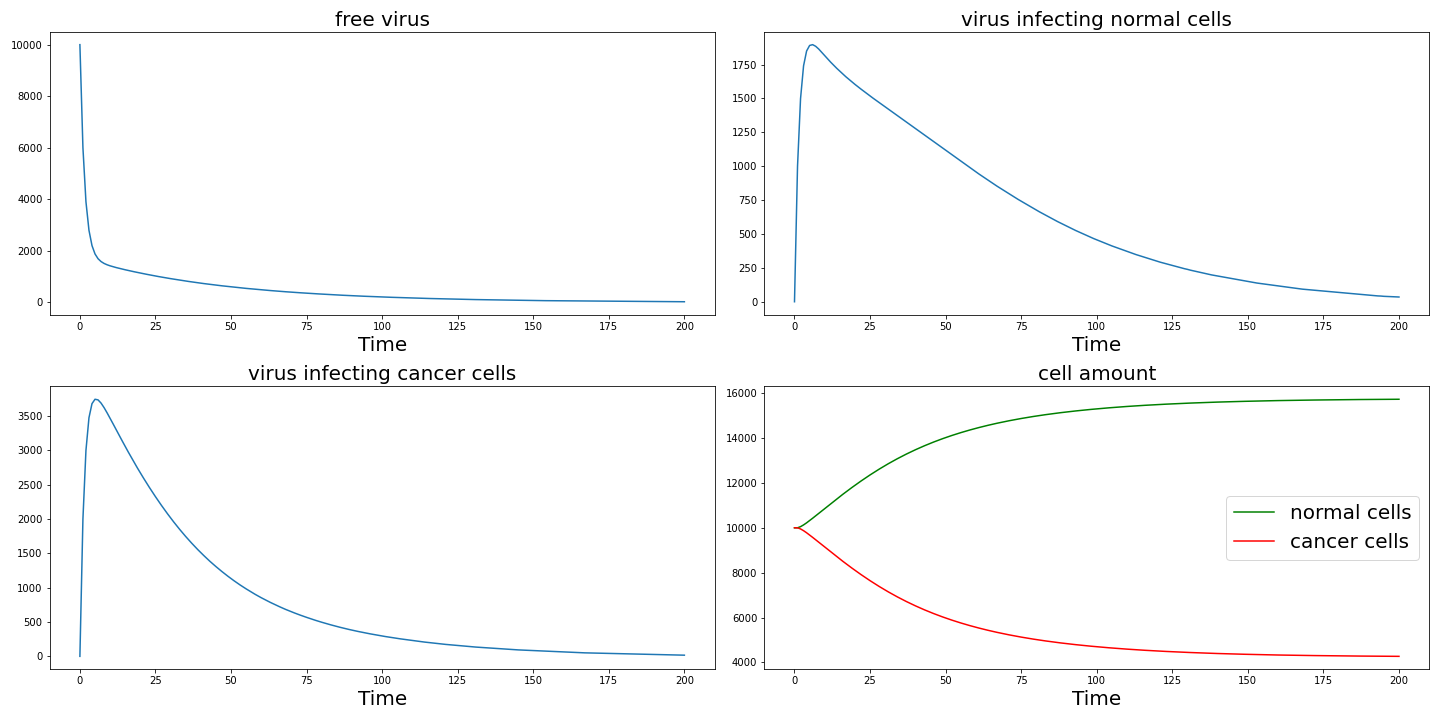
Then we are going to test how our design work from this model. First we change $spi$ to $1$ to observe the effect of specific infection. The result is shown in the following and as $spi$ decrease, cancer cells cannot be effectively killed.
Set $r_1 = r_2 = 0.1$ then we can get the following result which shows specific proliferation also plays an important role in the killing of cancer cells.
Set $k_1 = k_2 = 0.1$ then we can get the following result. Here the reduction in killing efficiency is because more normal cells are killed and as we fixed the total number of cells, the increase in normal cell killing leads to a decrease in cancer cell killing efficiency. Actually it causes more normal cells to die.
Since this is a conceptual model, the quantitative results provide limited reference. But it can still reflect some of the effects of our specific design.
References
[1] Eytan Zlotorynski. Insights into the kinetics of microrna biogenesis and turnover.NatureReviews Molecular Cell Biology, 2019.
[2] Heather A Ferguson, Jennifer F Kugel, and James A Goodrich. Kinetic and mechanisticanalysis of the rna polymerase ii transcription reaction at the human interleukin-2 pro-moter11edited by k. yamamoto.Journal of Molecular Biology, 314(5):993–1006, 2001.
[3] Shlomi Reuveni, Isaac Meilijson, Martin Kupiec, Eytan Ruppin, and Tamir Tuller. Genome-scale analysis of translation elongation with a ribosome flow model.PLOS ComputationalBiology, 7(9):1–18, 09 2011.
[4] D.N. Fouillen A. et al. Bouvette, J. Korkut. High-yield production of human dicer bytransfection of human hek293-ebna1 cells grown in suspension.BMC Biotechnol 18, 76(2018)., 2018.
[5] Nancy J. Pokrywka and David S. Goldfarb. Nuclear export pathways of trna and 40sribosomes include both common and specific intermediates.Journal of Biological Chemistry,2021/10/02.
[6] Antoine et al Baudrimont. Multiplexed gene control reveals rapid mrna turnover.Scienceadvances, 3, 2017.
[7] Rafał Krzysztoń, Daniel Woschée, Anita Reiser, Gerlinde Schwake, Helmut H. Strey, andJoachim O. Rädler. Single-cell kinetics of sirna-mediated mrna degradation.Nanomedicine:Nanotechnology, Biology and Medicine, 21:102077, 2019.
[8] Jiajia Guo, Jianjun Wang, and Genxing Xu. Pharmacokinetic perspective and the deliveryof sirna in vivo.Pharmaceutical and Clinical Research, 18(4):363–365, 2010.
Appendix
Our source code is avaliable on our Github.
We provide a PDF of all formulas and parameter tables is provided for easy reference.

FOLLOW US


