Team:RUM-UPRM/Results
Overview
Over the course of August to October, we implemented various cloning strategies to insert our proposed genetic constructs into Escherichia coli. Some setbacks in the 3A Cloning caused our team to reconsider other cloning strategies but we decided to select the simple cloning strategy as the most appropriate option to insert our proposed parts. For the last month, we obtained promising results for a possible successful cloning of Device 1, based on the results of an electrophoresis run of pUC19 samples derived from blue colonies of bacteria after a blue/white screening session. These results prompted us to carry out the Proof of Concept for Device 1 to validate if what we had was truly what we desired.
We prepared a serial dilution of a saturated RDX solution. We added these dilutions to inoculated cultures of LB medium, with possibly cloned Device 1, in the exponential phase of Escherichia coli. When RDX was added, and after an overnight incubation, we took absorbance readings and fluorescence with a transilluminator. Afterwards, we performed plasmid extraction, digested it with PstI and ran a gel electrophoresis. Unfortunately, we did not see any fluorescence and the gel did not show our expected results. For future works we will digest the remaining extraction and run another gel electrophoresis to validate if our Device 1 was successfully cloned.
Device 1 using 3A Cloning
The 3A Cloning strategy for Device 1 started out as a double digestion using the enzymes PstI and EcoRI for both the fragments and the plasmids. However, the r2.1 buffer used only assured a 100% activity for the enzyme of EcoRI, while the enzyme of PstI only had a 75% of activity. This was followed by a ligation protocol to join Device 1 Fragment 1 (D1F1) with the plasmid pSB1A3, and Device 1 Fragment 2 (D1F2) with the plasmid pSB1K3. No growth was observed on any of the plates after the first transformation test run.
For the second attempt, the buffer for the double digestion was changed to r3.1 which had a 100% activity for the enzyme of PstI, while for the enzyme of EcoRI only had a 50% of activity. This new transformation had bacterial growth on two plates that had the enzyme ligase added, while the control plates, which didn’t have ligase, presented no colony growth. Those plates that demonstrated bacterial growth and were possible cloned bacteria were later inoculated, extracted and digested with restriction enzymes to visualize them under a gel electrophoresis. The gel run didn’t demonstrate the gel bands for the fragments indicating that the plasmids recirculated without the fragments and no insert was found. The following transformations started to present pink colony growth and showed unexpected results which were catalogued in the Pink Colonies section down below.
Device 2 using 3A Cloning
The first attempt of 3A Cloning for Device 2 consisted of a double digestion of the two DNA fragments belonging to Device 2. The enzymes PstI and EcoRI were used to digest each plasmid and fragment. Device 2 Fragment 1 was ligated with the plasmid pSB1A3, and Device 2 Fragment 2 was ligated with the plasmid pSB1K3. The r2.1 buffer ensured that EcoRI would have 100% activity while suspended, while PstI only had 75% activity using the same buffer. This meant our results would be at a disadvantage since both enzymes wouldn’t have maximum efficiency percentages. No gel electrophoresis was performed after the digestion, meaning we wouldn’t be able to determine if the plasmids were linearized or still circularized at the moment of attempting ligation.
During the bacterial transformation, growth was observed on all three plates. This suggests that the linearized plasmids might have been circularized since the plate that didn’t contain DNA ligase still had colonies in it. The largest number of colonies were observed in the plate that only contained the vector and DNA ligase added into the ligation tube. Growth was also observed in the plate that contained DNA ligase, the vector and the insert but after realizing a Miniprep reaction with the colonies, no insert was observed in the gel electrophoresis.

Figure 1. From left to right, Control 1 (Only Vector added), Control 2 (Vector and DNA Ligase added), Experimental (Vector, DNA Ligase and Insert added).
Due to uncertainties about the linearized plasmids possibly being circularized, we ran a gel electrophoresis using the stock of the plasmids. The gel electrophoresis showed multiple bands under each well, leading us to conclude that we are dealing with circularized plasmids that are in three different states: normal, supercoiled, and relaxed. We notified the Device 1 team members and our PI’s about this and started optimizing our work plan according to these new findings.

Figure 2. From left to right: Well 1 - 1kb Plus Ladder; Well 2 - pSB1A3, Well 3 - pSB1C3, Well 4 - pSB1K3.
Contrary to our original cloning plan, we decided to switch up the enzymes used in our digestions and switched over to using SpeI and EcoRI, both of which have 100% efficiency in the r2.1 buffer. We also switched over to using the thermocycler for our ligation and transformation reactions to guarantee a more optimal temperature distribution during the reactions and the heat inactivation.
Unfortunately this time we didn’t observe any growth in all of our transformation plates. We left them incubating for over 48 hours and still no colonies were to be found. One last additional transformation was realized and we obtained the same results: zero colonies were observed.
We consulted our results once again with our PI’s and Advisors and, as mentioned above, the conclusion we came to was that the restriction sites on the edges of our DNA fragments didn’t leave enough space for our restriction enzymes to cut efficiently.
Adapting to situations
The transition of cloning strategy from 3A to simple cloning
Throughout our 3A Cloning plan in Device 1, we started noticing irregularities in colony growth after bacterial transformation. For our protocols, we were using the vector pSB1A3 for our Fragment #1 portions, and psB1K3 for Fragment #2 portions. The appearance of pink colonies in our transformation plates caused the team to reconsider our cloning strategy as we did not expect these results. These pink colonies suggest that the cells could be transformed only with mCherry (a red fluorescent protein) or that our plates were contaminated with Serratia marcescens, a Gram-negative bacteria known for its red colored colonies.

Figure 3. Pink colonies observed on all of our pSB1A3 and pSB1K3 plates.

Figure 4. Pink fluorescence observed when placing the plates with pink colonies under UV light using a transilluminator.
Upon closer inspection of our sequences, and with the help of Dr. Carlos Rios Velazquez, and our advisors Victor and Luis Montalvo, we noticed that there were not enough nucleotides for the restriction enzymes to bind onto the fragments of our devices. This would cause digestion to occur with much less efficiency than anticipated. A new cloning plan had to be developed because of the uncertainties regarding plasmid structure and the color of the colonies. We resorted to simple cloning in which the fragments would be inserted into a plasmid (pUC19) and then digested to create new restriction enzyme cut sites in a way that each fragment would join in a sequential manner during ligation. While carrying out the blue white screening technique during this new plan, we saw pink colonies again, but after several transformations we saw blue and white colonies.
Device 1 and Device 2 using pUC19 Cloning
➜Device 1
Device 1 showed promising results in the October electrophoresis. According to the last electrophoresis performed, we decided to carry out a simplified Proof of Concept using RDX thanks to the doctoral student Francheska Carrero and Dr. Samuel Hernández as the gel showed possible successful cloning of both Fragments of Device 1.

Figure 5. Gel electrophoresis ran showing the possible cloned plasmids with the Device 1 Fragments.
Each well contains different samples of pUC19 with possible Device 1 digested with PstI. Results shown in this gel indicate unexpected results from the majority of samples except the sample F1F2 2B. This sample showed an intense band around 2.7 kb, which might be pUC19 without the device, another band around 3.1kb which indicates possible successful Fragment cloning of Fragment 1 (1.5kb) and 2 (1.6kb)
An electrophoresis of digested plasmid with possible insertion of Device 1 was carried out with enzymes PstI and XbaI. The expected location of bands are 1.5 kb y 1.6 kb, but we obtained a band around 5.7kb and around 2.7kb. This might indicate that digestion was not done successfully. However, all of the bands above the ones in 2.7 kb are located at around 5.7-5.8 kb, which might represent pUC19 with Device 1.

Figure 6. Gel electrophoresis ran showing the possible pUC19 plasmids with the Device 1 Fragments.
For our Proof of Concept we prepared a serial dilution of a saturated solution of RDX in 70% ethanol, and added this to our Escherichia coli in its exponential phase. We saw an inverse relationship between the concentration of RDX in solution and bacterial growth, also seen in our absorbance testing. Also we observed our cultures for fluorescence with a transilluminator after an overnight incubation.
After the observation for fluorescence and absorbance readings, we decided to perform extraction, followed by a digestion with enzyme PstI and a gel electrophoresis protocol. We did not see the expected fluorescence on any of the incubated bacteria, so we determined that mCherry was perhaps not being expressed. Additionally, the gel electrophoresis did not show the expected results. In the future, we will perform another digestion with the enzyme PstI and a gel electrophoresis protocol to answer the following questions: Were there mistakes with the gel electrophoresis protocol? Was Device 1 successfully cloned into pUC19?

Figure 7. Device 1 Escherichia coli DH5alpha Cell Growth in RDX Solution.

Figure 8. Bacterial Growth of Escherichia coli with RDX Samples 1C-6C (left to right).

Figure 9. Bacterial Growth of Escherichia coli with RDX Samples 1E-6E (left to right).

Figure 10. Bacterial Growth of Escherichia coli with RDX seen on UV transilluminator with RDX Samples 1C-6C (left to right).

Figure 11. Bacterial Growth of Escherichia coli with RDX seen on UV transilluminator with RDX Samples 1E-6E (left to right).
➜Device 2
Even though we did not have similar results to those of Device 1, we had one promising result, where Fragment 2 of Device 2 was successfully cloned into the plasmid through the simple cloning method, which is present approximately around the 2.5kb band. In the future, we will attempt to clone fragment 1 and, eventually, the entire device.
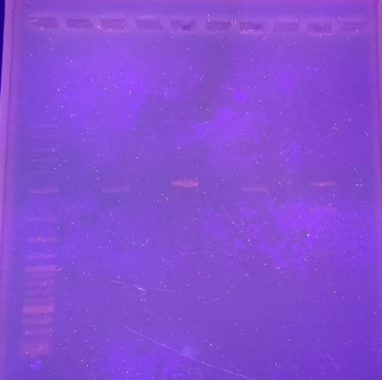
Figure 12. Gel electrophoresis ran showing the digested Device 2 Fragment 2 present in pUC19 around the 2.5kb area.