Team:Paris Bettencourt/Characterisation
Minicell Characterization
Introduction
Because the literature available on minicells is not extensive, our team wanted to uncover the properties of these organisms to have a better understanding of how we could and/or should use them.
Characterization of minicells was done mainly by targeting their main specific traits: nano-size and lack of genomic DNA. Compared to average bacteria, minicells have a particular size - ranging from 50nm to a few micrometers (1). To gather quantitative data on min mutant strains used, Flow Cytometry and Dynamic Light Scattering assays were performed.

Figure 1) Diagram representing minicell formation.
Minicells also cannot replicate due to lack of the nucleoid - a structure that contains all the genetic information a prokaryote would need to create a copy of itself (2) . To ensure safety on our final application for minicells, we searched for assays that could show in quantitative and qualitative data that minicells actually can’t replicate. By performing Live Cell Imaging, Microscopy, DAPI staining, Growth Curves, Time Course O.D. and Fluorescence Measurements, we sought to understand their behavior and limitations as a safe chassis to test synthetic biology circuits and bio-produce enzymes for a range of applications.
Design
The first step of characterization was realized by flow cytometry using BD LSR Fortessa X-20 to determine the proportion of minicells and mother cells in a culture from the strains:
the E. coli MG1655 for the negative control provided by Centre de recherches interdisciplinaires (our home institution)
MinB, a minicell producing strain Min operon knockout provided by Ariel Lindner from our home institution
TB43, an E. coli producing minicell strain derived from MG1655 which has a deletion in both min and lac operon (sequence details) provided by Marburg former IGEM 2015 team.
The result we expect are graphs where it is possible to visually separate cell types and debris by size (FSC). In order to have relevant data, high statistical power relies on a large amount of replicates per sample. By analyzing a larger set of replicates, we tried to increase reproducibility of our data.
For this experiment, the strains (MG1655 wt and TB43 min mutant) were analyzed before and after transformation with a GFP encoding plasmid to study the fluorescence expression in minicells and mother cells.
We decided to test two types of cultures considering the presence of debris during the FACS analysis: (after overnight and overday incubation). In fact, more debris can be misidentified as minicells after an overnight culture when this risk is lower after overday cultures. The overday experiment will be performed on the days following the wiki freeze.
This approach allowed us to observe the difference in fluorescence from minicells and mother cells with our GFP-encoding plasmids over time. You can find our protocol here.
Note: About the flow cytometer detection limits: less than 40 nm will be impossible to detect, so we might be missing out on the small minicells. However, such small minicells do not need to be considered as their production rate is so low.
Dynamic Light Scattering
Previous data on minicells (3)), have aimed to calculate their average size in the sample by measuring them through Dynamic Light Scattering. To measure the characteristics of particles (i.e., size, zeta potential, weight), we performed experiments in a Particle Size Analyzer (Malvern ZEN 3600 Zetasizer, Labo Membrane Traffic in Healthy & Diseased Brain).
The Zetasizer uses light-scattering to measure the size of particles from a few nanometers to a few micrometers. One information in particular interested us, the size repartition of our minicells.
For comparisons between particle size measurements obtained from Flow Cytometry and Zetasizer, we used the same set of samples that were organized as:
a) MG1655 without any purification
b) MG1655 purified
c) TB43 without purification
d) TB43 purified
See the details of our purification protocol here .

Figure 2) Illustrative view of minicells in unpurified samples for particle measurement.
Microscopy
Microscopy was one of the most used techniques to obtain and confirm data in our project. We used it for validation of minicell size, to evaluate the integrity of their membrane over time and to take nice images of how they were formed. Among all the different purposes microscopy was used for, some are very important because they shed light on their lifespan, their enzymatic production capacity, whether they present DNA or not and even their size compared to their respective parental cells (See minicell induction constructs).
1. Minicell size:
We were able to compare minicells and parental cells sizes visually.
2. Minicell formation:
By performing cell imaging time lapses, it was possible to observe a single parental cell giving birth to a range of minicells through time. And we confirm minicells formation through the poles of parental bacteria.
3. Membrane integrity of minicells:
As a proposed manufacturing tool, minicells should have a membrane resistant enough to withstand stressful environment conditions involved in shipping (e.g., temperature, time). We have verified minicell membrane integrity by observing minicells at different times under the microscope.
4. Minicells fluorescence intensity:
We used MG1655 and TB43 transformed with GFP plasmid, to observe visually the differences between the fluorescence intensity of minicells in comparison to parental cells, and with time-lapse imaging, we could see the prevalence of fluorescence emitted from cells through time.
5. Purification methods:
In the long road of reaching the perfect minicells purification method, we used microscopy to see the purity of our samples, for them to be used in the quantitative assays described above.
6. Staining assays:
a. We have stained minicells with Trypan blue (0.4%) to analyze the membrane as a dye exclusion method. We applied Trypan blue in cell counting assays as well, to make sure that the minicells induced by the plasmid built were still viable.
b. our goal is to have a pure and safe genomic-free minicell sample, we did DAPI (4′,6-diamidino-2-phenylindole) staining with our min mutant strain.
7. Cell counts
As a method to characterize our synthetic biology construct of minicell induction, we performed minicell counts using the grid pattern of Malassez (DHC-M01).

Time Course Experiment
As a strong data characterization of strains and plasmids used in our project (built by us or not), we opted to conduct assays where data could be gathered in an automated manner. This increased reliability and reduced possible bias in the outcome assessment of the data analyzed (see partnership).
Variables interesting to be measured included O.D.600 and Fluorescence. To conduct these 8 to 12 hour long experiments, equipment such as TECAN Spark and TECAN infinite pro 200 were set up.
Timecourse measurements were used to validate:
1. Purification method:
After purifying minicells from parental cells, we measured the O.D. through 6 hours, to check if the density of the media changed over time, using TECAN Spark.
See the detailed protocol here.
2. Lysis characterization:
After successfully engineering the cI857 lambda prophage in the genome of bacteria, we performed time course experiments to characterize the lyse capacity of the new strain by raising the temperature (see Engineering success).
3. Tryptophan optimum concentration:
For our main application - indigo pigment production, we needed to assess a optimum amount of this compound to be broke down by tryptophanase into indole (see Textile Dyeing.)
4. Enzyme plasmid characterization:
A plasmid to be activated only in the presence of arabinose was built to control protein expression only after minicells are separated from their parental cells (see Parts). To characterize this composite part, 12 hour measurement in TECAN infinite pro 200 was conducted to access fluorescence and OD.
Plasmid DNA extraction from minicells
Having in mind that minicells are capable of being a chassis to test any plasmid, we proposed an assay to investigate whether we could extract plasmid from minicells. The miniprep kit was kindly sponsored by Promega.
We first purified minicells from mother cells (TB43 strain) using our protocol.
Then we extracted the plasmid DNA from the minicells and we transformed the plasmids into a competent TB43 strain by heat-shock.
The plasmid contained an antibiotic resistance gene for Chloramphenicol and a GFP gene.
The cells were then plated on LBA and Chloramphenicol and incubated overnight at 37°C. The absence of colonies could mean that the transformation failed or that there was no plasmid DNA (with the antibiotic cassette). The presence of yellow/green colonies would confirm that the DNA extraction from the minicells and transformation into TB43 worked.
Storage of minicells
After purification, minicells can be stored in the fridge (4°C) for more than 24 hours and still have an intact membrane. This led to a series of ideas and experiments on how to store them more efficiently. We tried making aliquots of minicells and storing them at -80°C.
Results
During our cycle of Design, Build, Test and Learn we can definitely say we learned interesting things about minicells. In this page, we present to you in detail, a true guide on minicells behaviour, so you can be as familiar with them as we are.
Flow cytometry
Flow cytometry can be used to differentiate cell population by their size (FSC) and their complexity (SSC).
The data below were obtained following the overnight version of the protocol with 5 technical replicates for each strain. After the analysis, we gated three populations: the mother cells that are the biggest -high FSC- and more complex -high SSC- (in red in the gating), the minicells (in blue) and the debris -smallest and less complex- (in green).

Figure 3) Discrimination of mother cells, minicells and debris based on the scatter parameters FSC and SSC in our negative control MG1655 and a minicell producing strain TB43.
We also studied the fluorescence emitted by the cells, by obtaining histograms as the one below from the strain TB43.

Figure 4) Amount of fluorescence expressed by the cells from the different gates. Here we showed a minicell producing strain TB43.
Data analysis

Figure 5) Minicell production assay using flow cytometry in MG1655 (WT) and two minicells producing strains: TB43 and MinB, non-expressing and expressing GFP. 5 technical replicates were performed for each strain, 1 unit = well. Standard deviation are indicated on the graph as well as the outliers (dots).
All strains present a similar ratio of cells, minicells and debris in the presence or the absence of a GFP plasmid. The negative control MG1655 presents a very low proportion of minicells (less than 5%) corresponding to the normal minicell production in wild-type E. coli. The proportion of minicells ranged around 10 to 20% for our studied strains: TB43 and MinB. The data does not allow for the choice of a better strain for minicell production. However, this result is coherent as both strains produce minicells through the knock-out of their min operon.
Let’s note that the proportion of debris was twice as high as the minicell proportion. We hypothesize that the high proportion of events that were gated as minicells might contain minicells but also cellular debris after the +10 hours of overnight culture.
We also studied the fluorescence expressed by the population we gated as minicells.

Figure 6) Minicells fluorescence assay using flow cytometry in MG1655 (WT) and two minicells producing strains: TB43 and MinB, non-expressing and expressing GFP. 5 technical replicates were performed for each strain, 1 unit = well. Standard deviations are indicated on the graph, as well as the outliers (dots).
As expected, almost no fluorescence was detected from the 3 negative controls: the strains which are not transformed with a GFP-expressing plasmid. Interestingly, we noted a quite important fluorescence expression by the population we gated as minicells in all the 3 strains transformed with GFP, even MG1655.
This could be because of the fluorescence of the debris that could have been mixed with the minicell group or because the minicell produced by the negative control (through natural abnormal division) are expressing GFP).
Dynamic light Scattering
Dynamic Light Scattering is a technique that allowed us to visualize the average size of minicells, for more details see the design part bose. The experiment was performed with one sample representative for each group. There were no replicates, which makes the result from this experiment not enough for strong claims on minicells' actual size.
The main objective of this experiment was to replicate previous data found in the literature (3) of average particle sizes in a sample after purification assay of centrifugation combined with antibiotics, which was successfully accomplished. Herein we present the results measured by the Particle Size Analyzer (Zetasizer) and discuss them.

Figure 7) Minicell characterization - Zetasizer. Size is represented in nm for each group. Organized as: a) MG1655 without any purification (black line); b) MG1655 purified (brown line); c) TB43 without purification (purple line); d) TB43 purified (blue line).
Are there differences between purified and not purified samples?
Yes, the data from this experiment supports the hypothesis that the minicell purification method used to gather purified samples does separate parental cells from minicells (effect size = >500nm).
Why are MG1655 and TB43 purified samples so similar in size range?
By comparing the curves from MG1655 and TB43 purified samples, it is observed that both of them present similar sizes. This can be explained as the presence of debris in the wt MG1655 sample, as their size is smaller then the supposed minicells from TB43 min mutant strain.
Microscopy
To visualize minicell formation and validate that there are minicells present in the samples, we also performed various microscopy experiments.
1. Minicell size and formation
Firstly, we analyzed minicell size and formation using microscopy images and time-lapse videos of minicell cultures in a O.D600 = 0.05. By using 100x Oil Ph3 Objective Lens and TRANS wavelength in a Zeiss microscope with camera super focus, we could visualize minicells formation from the poles of parental cells (supplementary video 1). Microscope slides were 120x50mm, and coverslips were 25x25mm. 2 uL of TB43 bacterial culture at O.D.600 = 0.05 was used while incubating at 37°C in 80% agarose pads. Images such as these were used for our minicell counting software (see Dry-lab).

Figure 8) Microscopy image of the strain TB43. The formation of minicells is visible from the pole of the parental cell. This image is a representative sample of 3 replicates that enables us to compare the size of minicells and their respective parental cells, as well as to observe their formation through the poles.
2. Membrane integrity of minicells
Secondly, we analysed the lifespan of minicells by observing their membrane integrity. According to Huang et al., 2020 these cells may have a longevity of 10 days on average.

Figure 9) Microscopy image through TRANS lens of TB43 after 6h. The cellular membrane of minicells is still intact, even though they are not metabolically active anymore. We can see the strain TB43 under a 100x Oil Ph3 Objective Lens and TRANS wavelength in a Zeiss microscope with camera focus.
The image above was taken as exploratory data, from a timelapse video of 12 hours (data not shown). Even after 6h, the minicell membrane is still intact. For more on the lifespan of minicells, see Side project.
3. Minicells fluorescence intensity
As minicells will be the host for our protein producing plasmids we sought to see the difference between protein expression between minicells and parental cells. In the following pictures, we compare population images of MG1655, TB43 and MinB, all of which have been transformed with a constitutively expressed plasmid containing GFP (see Design).
By looking under the GFP wavelength, we can see a difference between fluorescence strength visually between populations. Here we have data gathered from wt and min mutant strains under GFP and TRANS wavelengths. These images are representative of a sample of images taken in triplicate. They follow the same settings and slide sizes as the images above.

Figure 10A) Microscopy images of 3 initial populations of E. coli, expressing GFP. MG1655 is a wild-type strain, TB43 and MinB are minicell producing strains. Data shown of TRANS and fluorescence measurements.
The densities of populations have similar O.D. and were incubated at 37°C for 4 hours. As expected, there is a higher proportion of filamentous cells in TB43 and MinB samples. Minicells are hardly visible.

Figure 10B. Zoomed image with TRANS wavelength taken from TB43 strain. Black arrow indicates a minicell.
We hypothesized the small circular dots to be minicells in the TRANS images. However, they are not visible in the fluorescence pictures. This could be because the amount of GFP produced in minicells is below the detection limit or they do not express GFP at all.
Next, we purified the minicell containing samples by centrifugation and addition of antibiotics (see Protocol) and analysed them again by microscopy.
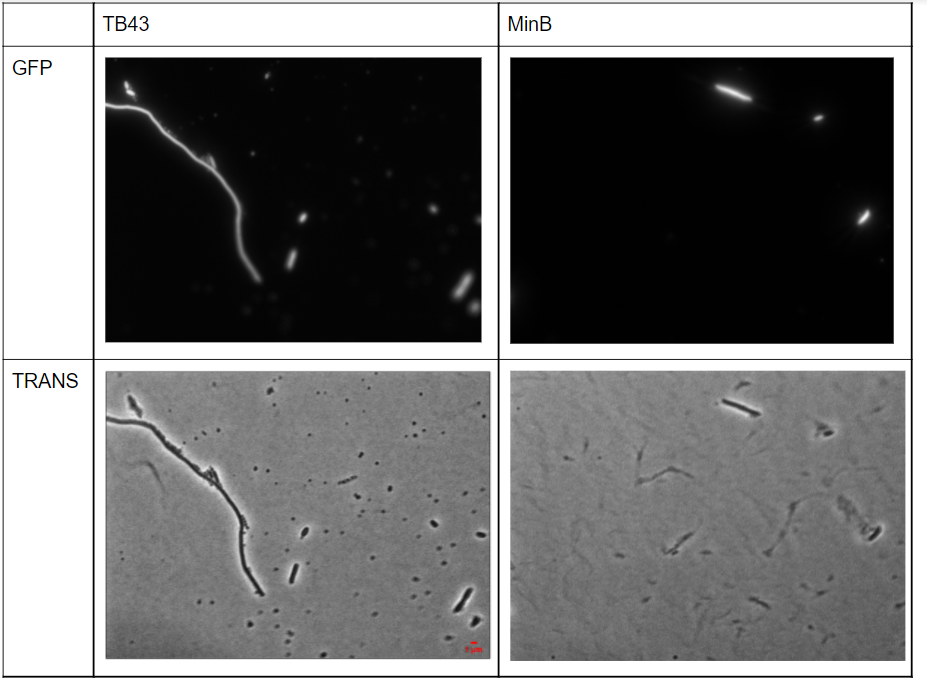
Figure 11) Microscopy images of TB43 and MinB supernatant, after the first step of purification by ultracentrifugation (15 min for .10.000 rpm).
The amount of rod-shaped cells has considerably reduced showing the efficiency of the purification step. However, some bacteria remain, even in their filamentous form.
As still, some parental cells remained by using only ultracentrifugation to separate both populations, we performed a second round of purification with Ceftriaxone - it acts inhibiting the synthesis of compounds from the cellular membrane of bacteria. It seems to have no effect on minicells due to differences in membrane composition (4).

Figure 12) Microscopy images of TB43 and MinB after addition of ceftriaxone antibiotic and 45 min incubation in 160 pm Shaker for 37°C.
After the second step of purification involving the Ceftriaxone antibiotic, there seemed to be no rod-shaped bacteria left. Interestingly, it was possible to visualize small dots in the GFP measurements. They could correspond to minicells expressing the GFP plasmid.
We hypothesize not seeing a large amount of minicells in our frame for 3 different reasons:
- The purification method removes a large quantity of minicells as well.
- Not all minicells have taken up the GFP producing plasmid;
- The yield of minicell production is low.
All 3 hypotheses could be true together.
5. Staining assays
a. Trypan blue (0.4%)
This stain is used for dyeing cells that have the membrane permeable. Microscopy images were taken with a Nikon Eclipse E200 microscope, using a 40x Ph2 objective lens. The image is representative of experiments conducted in triplicate.
In this experiment, it was possible to observe minicells viability, corroborating to findings from previous assays (see Timecourse).

Figure 13) Microscopy image of TB43 transformed with plasmid inducing FtsZ overexpression under IPTG (5mM) regulation. Magnification 40x (See Engineering success).
b . DAPI (4′,6-diamidino-2-phenylindole) staining
DAPI is a chromosomal DNA staining agent that allowed us to observe if our minicell sample was DNA-free. Due to not being purified, the sample presented cells with genomic DNA and without.

Figure 14) Microscopy image of unpurified TB43 lambda (see Engineering success). 100x Oil Ph3 Objective Lens in a Nikon Eclipse E200 microscope. Minicells are indicated by black arrow.
Time-course
The data were obtained after a first 6-hour timecourse experiment and then after a second 6-hour timecourse experiment where the purified minicells were left at 4°C overnight.


Figure 15) OD600 over 6 hours of purified minicells at different initial concentrations. Medium without cells is used as a negative control. A) Cells plated immediately after purification. B) Cells plated after spend the night at 4°C.
In both experiments, we observed that the OD is increasing over time. This could indicate that some growing cells are left after purification.
In the first experiment (Figure 15.A), the OD first decreases before slowly rising. This could be due to the action of the antibiotic Ceftriaxone, which prevents cell division and induces cell lysis. The cells are first lysing, then recovering before growing again. For the second experiment where cells were given time to recover(Figure 15.B), normal exponential growth can be observed. This confirms the hypothesis that growing bacteria might remain after purification.
However, the microscopy images we obtained(see section above) seem to show that the purification process does not leave any rod shaped bacteria. We hypothesize that the cells which were identified as minicells by microscopy might be small E. coli instead. In order to confirm or refute this hypothesis, we performed a DAPI staining on the cultures to visualize the DNA. This would enable us to identify minicells more clearly on microscopy.
The machine cannot discriminate for the fluorescence emitted by minicells or E. coli, therefore no conclusions can be drawn from the fluorescence measurements.
Plasmid DNA extraction from minicells
By Nanodrop, we saw that the plasmid DNA quantity of 15.8 ng/mL confirming that we did extract plasmid DNA from the minicells. Then after overnight transformation and overnight culture, we observed in the morning the growth of a few yellow/green colonies confirming the success of the transformation with the plasmid extracted from the minicells.

Figure 16) TB43 on a plate LBagar and Chloramphenicol after heat-shock transformation with a GFP-plasmid extracted from purified minicells.
Discussion
We faced some difficulties using flow cytometry during our project such as the initial calibration of the machine (voltage) and the reproducibility of our results. Thus, our results need to be analysed carefully and replicated will need to be re-done to confirm our previous results. Additionally, the flow cytometry results have to be analysed with the other characterization experiments that offer to us different perspectives on the same problem.
Conclusion
Minicells are difficult to characterize. Because they do not grow, CFU counts are not possible. Analysis with flow-cytometry is made difficult by their size which is very close to the size of debris. Their size also makes it difficult to count them by live cell imaging microscopy. We struggled to find a single good method to analyze minicells. Below you will find data on the methods we tested.
Finally, because we had more extensive information about TB43 (sequence available) and documentation on iGEM 2015 Marburg website than MinB, we decided to choose TB43 as our working strain for the project.
REFERENCES
(1) Wei, 2021. Towards collaborative development of lineage-agnostic cells. Standford Univesity
(2) Hołówka, J., & Zakrzewska-Czerwińska, J. (2020). Nucleoid Associated Proteins: The Small Organizers That Help to Cope With Stress. Frontiers in Microbiology, 11. https://doi.org/10.3389/fmicb.2020.00590
(3) Jivrajani, M., Shrivastava, N., & Nivsarkar, M. (2013). A combination approach for rapid and high yielding purification of bacterial minicells. Journal of microbiological methods, 92(3), 340-343.
(4) Huang et al.
(5) Farley, M. M., Hu, B., Margolin, W., & Liu, J. (2016). Minicells, back in fashion. Journal of bacteriology, 198(8), 1186-1195.