
Overview
We have established a mathematical model to build the relationship between theory and experiment, better optimize our experiments, predict our conjectures, and achieve the following goals:
(1) Verify the feasibility of the experimental design.
(2) Optimize the experimental process, reduce the time used, and predict the yield.
(3) To explore the relationship between substrate concentration and product concentration.
(4) To explore the relationship between substrate concentration and reaction equilibrium time.
(5) To explore the diffusion ability of dyes in the medium to provide some theoretical guidance for dyeing.
Assumptions
· The characteristics of the same kind of cells are identical.
· The cytoplasmic matrix is homogeneous, including the distribution of the enzyme.
· The enzyme won’t combine with other protein or with each other to become complexes.
· The catalysis of the certain enzyme won’t be influenced by other metabolism pathways.
Modeling Tyrian purple Synthesis
As mentioned in the experimental part, the whole process includes three consecutive enzymatic reactions. The substrate of each enzyme except the first enzyme is the catalytic product of the previous enzyme. Therefore, the establishment of a model to describe the kinetic mechanism of each enzyme is necessary for the optimization of the whole process, in order to shorten the time and maximize the final yield.

· Transport of the Substrate
For the first cell in the whole system, there are two substrates, tryptophan and bromine ion, which need to be transported into the cell by the medium. In the second cell, 6-Bromotryptophan needs to be transported into the cell.
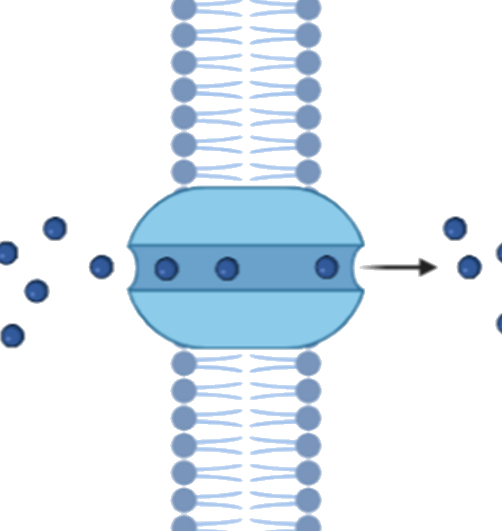
Generally speaking, tryptophan can be transported into the cell through free diffusion, P-type proton pump, permease and ABC superfamily transport system. According to several literatures[2][3][4], only the permease makes the greatest contribution to the transport of tryptophan. Transport through permease is a facilitated diffusion process, so the efflux or influx of the substrate depends on the concentration of the substrate inside and outside the cell.
According to the literature[3][4], it is known that Escherichia coli has three main permeases, Arop,TnaB,Mtr, can transport tryptophan and other aromatic tryptophan.
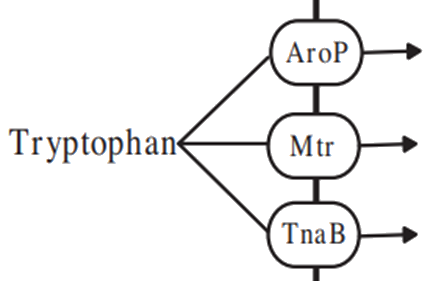
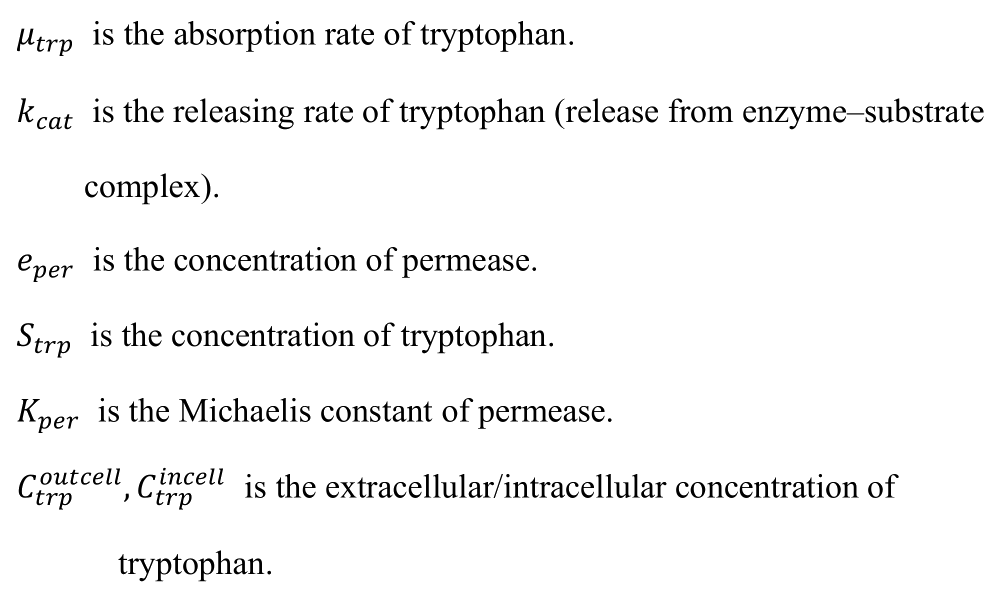
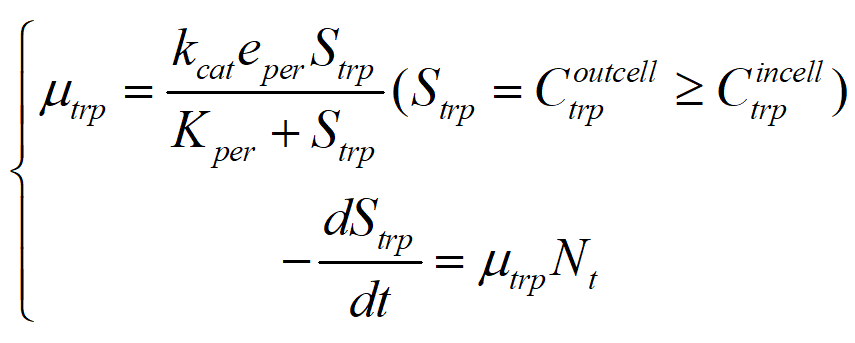
Since TnaB and Mtr contribute less to tryptophan transport, Arop is mainly considered here. So according to Michaelis equation, we can get the absorption rate of tryptophan:

While bromine ion mainly depends on active transport, the transport rate is relatively constant, and we temporarily assume its value as constant b. Combined with the above analysis and discussion, the model is extended from micro to macro level.
Assuming that the bacterial growth rate r is known, we can obtain the following equation:
As a result, we can associate the model with the change of substrate concentration in the culture medium:
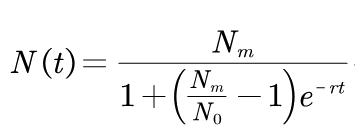
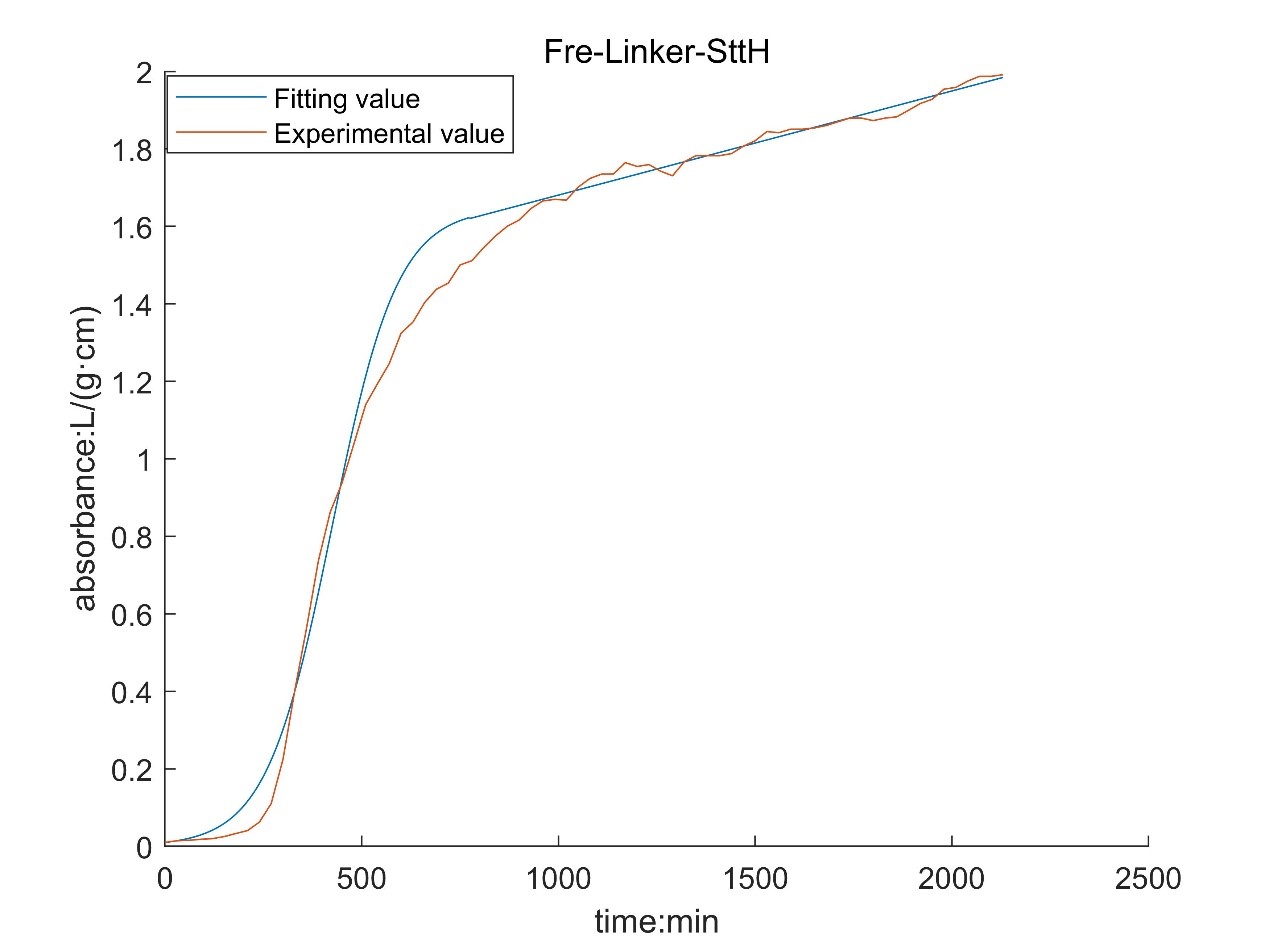
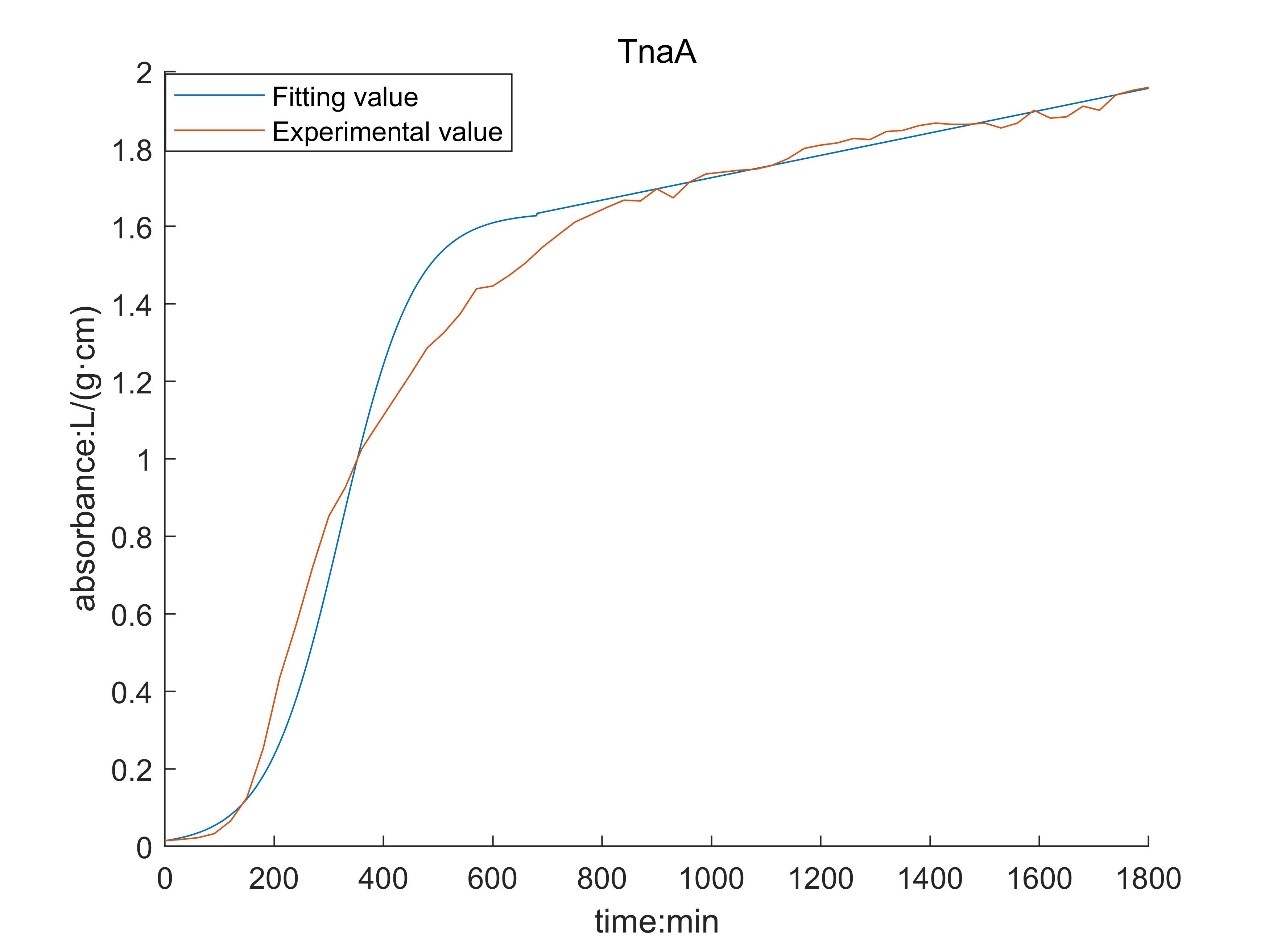
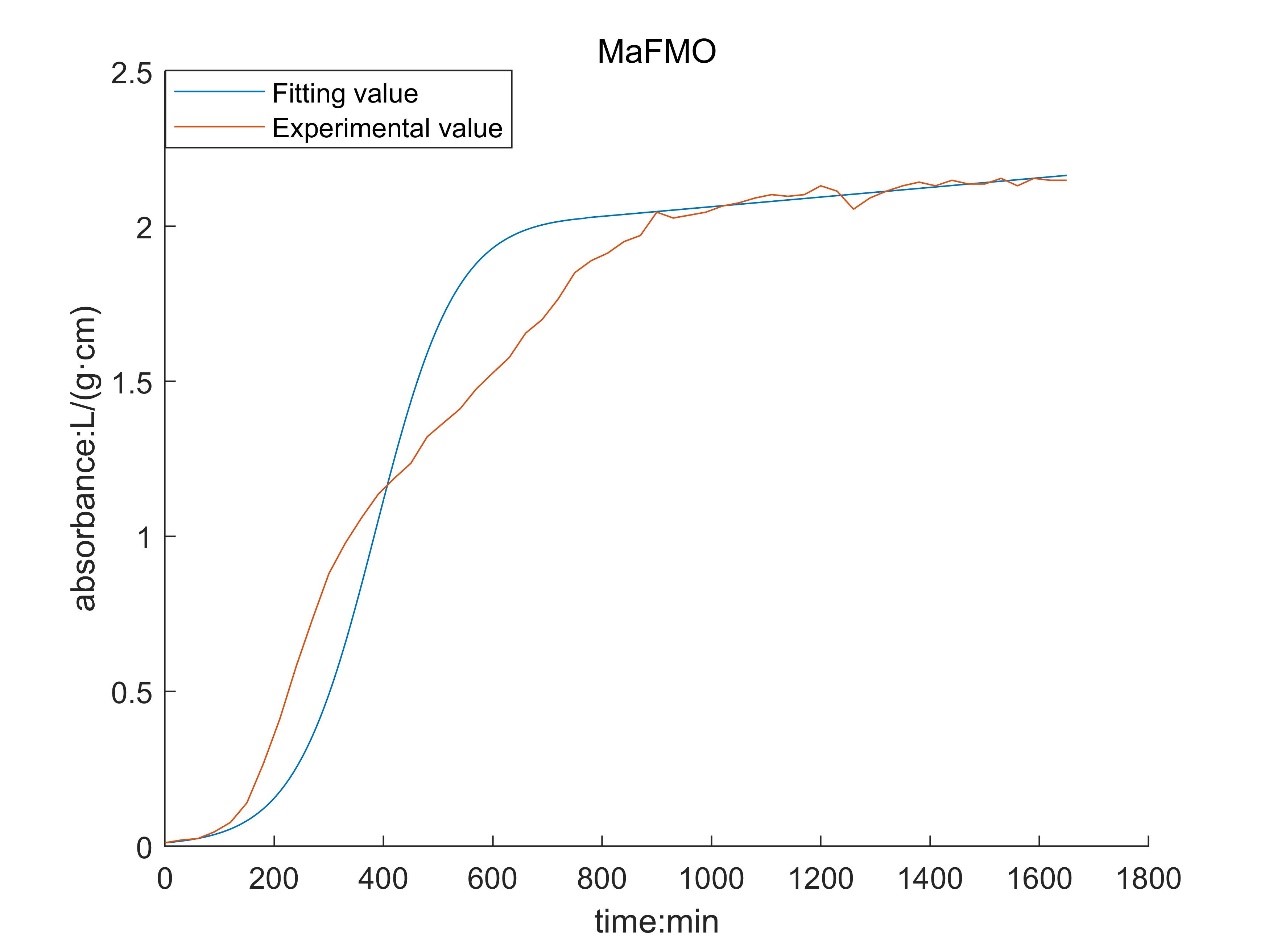
Where N0 is the concentration at the initial time. Nm is the maximum of the concentration. r is the growth rate. Through computer fitting, we can estimate the value of r from the logistic model.
Result table
| Enzyme | r[L/(g·cm·min)] |
|---|---|
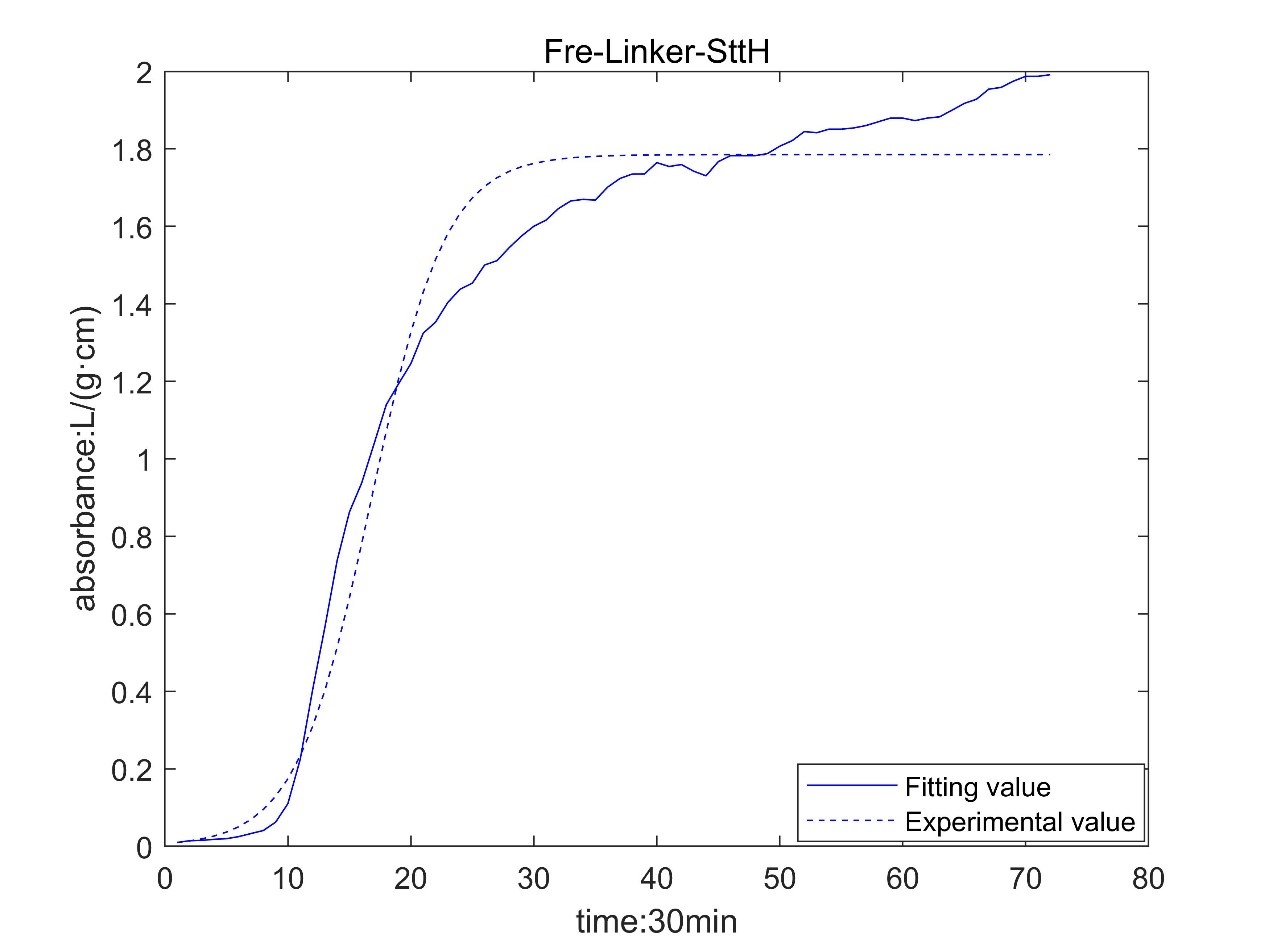
| Fre-Linker-SttH | 0.01095 |
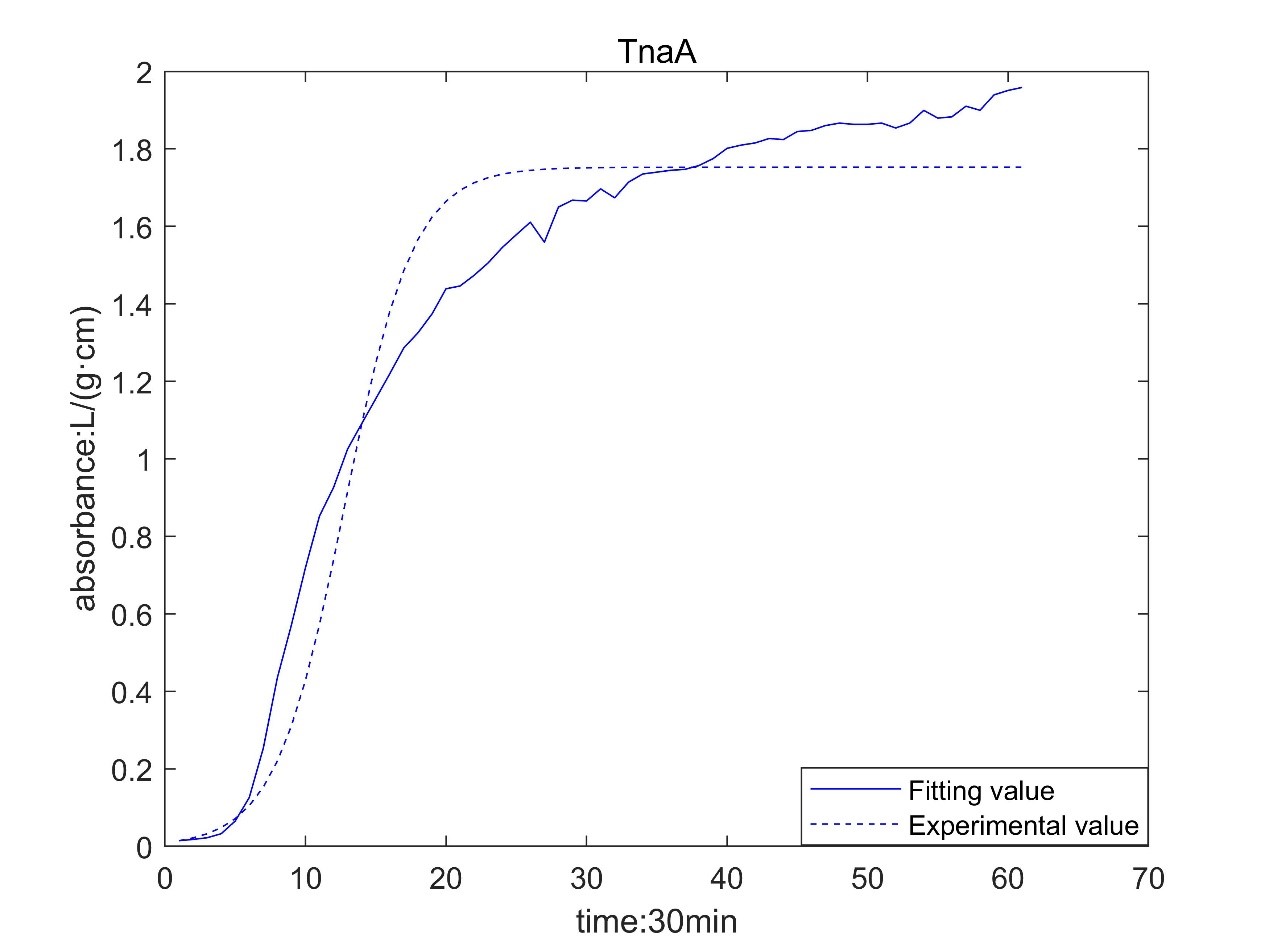
| TnaA | 0.01355 |
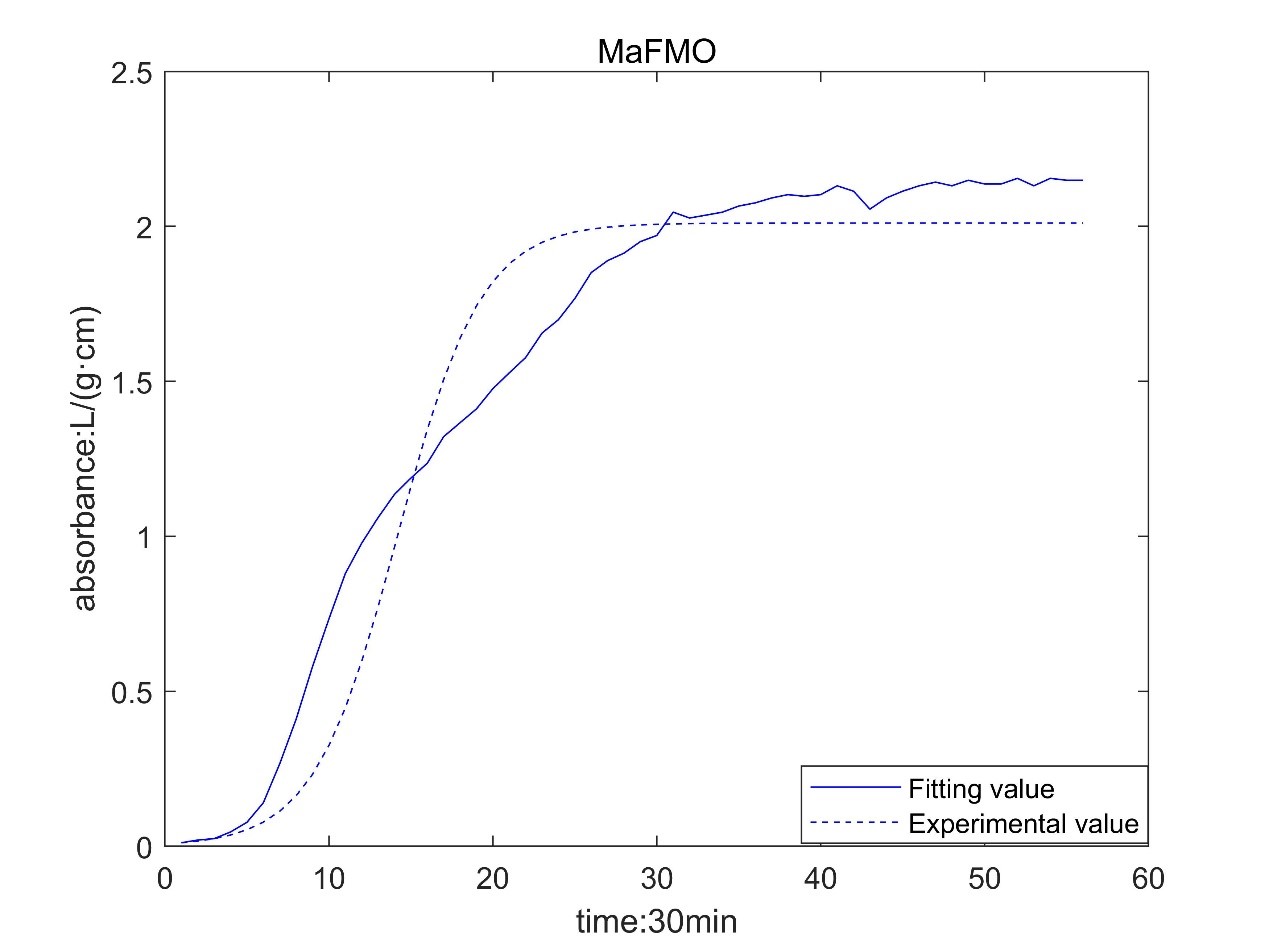
| MaFMO | 0.01304 |
According to the growth curve fitted by OD value, it can be seen that the growth rate of MaFmo-producing bacteria is similar to that of TnaA-producing bacteria, and their growth rate is slightly higher than that of SttH-producing bacteria. Therefore, if three kinds of bacteria are used for production, MaFmo-producing bacteria and TnaA-producing bacteria can be co-cultured and induced, while SttH-producing bacteria can be induced by culture alone.
However, through the comparison between the model value and the experimental value, we find that after a period of time, the absorbance no longer conforms to the logistic model, but obeys the law of linear growth. At the same time, the absorbance of MaFMO has a large deviation. Obviously, it is necessary for us to conduct more in-depth research to modify our original model.
Referring to the literature, we find that the spatial effect and settlement effect will occur in the system after a long time. These effects lead to a deviation in our model. But their impact is difficult to express quantitatively in a unified form. Therefore, we can only optimize the model with the experimental data.
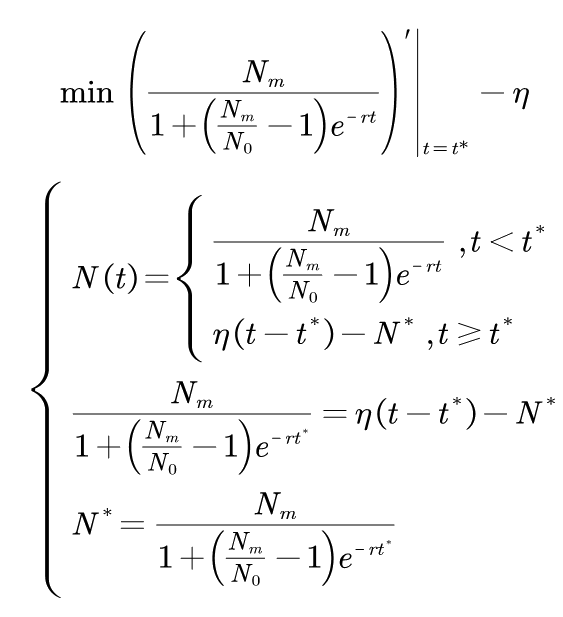
Where N0 is the initial value of absorbance; t* is the time of subsection; N* is the absorbance of segmented;ηis a linear proportional coefficient. By fitting the experimental data and solving the optimization model, the following results are obtained:
| Parameters Enzyme | Fre-Linker-SttH | TnaA | MaFMO |
|---|---|---|---|
| Nm(L/(g·cm)) | 1.647 | 1.636 | 2.038 |
| N0(L/(g·cm)) | 0.01 | 0.0145 | 0.0114 |
| r[L/(g·cm·min)] | 0.01201 | 0.01468 | 0.01425 |
| t*(min) | 774 | 680 | 770 |
| η[L/(g·cm·min)] | 0.0002687 | 0.0002886 | 0.0001554 |
According to the obtained parameters, the optimized image can be obtained.
By comparing with the image before optimization, we can see that the deviation of the model is significantly reduced.
However, there is still a big deviation in the corresponding results of MaFMO. We speculated on the cause of this phenomenon. There is TnaA in the genome of Escherichia coli. Tryptophan will be produced by culture medium and Escherichia coli itself, and indole will be produced under the catalysis of TnaA. Originally, indole will not continue to react, because our MaFMO can only be expressed by adding IPTG. However, due to the existence of leaked expression, MaFMO began to express before IPTG was added. Due to the presence of MaFMO, indole is catalyzed to indigo, so that our bacterial liquid is blue at the later stage of the growth curve measurement. Indigo itself had an effect on the bacteria, so his growth curve deviated.
· Modeling Enzyme-Catalyzed reaction
Michaelis equation needs to be used in the study of enzymatic reaction. In order for the model to be established, the following assumptions need to be met:
· In the system, the substrate is excessive.
· Ignore the reverse reaction at the initial stage of the reaction.
· After the system reaches steady state, the substrate consumption and the formation rate of products are constant and equal. In the first cell:
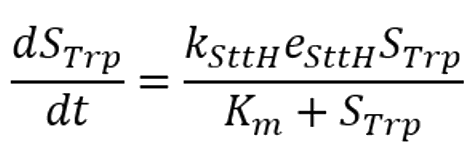
In the second cell:

It is worth noting that in our system, the concentration of the enzyme is not constant. This means that we can't use the Michaelis equation directly, and we have to modify it.
We describe the kinetic properties of a change in protein concentration by a classical differential equation to obtain a value for e.
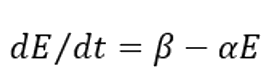
Where β is the synthesis rate of the enzyme and α is the degradation rate of the enzyme.
So we can get an equation for the reaction enzyme concentration versus time:
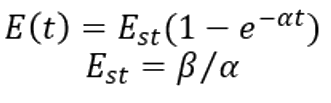
Where Est is the concentration of the enzyme at steady state. The relevant parameters are determined by database search and the unknown parameters are estimated by literature, which are sorted out in the following table:
| Parameters | Unit | Value | Reference |
|---|---|---|---|
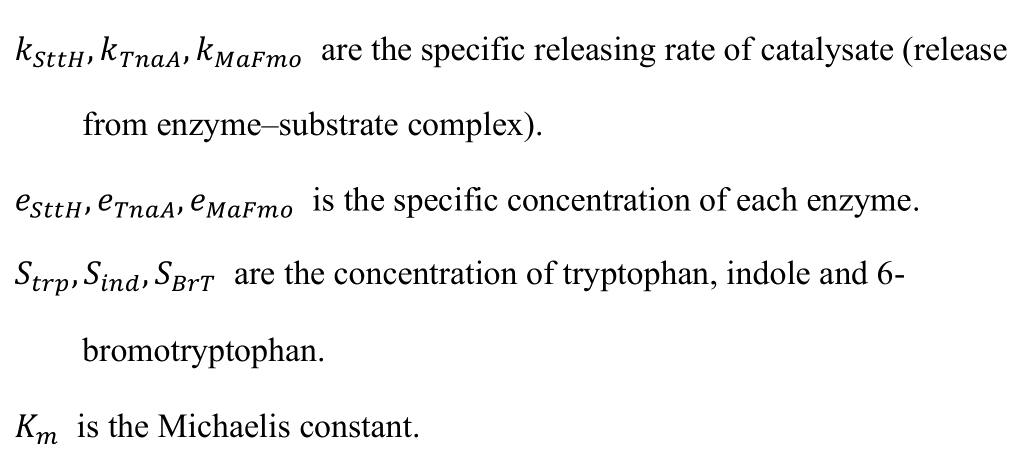
| kSttH | null | 6.5x10^-4 | Database[7] |
| KTnaA | null | 4.5x10^-3 | Database[8] |
| α | mmol/(L·s) | 2x10^-4 | Estimation[6] |
| Est | mM | 0.2 | Estimation[6] |
| Km | mM | 1.32 | Estimation[6] |
The relationship between product concentration and time is obtained by solving ODE equations.
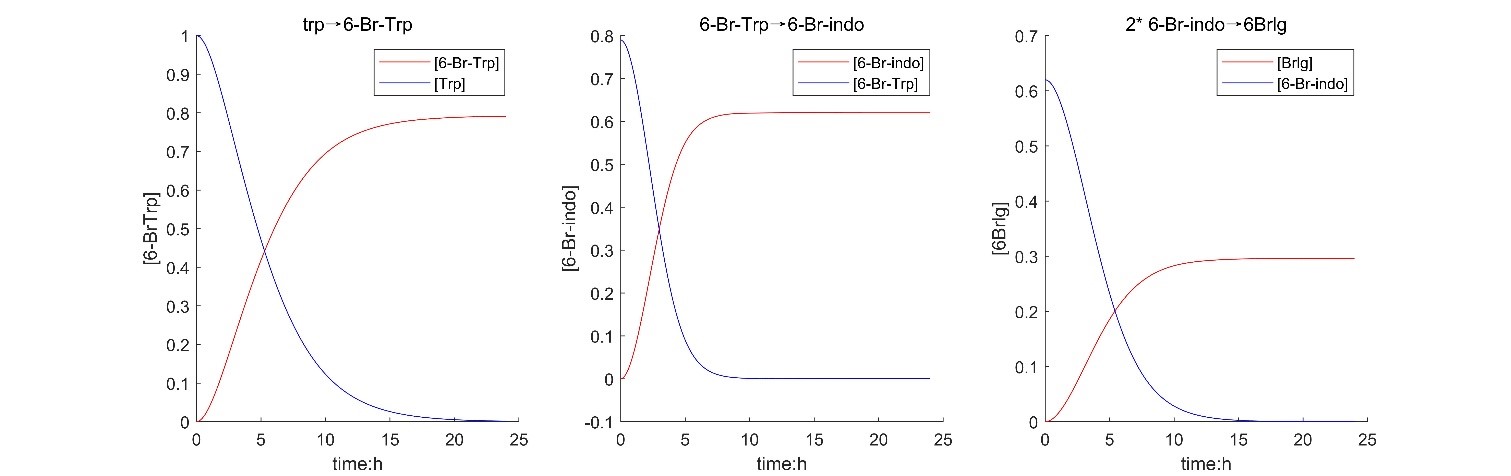
According to the results of solving the model, it shows that the design of the experiment is feasible, the yield is about 29.5%, and the final reaction takes about 9 hours.
In addition, according to the model, the relationship between substrate concentration and product concentration and the relationship between substrate concentration and reaction equilibrium time were obtained by changing the substrate concentration.
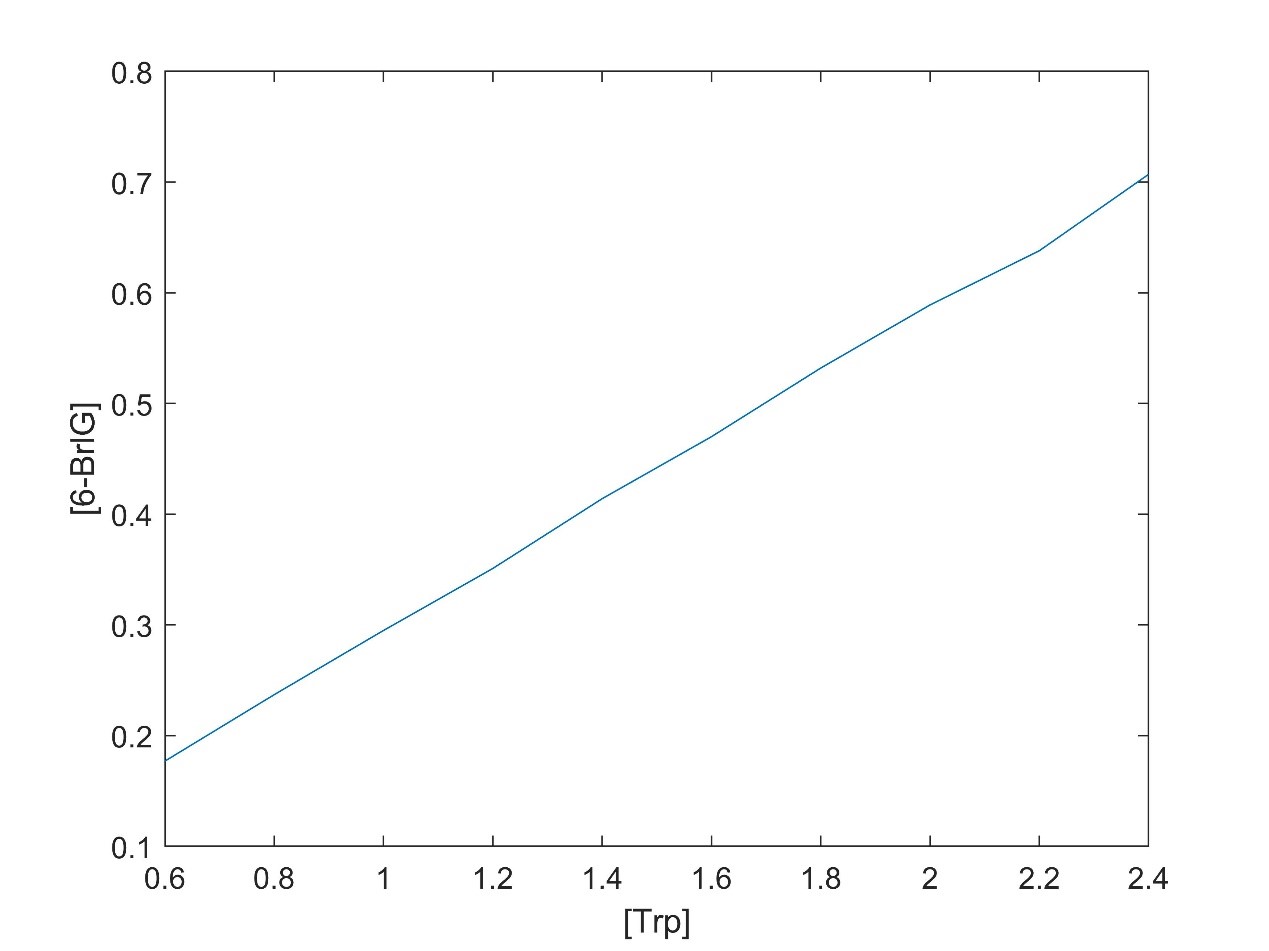
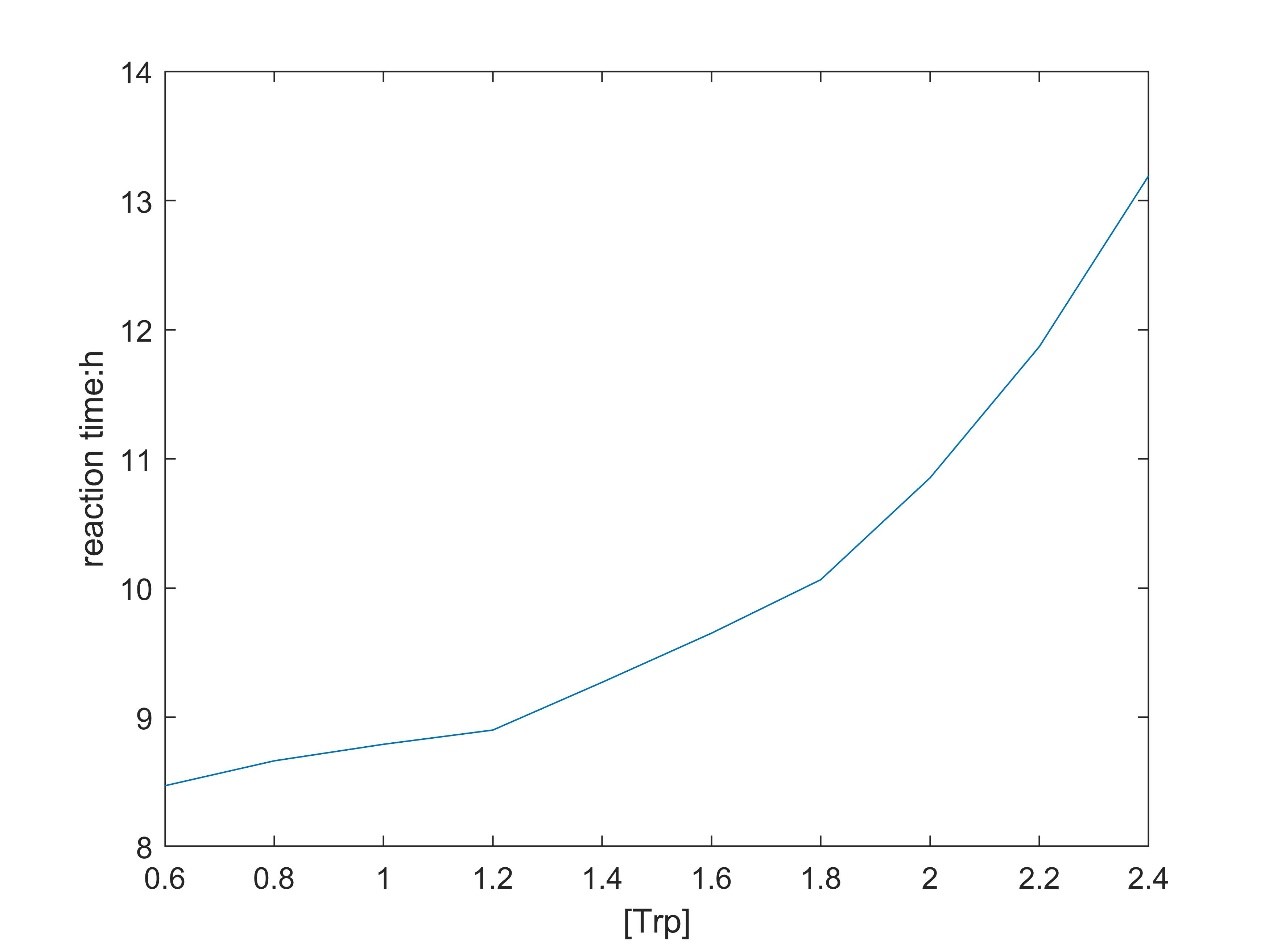
There is a linear relationship between substrate concentration and product concentration. The relationship between substrate concentration and reaction equilibrium time is exponential function.
Modeling the diffusion of the dye
The purpose of this model is to simulate the performance of the dye when we apply it on cloth or paper. The model is supposed to help us predict the pattern after the dye diffuses on the media and determine the approximate dyeing time. Then we can adjust the condition (e.g. the concentration) of the dye solution to obtain the pattern we want. It will serve the design of a dye device also.
The simulation can be divided into two parts:
· The dye is applied to the media in a way, and the characteristics of the media depend on the type we choose.
· After a period of diffusion we can get an image.
As the reference[5] we found, usually the simulation takes into account diffusion, surface tension, gravity, humidity, paper absorbency and the molecular weight of each pigment. There is no doubt that we must choose between these influencing factors. Even so, due to the extreme lack of relevant data support, it is difficult to further accurately solve the model after selecting the influential factors. Fortunately, when consulting the literature[5], we found a parameter, diffusion coefficient, which can better synthesize some influencing factors. The accuracy of the model based on it is within the range of our acceptance.
Assumption
· The fibers and the cavities can be represent by simple formulas.
· We pay more attention to the transverse diffusion of dyes, so the longitudinal diffusion of dyes is not considered in the study.
. Model of the cloth or paper
Vertical level

Horizontal level
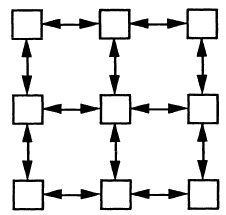
While when we draw a picture, we care more about the pattern, so to simplify the model, we just take diffusion on the horizontal level.
. Diffusion
The Fickerty's law:
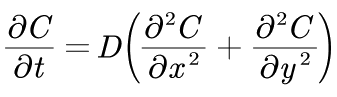
Where D is the diffusion coefficient. According to Einstein-Stokes law, the value of D can be determined.
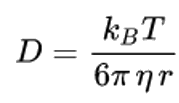
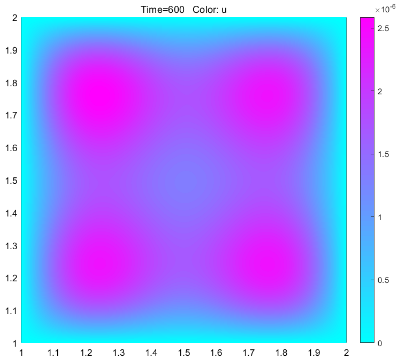
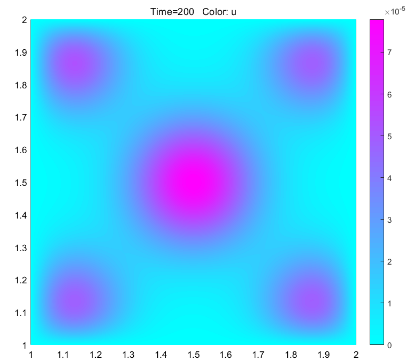
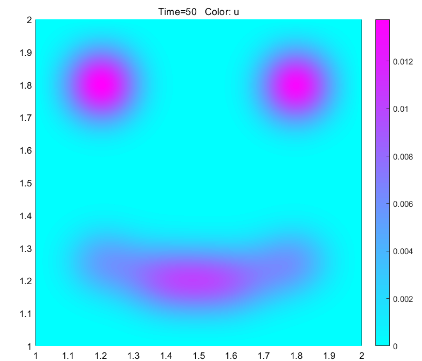
Where η is the viscosity between the media, r is the radius of the dye molecule, T is the absolute temperature, and kB is the Boltzmann constant. Through PDE Modeler provided by MATLAB to solve the model:


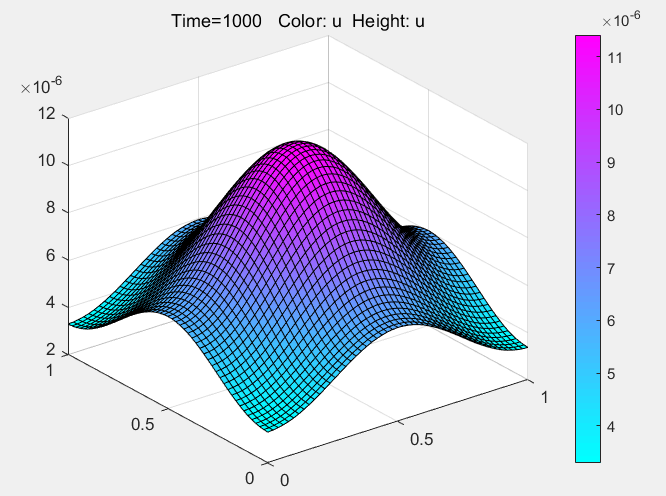
According to the results of the model, if the dye is to be fully diffused, the optimal dyeing time should be controlled at about 16 minutes. In the actual operation, we dye according to the guidance of the model, and get good results, which can prove that the model has a certain degree of rationality. At the same time, the model also provides a new creative idea for dyeing. By putting different concentrations of dyes in different areas, the pattern is predicted by the model, and the dyeing is artificially terminated at an appropriate time to get the target pattern.
References
[1] Koch, A. L. (1967). Kinetics of permease catalyzed transport. Journal of theoretical biology, 14(2), 103-130.
[2] Liu, Q., Cheng, Y., Xie, X., Xu, Q., & Chen, N. (2012). Modification of tryptophan transport system and its impact on production of L-tryptophan in Escherichia coli. Bioresource technology, 114, 549-554.
[3] Heatwole, V. M., & Somerville, R. L. (1991). Cloning, nucleotide sequence, and characterization of mtr, the structural gene for a tryptophan-specific permease of Escherichia coli K-12. Journal of bacteriology, 173(1), 108-115.
[4] Yanofsky, C. H. A. R. L. E. S., Horn, V. I. R. G. I. N. I. A., & Gollnick, P. A. U. L. (1991). Physiological studies of tryptophan transport and tryptophanase operon induction in Escherichia coli. Journal of bacteriology, 173(19), 6009-6017.
[5] Ren, Y., Tang, Y., Wu, Z., & Zhou, M. (2014). Ink Diffusion Simulation in Chinese Calligraphy Using NavierStokes Equation. In Simulations, Serious Games and Their Applications (pp. 15-29). Springer, Singapore.
[6] Lee Jeongchan et al. Production of Tyrian purple indigoid dye from tryptophan in Escherichia coli.[J]. Nature chemical biology, 2020, 17(1)
[7] Information on EC 4.1.99.1 – tryptophanase[DB]. BRENDA - Information on EC 4.1.99.1 - tryptophanase (brenda-enzymes.org).
[8] Information on EC 1.14.19.59 - tryptophan 6-halogenase[DB].BRENDA - Information on EC 1.14.19.59 - tryptophan 6-halogenase (brenda-enzymes.org).