Difference between revisions of "Team:NCTU Formosa/Proof Of Concept"
Yitzu Juan (Talk | contribs) |
Yitzu Juan (Talk | contribs) |
||
| Line 261: | Line 261: | ||
<div class="section s6"> | <div class="section s6"> | ||
<h1 class="topic" id="topic6">Efficiency Optimization Model</h1> | <h1 class="topic" id="topic6">Efficiency Optimization Model</h1> | ||
| − | <p | + | <p> |
| − |    | + |   Our Efficiency optimization model combines reinforcement learning and takes our prediction model as the environment to virtualize the interaction among our designed dental bone, P. gingivalis in dog mouth, and the reinforcement learning model.</P> |
| − | + | <p>  To investigate if the RL model shows better efficiency, we do a comparison with fixed time feeding. Figure 3.A shows the reward of the RL model and fixed time feeding with respect to time. From figure 3.A, we found that the model is capable of increasing the reward as the episode goes. Figure 3.B is the cumulative reward with respect to time of RL model and fixed time feeding. We are able to observe that as the episode goes, the optimization efficiency of the RL model is gradually greater.<br></p> | |
| − | + | <img class="images-sbs" src="https://static.igem.org/mediawiki/2021/a/a9/T--NCTU_Formosa--Reward.jpg" /> | |
| − | + | ||
| − | + | ||
| − | + | ||
| − | + | ||
| − | + | ||
| − | + | ||
| − | + | ||
| − | + | ||
| − | + | ||
| − | + | ||
| − | + | ||
| − | + | ||
| − | + | ||
| − | + | ||
| − | + | ||
| − | + | ||
| − | + | ||
| − | + | ||
| − | + | ||
| − | + | ||
| − | + | ||
| − | + | ||
| − | + | ||
| − | + | ||
| − | + | ||
| − | + | ||
| − | + | ||
| − | + | ||
| − | + | ||
| − | + | ||
| − | + | ||
| − | + | ||
| − | + | ||
| − | + | ||
| − | + | ||
| − | + | ||
| − | + | ||
| − | + | ||
| − | + | ||
| − | + | ||
| − | + | ||
| − | + | ||
| − | + | ||
| − | + | ||
| − | + | ||
| − | + | ||
| − | + | ||
| − | + | ||
| − | + | ||
| − | + | ||
| − | + | ||
| − | + | ||
| − | + | ||
| − | + | ||
| − | + | ||
| − | + | ||
| − | < | + | |
| − | + | ||
| − | + | ||
| − | + | ||
| − | + | ||
| − | + | ||
| − | + | ||
| − | + | ||
| − | + | ||
| − | + | ||
| − | < | + | <img class="images-sbs" src="https://static.igem.org/mediawiki/2021/8/8e/T--NCTU_Formosa--Cumulative_Reward1.jpg" /> |
| − | + | ||
| − | + | ||
| − | + | ||
| − | + | ||
<div class="explanation"><svg class="icon" aria-hidden="true" data-prefix="fas" data-icon="arrow-circle-up" | <div class="explanation"><svg class="icon" aria-hidden="true" data-prefix="fas" data-icon="arrow-circle-up" | ||
role="img" xmlns="http://www.w3.org/2000/svg" viewBox="0 0 512 512"> | role="img" xmlns="http://www.w3.org/2000/svg" viewBox="0 0 512 512"> | ||
| Line 342: | Line 272: | ||
d="M8 256C8 119 119 8 256 8s248 111 248 248-111 248-248 248S8 393 8 256zm143.6 28.9l72.4-75.5V392c0 13.3 10.7 24 24 24h16c13.3 0 24-10.7 24-24V209.4l72.4 75.5c9.3 9.7 24.8 9.9 34.3.4l10.9-11c9.4-9.4 9.4-24.6 0-33.9L273 107.7c-9.4-9.4-24.6-9.4-33.9 0L106.3 240.4c-9.4 9.4-9.4 24.6 0 33.9l10.9 11c9.6 9.5 25.1 9.3 34.4-.4z"> | d="M8 256C8 119 119 8 256 8s248 111 248 248-111 248-248 248S8 393 8 256zm143.6 28.9l72.4-75.5V392c0 13.3 10.7 24 24 24h16c13.3 0 24-10.7 24-24V209.4l72.4 75.5c9.3 9.7 24.8 9.9 34.3.4l10.9-11c9.4-9.4 9.4-24.6 0-33.9L273 107.7c-9.4-9.4-24.6-9.4-33.9 0L106.3 240.4c-9.4 9.4-9.4 24.6 0 33.9l10.9 11c9.6 9.5 25.1 9.3 34.4-.4z"> | ||
</path> | </path> | ||
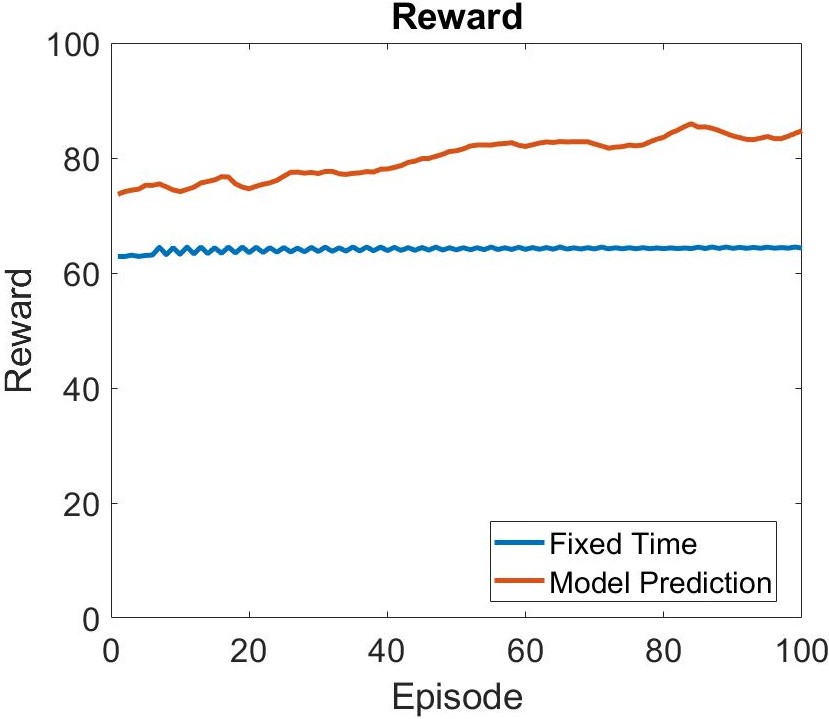
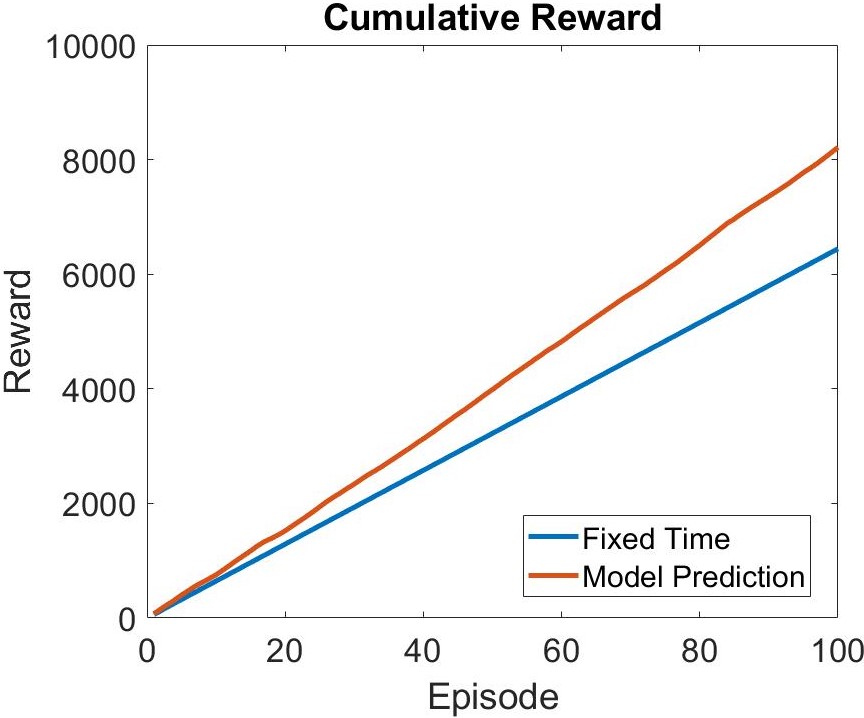
| − | </svg>Figure | + | </svg>Figure 3A (right), Reward of Fixed Time and Model Prediction. Figure 3B (left), Cumulative Reward of Fixed Time and Model Prediction</div> |
</div> | </div> | ||
| + | |||
<div class="section s7"> | <div class="section s7"> | ||
<h1 class="topic" id="topic7">DenTeeth-bone</h1> | <h1 class="topic" id="topic7">DenTeeth-bone</h1> | ||
Revision as of 23:11, 21 October 2021

Loading...


Introduction
Concept
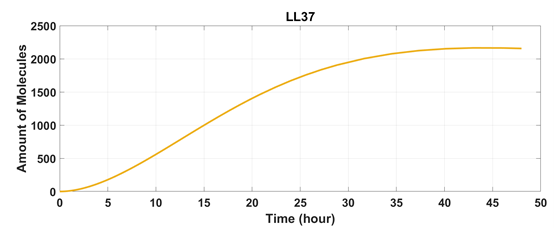
DenTeeth can produce antimicrobial peptides, LL-37 when the concentration of bacteria in the mouth is higher. After the growth of bacteria is inhibited, STATH and BMP2 will express, maintaining a high calcium level in saliva, and repairing soft tissues in the oral cavity. Therefore, oral problems, especially periodontal disease can be successfully prevented.
How do we prove it?
We proved our concept with a meticulous process which can be roughly divided into three parts: Model, Lab Work, and Device design. Combining modeling results and predictions with our lab work, we enable to make DenTeeth work as we imagined. We could further prove that DenTeeth can be implemented in the real world for daily usages.
Bacteria Growth Simulation with DenTeeth
Considered the previous growth model plus the killing formula of LL37. We constructed model to simulate the growth curve of E. coli and P.gingivalis with DenTeeth.
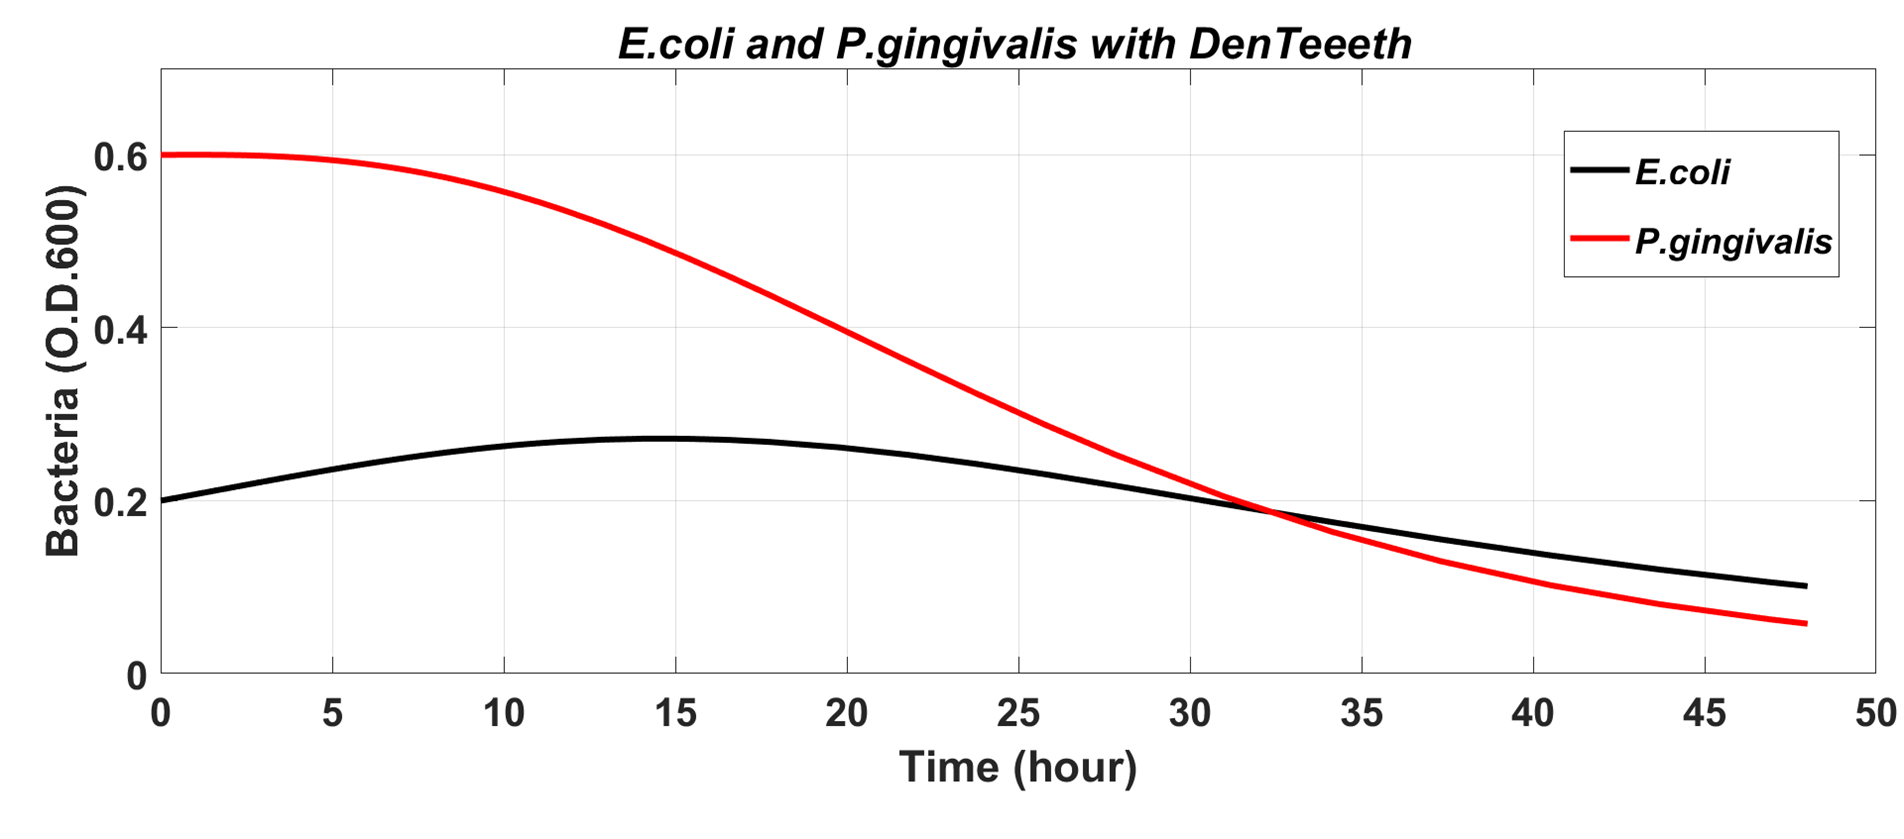
As we can see above, the concentration of P. gingivalis and E. coli are reduced. And finally they will achieve dynamic balance.
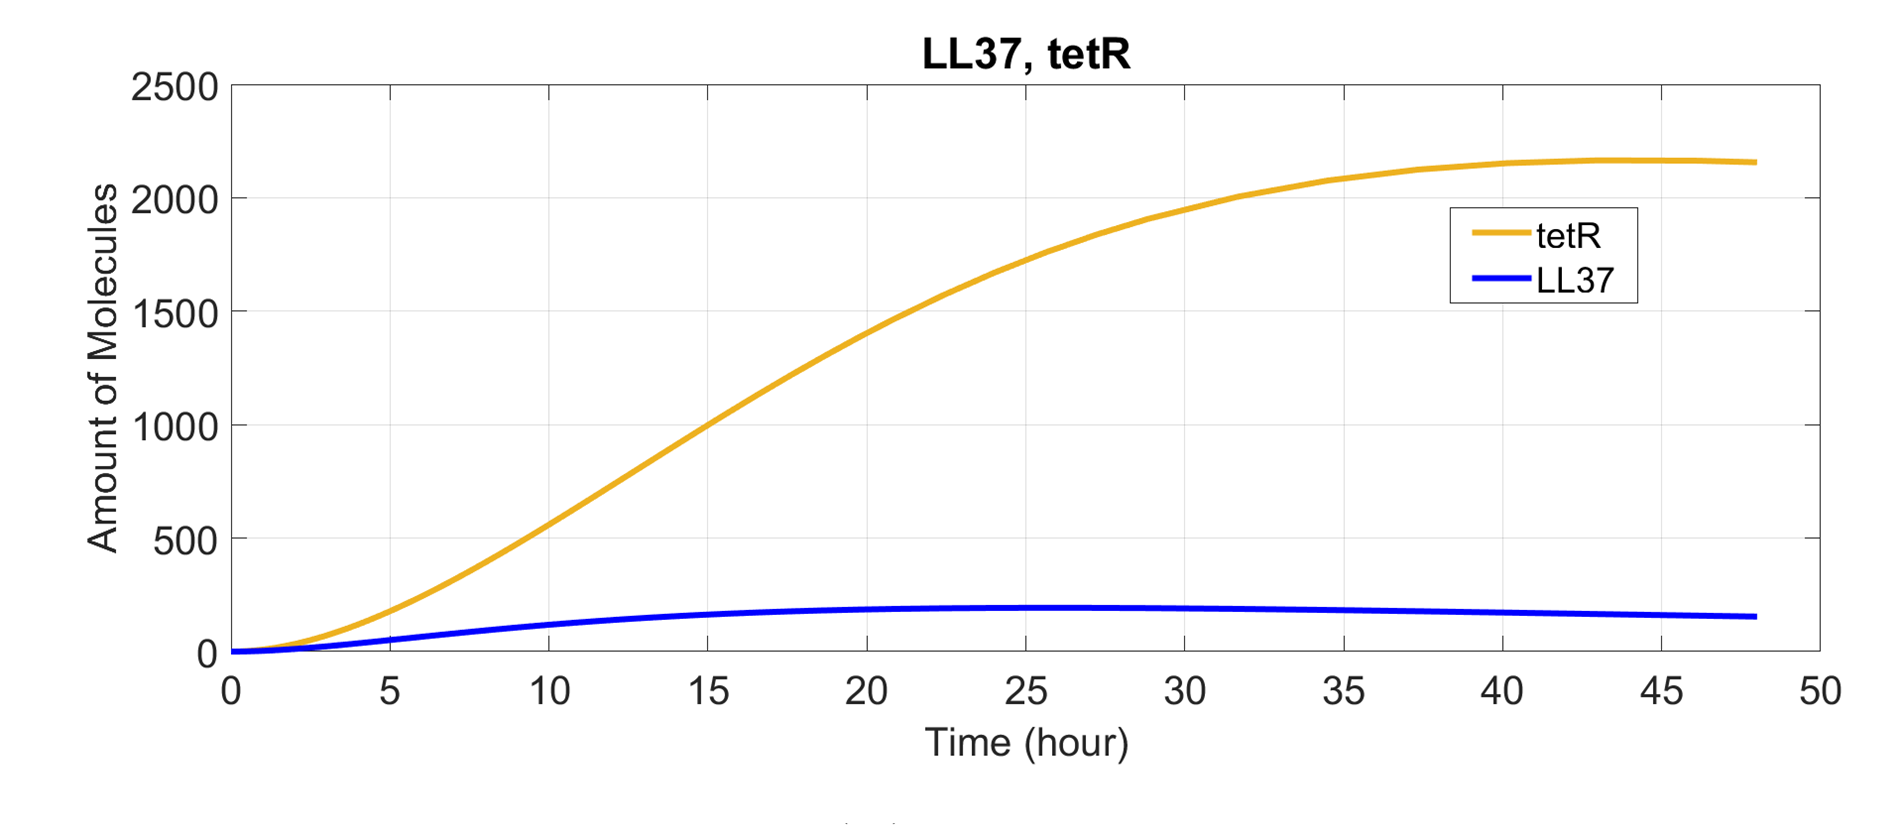
LL-37 tetR mRFP and BMP2 STATH GFP Production Simulation
Because E. coli itself would also be affected by LL37, in order to test whether this will further affect the concentration of the target product, we then used the analysis above to predict the concentration of these products over time.
The total amount of AHL was composed of the initial AHL from the quorum sensing model. The AHL-LuxR complex would activate the Plux promoter , which could lead to the production of LL37, tetR and mRFP.
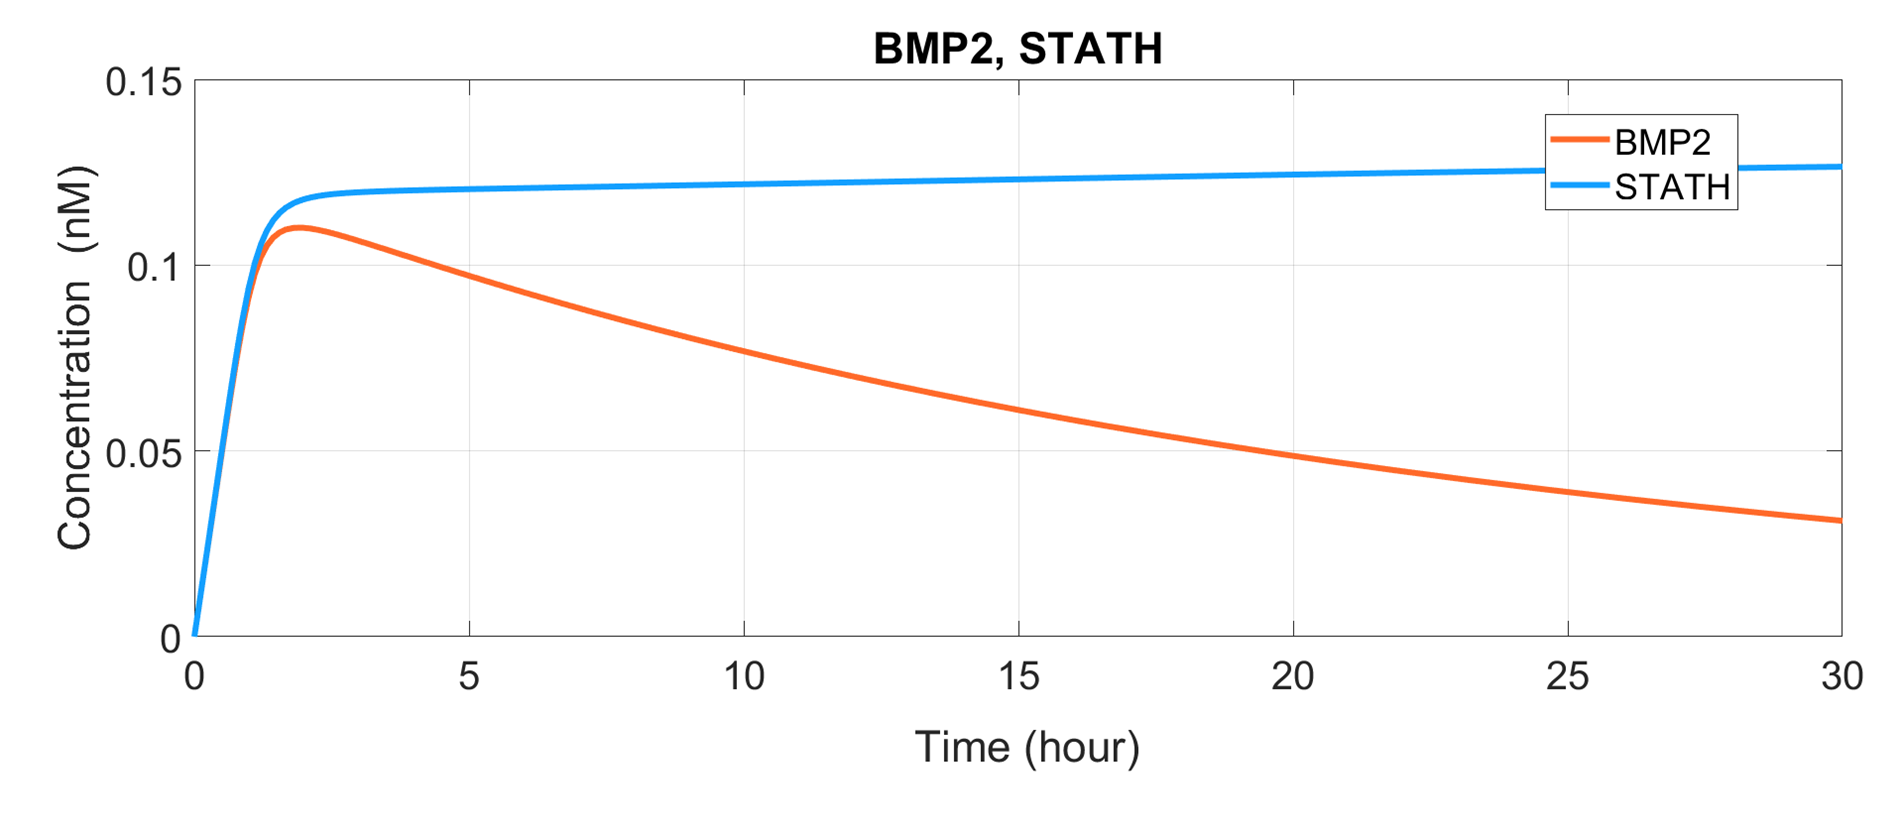
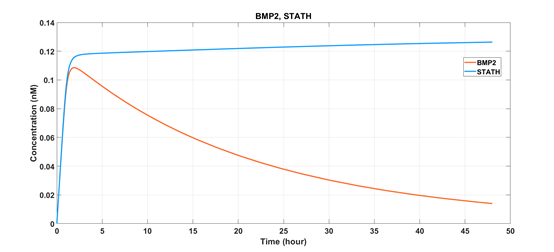
When the concentration of bacteria was low, DenTeeth would start to produce BMP2, STATH and GFP. Thus, we wanted to predict the production of these proteins. Considering the Quorum Sensing Model, we constructed the simulation of BMP2 and STATH.
In order to observe the switching between sterilization and restoration of DenTeeth, we added RFP after the sterilization sequence and GFP after the restoration sequence. Next, we simulated the relative fluorescence intensity of RFP and GFP to know the actual operation of DenTeeth. The result is shown in the figure below. :
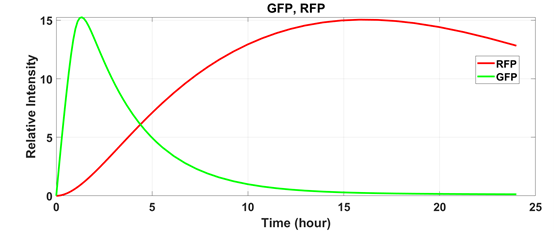
These models calculate and simulate the experiment result.
Model Validation
In order to ensure that our model’s predictions match the real situation, we used experimental data to fitting the model. After the experiment, we found that it was necessary to consider the dead E.coli because it influenced the O.D. value. The following picture(Fig.7) is the adjusted growth curve of E. coli.
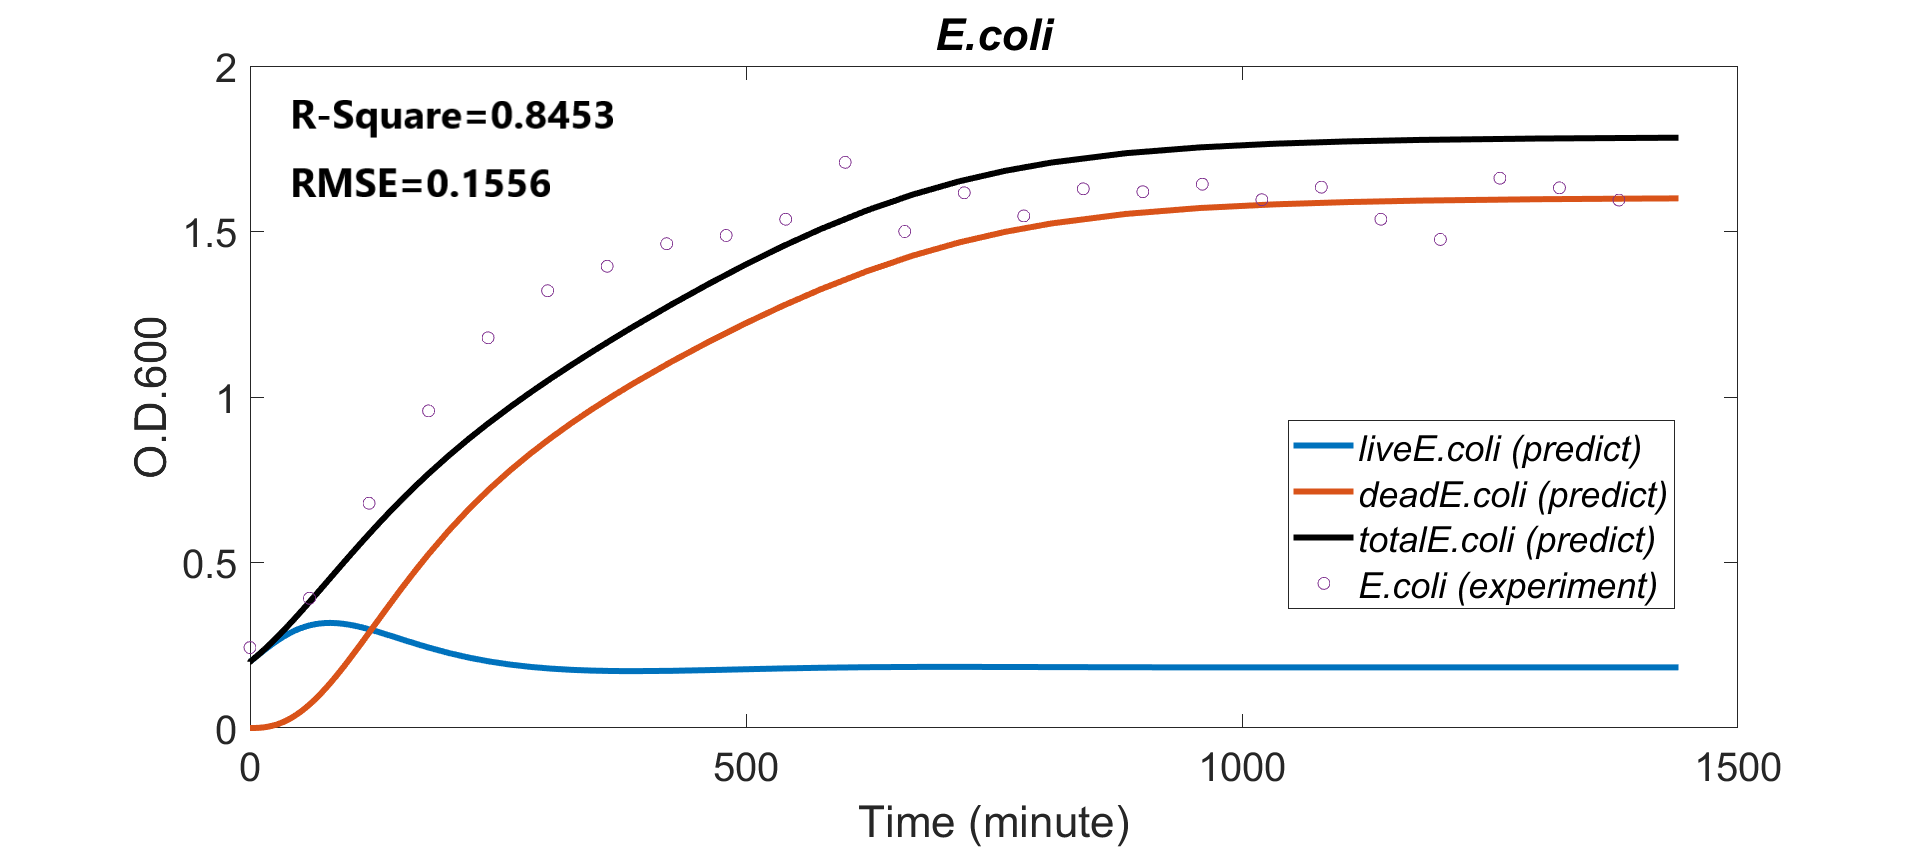
As you can see, the red line is the prediction growth curve of dead E. coli [deadE. coli(prediction)]. The blue line is the E. coli which is still alive [liveE. coli(prediction)]. And the black line is all the E. coli include living and dead, which is the prediction O.D. value [totalE. coli(predict)].
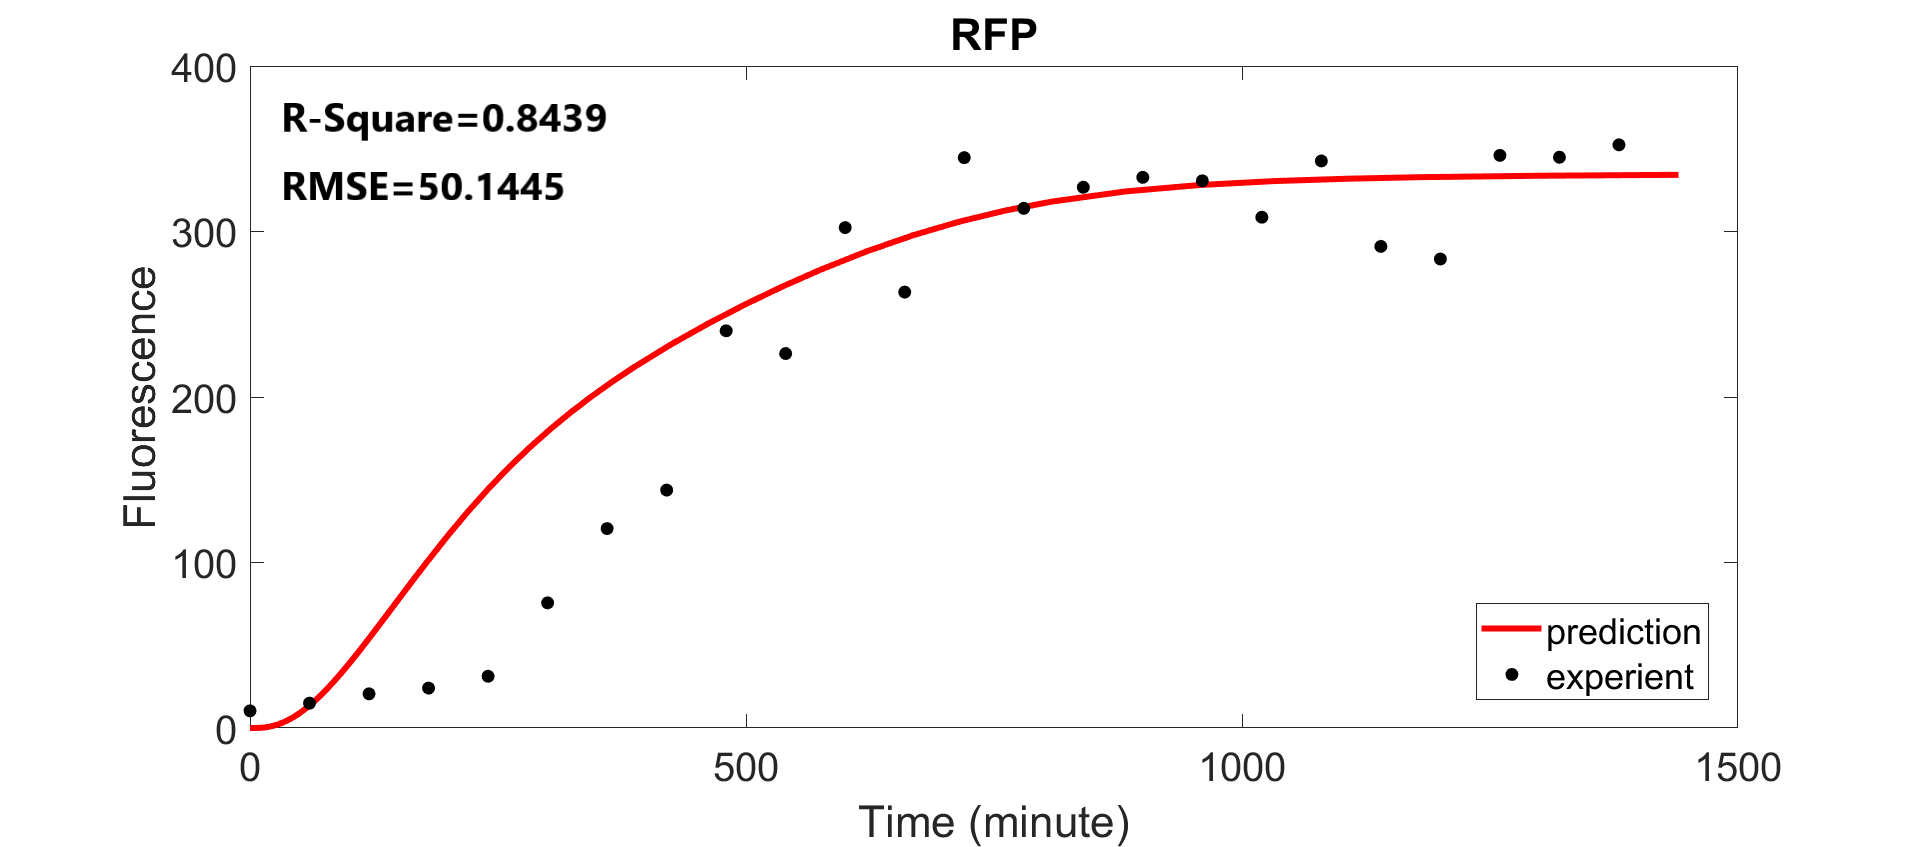
Next, we considered the expression of RFP and fit the model with experimental data as before. We found that the environment of the Erlenmeyer flask was different from the paper. The degradation of RFP was lower than expected. Thus, we lowered the degradation rate and verified it with the experimental results again. The following picture(Fig.8) is the result.
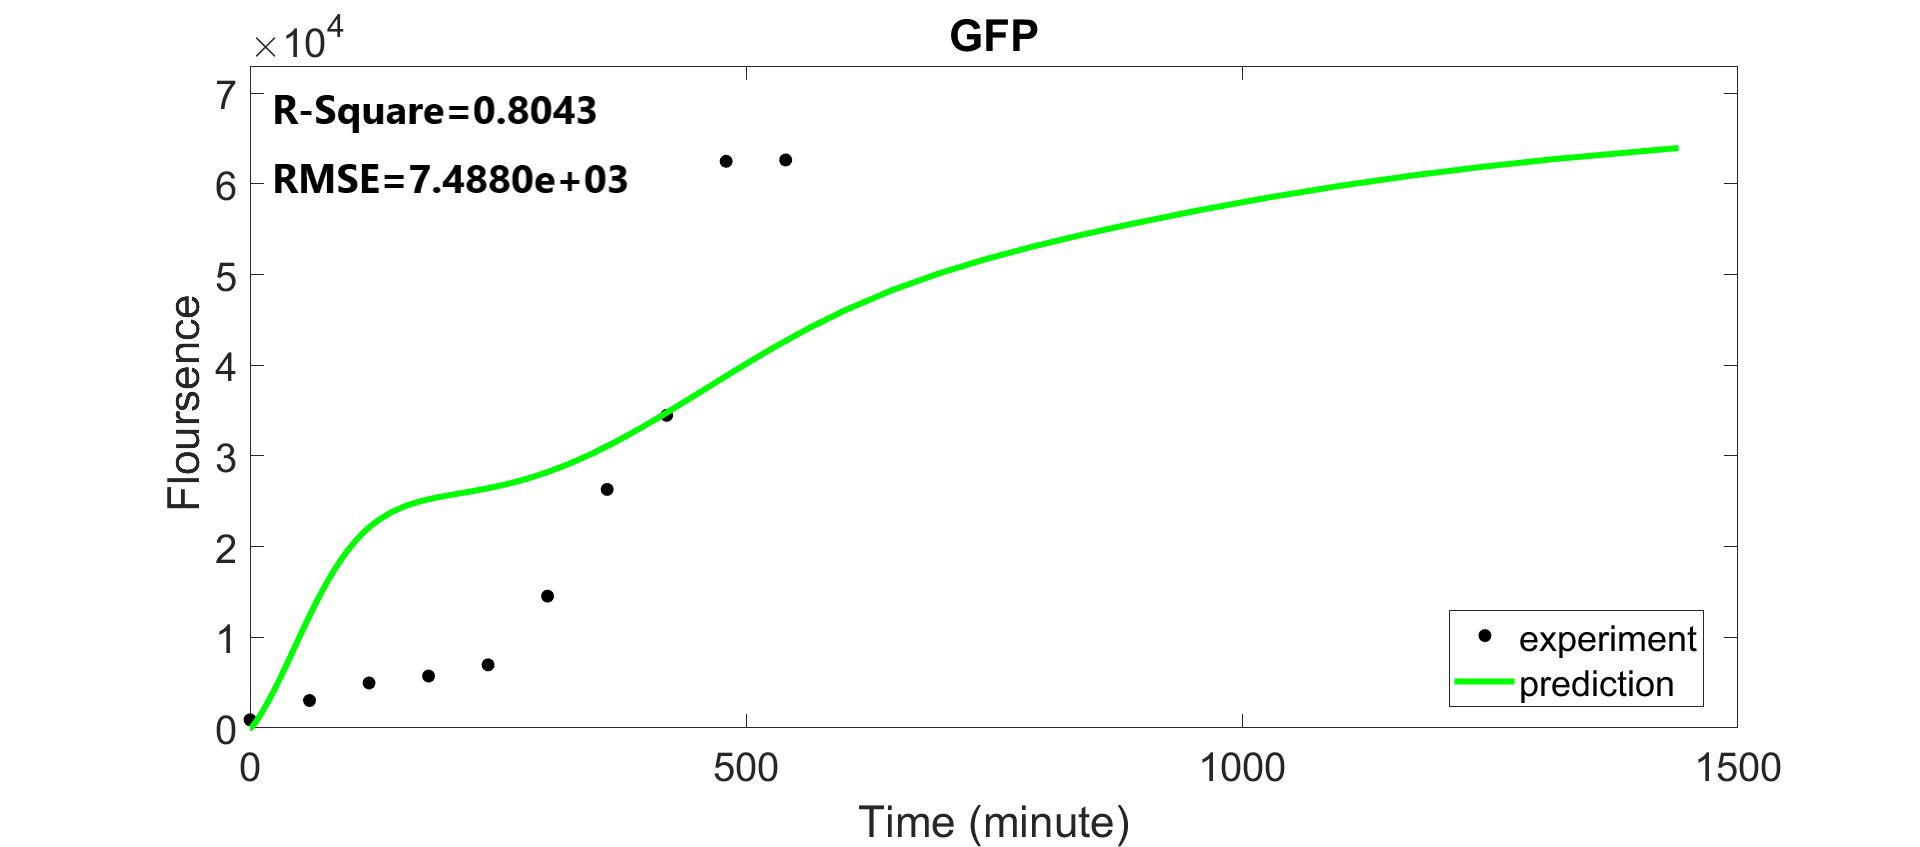
Then, we fit the data of GFP. We found that the expression of GFP exceeded expectations. So, we raised the translation rate of GFP and lowered the degradation rate. Although we did the same experiment for 24 hours, since the GFP expression had exceeded the detection range of the machine, the measured values were maintained at the maximum. Therefore, we only took the first 10 hours for validation. The result is shown below. (Fig.9)
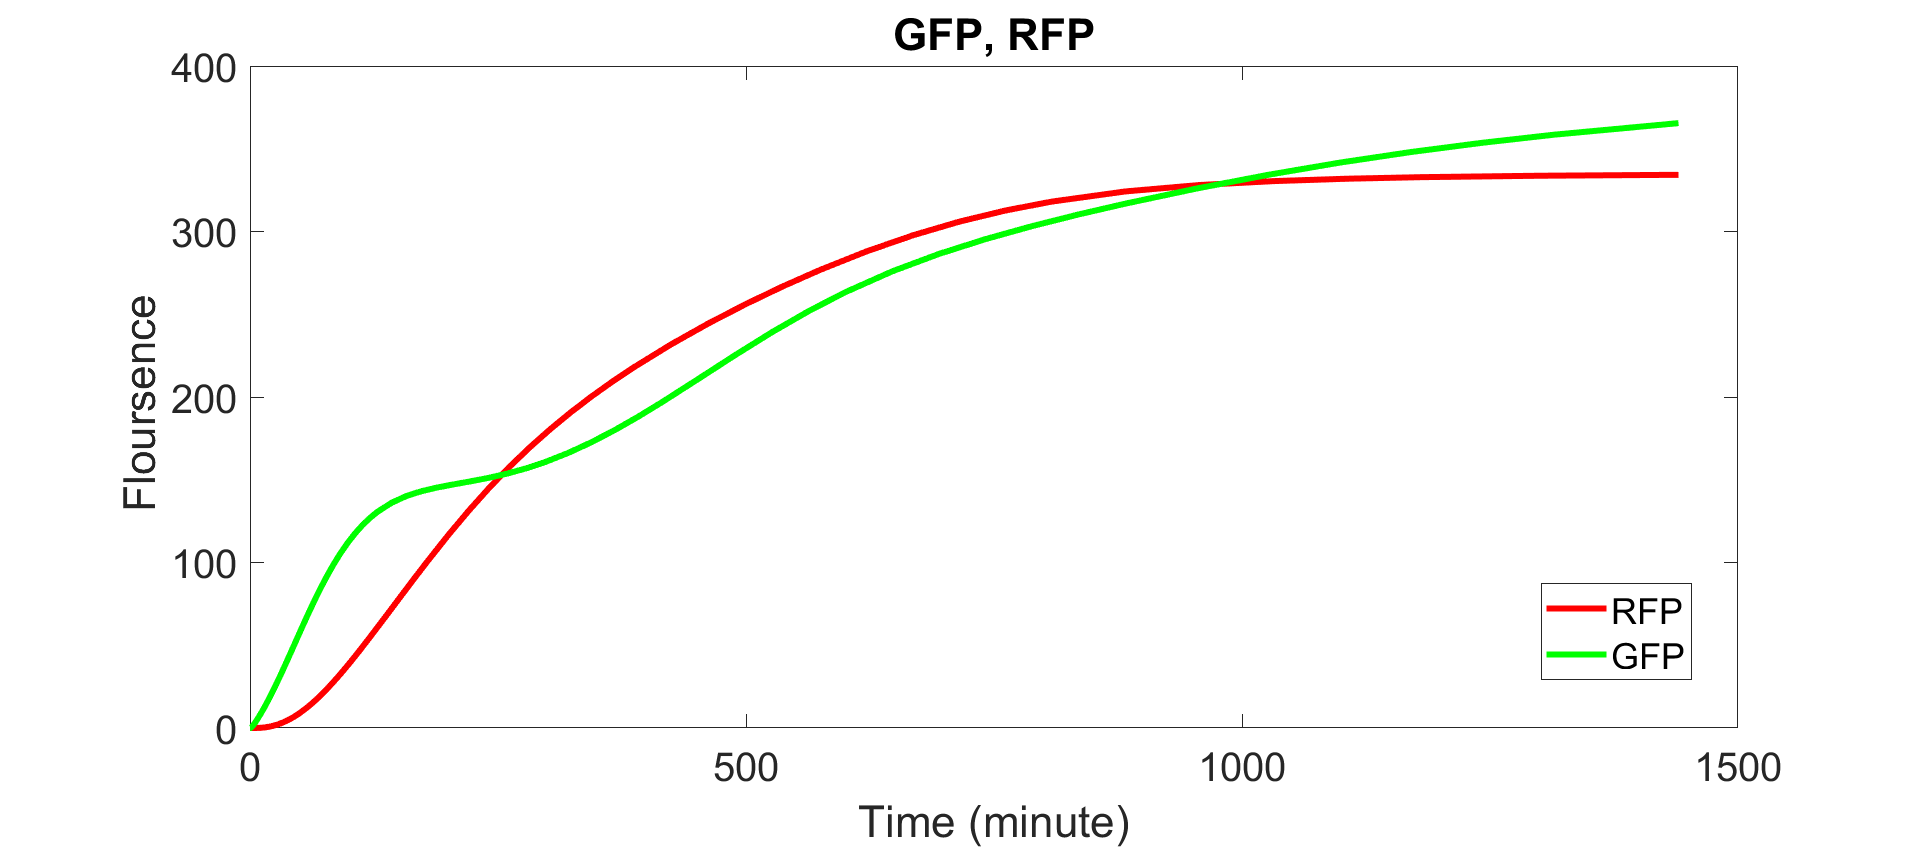
After the validation, we compared the expression of GFP and RFP. As you can see in the picture (Fig.10), because E. coli concentration was low at the beginning of the experiment, DenTeeth expressed GFP first. As E. coli continued to grow over time, it started to sterilize and the RFP was expressed. Then, the concentration of E. coli decreased due to the sterilization. DenTeeth turned to express GFP and started the restoration function. According to this experiment, we confirmed that the Quorum Sensing System of DenTeeth worked successfully.
After finishing the whole validation, we predicted the LL37, BMP2, and STATH expression again (Fig.11~Fig.12).
And we also predicted the new growth curve of E. coli and P.gingivalis with DenTeeth. As you can see in the picture (Fig.13), compared to the growth of P.gingivalis without DenTeeth (Fig.1), the final O.D. value of P.gingivalis decreased from 0.7 to 0.08, which showed that our DenTeeth could effectively kill 88% of the pathogenic bacteria in dogs' oral cavities.

DenTeeth can kill up to 88% of the pathogenic bacteria in dogs' oral cavities.
Protein Functional Test
LL-37 Functional Test
After finishing the design of DenTeeth, we wanted to know whether its inhibition ability can have a function, so we designed the following experiment. Our team decided to use the inhibition zone experiment to confirm that DenTeeth can inhibit other bacteria. Furthermore, we can also compare the difference of inhibition zone diameter to know the strength of inhibition intensity.


STATH Functional Test
After making STATH successfully translocated onto the inner membrane of our DenTeeth, we want to know whether the function of STATH works in our DenTeeth.
STATH can prevent the precipitation of calcium phosphate in saliva and maintain a high calcium level in saliva. Therefore, STATH is available for promoting the remineralization of tooth enamel and preventing calculus formation.
Calcium Attachment Test
To test whether the STATH expressed by DenTeeth had the function, we decided to detect the calcium ions concentration change with the STATH property of binding to the surface of hydroxyapatite (HA), preventing the calcium ion from attaching to HA. Due to HA being the main component of enamel in teeth, we want to use HA to simulate the oral condition. However, the calcium ion concentration change was too small to detect, and no vendor could provide us HA in time, resulting from the impact of Covid-19.
After the consultation with prof. Hsiao-Ching, Lee, we came up with a replacement plan, observing the attachment of calcium ions on the carbon rod surface. Carbon rods are processed to have small, low-volume pores that increase the surface area available for adsorption. We expected that both STATH and calcium could adsorb on the surface of carbon rods, so we designed a test to observe the surface of carbon rods soaked in different solutions under the microscope.
We made four solutions configured to calcium ions saturated solutions by the calcium chloride solution, ddH2O, LB broth, DenTeeth, and E. coli with pSB1K3, in the tubes with the carbon rods stuck inside. After putting them into a 0°C refrigerator for 12 hours, the solutions would become calcium ions supersaturated solutions. In DenTeeth, STATH would bind onto the surface of the carbon rod, preventing the calcium ions from binding onto it.
As for the precipitation on the bottom of tubes was the debris of bacteria, which was died of the broken cell membrane caused by the high concentration of calcium chloride solution.

The result in the following figure showed that the surface of the carbon rod taken out of the DenTeeth was matte compared with that in other solutions. We presumed that the result was due to the protective layer on the surface formed by the STATH that would prevent the liquid from attachment.

We can see the different conditions of calcium attachment on carbon rods after soaking in different calcium ions saturated solutions overnight in Figure 8.
Picture A in figure 8 is the original carbon rod. We can observe many layer-like structures on its surface clearly. Since the original carbon rod hadn't soaked in any solution, no crystal of calcium can be seen on its surface. However, without soaking in any solution, there is some little dust smaller than crystal particles on its surface.
Picture B is the original carbon rod soaked in calcium ions saturated ddH2O. Obvious white particles can be observed on its surface. We presume the particles might be the crystal of calcium.
Picture C is the carbon rod soaked in calcium ions saturated LB Broth. There is a relatively big particle on the surface, in our opinion, is formed by calcium crystals.
The carbon rod soaked in calcium ions saturated E. coli DenTeeth is shown in Picture D. With STATH functioning, there are no particles be seen on the surface of the carbon rod and the surface remains clear. Besides, the surface of it is even cleaner than the original carbon rod. We suppose that is because this rod has been soaked in the solution, which will bring away the dust on its surface.
Carbon rod soaked in calcium ions saturated E. coli BL21(DE3) with pET32a. We chose this colony as one of our control groups since it has the same Kanamycin resistance as DenTeeth. There are many particles on its surface, which might be composed of calcium crystals.

Efficiency Optimization Model
Our Efficiency optimization model combines reinforcement learning and takes our prediction model as the environment to virtualize the interaction among our designed dental bone, P. gingivalis in dog mouth, and the reinforcement learning model.
To investigate if the RL model shows better efficiency, we do a comparison with fixed time feeding. Figure 3.A shows the reward of the RL model and fixed time feeding with respect to time. From figure 3.A, we found that the model is capable of increasing the reward as the episode goes. Figure 3.B is the cumulative reward with respect to time of RL model and fixed time feeding. We are able to observe that as the episode goes, the optimization efficiency of the RL model is gradually greater.
DenTeeth-bone
Concept
DenTeeth can produce antimicrobial peptides, LL-37 when the concentration of bacteria in the mouth is higher. After the growth of bacteria is inhibited, STATH and BMP2 will express, maintaining a high calcium level in saliva, and repairing soft tissues in the oral cavity. Therefore, oral problems, especially periodontal disease can be successfully prevented.
How do we prove it?
We proved our concept with a meticulous process which can be roughly divided into three parts: Model, Lab Work, and Device design. Combining modeling results and predictions with our lab work, we enable to make DenTeeth work as we imagined. We could further prove that DenTeeth can be implemented in the real world for daily usages.
Reference
- Schink, S. J., et al. (2019). "Death rate of E. coli during starvation is set by maintenance cost and biomass recycling." 9(1): 64-73. e63.