Team:NCTU Formosa/Results

Loading...


Overview
To incorporate quorum sensing, dental pathogen inhibition, and dental restoration into E. coli, we first built up the gene constructs and expressed red and green fluorescent proteins to ensure the genes were successfully expressed and tested their functions to prove that the proteins secreted by DenTeeth worked. Finally, we designed an experiment to warrant the biosafety of DenTeeth.
Mechanism introduction

LuxR protein will induce Plux promoter in inhibition sequence when the environment temperature is over 37 degrees Celcius and the total bacteria number in the environment is high. After the Plux promoter in inhibition sequence was induced, LL-37 antimicrobial peptides, tetR protein, and RFP would express.
On the other hand, when the total bacteria number in the environment is low, without the inhibition of tetR, Ptet promoter in restoration sequence would be induced and express BMP2, STATH, and GFP.
Gene Construct
We incorporated quorum sensing sequence, inhibition sequence, and restoration sequence into E. coli BL21(DE3). We did colony PCR and digest to check its genotype.

Protein Expression

Figure 3. compared fluorescent protein expression in different liquid culturing colonies.
The A eppendorf contained the colony with the quorum sensing sequence. Without fluorescent protein expression, this eppendorf could not observe any fluorescent.
The B eppendorf contained the colony with the quorum sensing sequence and the restoration sequence. Since the restoration sequence had GFP, we could observe a magnificent amount of green fluorescent.
The C Eppendorf contained the colony with the quorum sensing sequence, the restoration sequence, and the inhibition sequence. Due to the inhibition effect between the restoration sequence and the inhibition sequence, less green fluorescent could be observed in this Eppendorf.

We designed an experiment to measure the intensity of green fluorescent protein (GFP). This experiment lasted for 24 hours, and we measured the data every hour, as shown in Figure 4. These data show that GFP can be gradually expressed by DenTeeth. In other words, restoration sequence can also be expressed.

We also designed an experiment to measure the intensity of red fluorescent protein (RFP). This experiment lasted for 24 hours, and we measured the data every hour, as shown in Figure 5. These data show that RFP can be gradually expressed by DenTeeth. In other words, inhibition sequence can also be expressed, and the regulation of three sequences can be successfully expressed.
Functional Test
LL-37 Functional Test
After finishing the design of DenTeeth, we wanted to know whether its inhibition ability can have a function, so we designed the following experiment. Our team decided to use the inhibition zone experiment to confirm that DenTeeth can inhibit other bacteria. Furthermore, we can also compare the difference of inhibition zone diameter to know the strength of inhibition intensity.
First, we spread E. coli (DH5α) with pET32a in LB plates with AMP resistance to be our inhibition target. Second, sticking up the filter paper, we dropped the following materials on the filter paper. Finally, we placed LB plates at 37 Celsius degrees for 12 hours.
In figure 6, there were ten different materials added to LB plates. Plate A was added with hydrogen peroxide as the positive control group. We could see that Plate A only grew bacteria near the edge. Plates B and C were E. coli (BL21) with pSB1K3 and DenTeeth, respectively. In these two plates, both of which contained K resistance. With other factors unchanged, Plate B was negative control. As we could see, our DenTeeth had an inhibitory effect. In plate D and plate E, were cell lysate of E. coli (BL21) with pSB1K3 and DenTeeth, respectively. In these two plates, both of which contained K resistance. With other factors unchanged, Plate D was negative control. As we could see, the cell lysate of DenTeeth had an inhibitory effect. According to the results of plate A to plate E, we could know whether it was a live DenTeeth or a cell lysate, both of which had the function of inhibiting bacteria.
In plates F, G and H, were added with PBS, E. coli (BL21) with pSB1K3 + PBS and DenTeeth + PBS, respectively. To ensure PBS would not influence the inhibition results significantly, we decided to make three plates containing PBS because it would be used on cell lysis. In these three plates, we could observe that only plate H (DenTeeth + PBS) had an inhibitory effect. This result allowed us to know that PBS would not have an obvious influence on our experiment, and could know that DenTeeth still had an inhibitory effect.
In plates I and J, were the LB broth after centrifugation from E. coli (BL21) with pSB1K3 and centrifugation from DenTeeth, respectively. With other factors fixed, we could observe that plate J had an inhibitory effect. This result allowed us to know that antimicrobial peptide LL-37 could be secreted from DenTeeth to the environment.

We repeated the DenTeeth inhibition functional test three times each. In figure 7, this bar graph indicates the three times average of inhibition zone diameters in different materials added to LB plates. This result shows that DenTeeth can secrete LL-37 to inhibit other bacteria.

STATH Functional Test
After making STATH successfully translocated onto the inner membrane of our DenTeeth, we want to know whether the function of STATH works in our DenTeeth.
STATH can prevent the precipitation of calcium phosphate in saliva and maintain a high calcium level in saliva. Therefore, STATH is available for promoting the remineralization of tooth enamel and preventing calculus formation.
Calcium Attachment Test
To test whether the STATH expressed by DenTeeth had the function, we decided to detect the calcium ions concentration change with the STATH property of binding to the surface of hydroxyapatite (HA), preventing the calcium ion from attaching to HA. Due to HA being the main component of enamel in teeth, we want to use HA to simulate the oral condition. However, the calcium ion concentration change was too small to detect, and no vendor could provide us HA in time, resulting from the impact of Covid-19.
After the consultation with prof. Hsiao-Ching, Lee, we came up with a replacement plan, observing the attachment of calcium ions on the carbon rod surface. Carbon rods are processed to have small, low-volume pores that increase the surface area available for adsorption. We expected that both STATH and calcium could adsorb on the surface of carbon rods, so we designed a test to observe the surface of carbon rods soaked in different solutions under the microscope.
We made four solutions configured to calcium ions saturated solutions by the calcium chloride solution, ddH2O, LB broth, DenTeeth, and E. coli with pSB1K3, in the tubes with the carbon rods stuck inside. After putting them into a 0°C refrigerator for 12 hours, the solutions would become calcium ions supersaturated solutions. In DenTeeth, STATH would bind onto the surface of the carbon rod, preventing the calcium ions from binding onto it.
The precipitation on the bottom of tubes was expected to be the debris of bacteria, died of cell lysis due to the high concentration of calcium chloride.

The result in the following figure showed that the surface of the carbon rod taken out of the DenTeeth was matte compared with that in other solutions. We presumed that the result was due to the protective layer on the surface formed by the STATH that would prevent the liquid from attachment.

We could see the different conditions of calcium attachment on carbon rods after soaking in other calcium ions saturated solutions overnight in Figure 10.
Picture A in figure 10 is the original carbon rod. We could observe many layer-like structures on its surface. Since the original carbon rod hadn't soaked in any solution, no calcium crystal could be seen on its surface. However, without soaking in any solution, some little dust was smaller than crystal particles on its surface.
Picture B was the original carbon rod soaked in calcium ions saturated ddH2O. Obvious white particles could be observed on its surface. We presumed the particles might be the crystal of calcium.
Picture C was the carbon rod soaked in calcium ions saturated LB Broth. There was a relatively big particle on the surface, in our opinion, was formed by calcium crystals.
The carbon rod soaked in calcium ions saturated E. coli DenTeeth was shown in Picture D. With STATH functioning, there were no particles be seen on the surface of the carbon rod, and the surface remained clear. Besides, the surface of it was even cleaner than the original carbon rod. We supposed that was because this rod had been soaked in the solution, which would bring away the dust on its surface.
Carbon rod soaked in calcium ions saturated E. coli BL21(DE3) with pET32a. We chose this colony as one of our control groups since it has the same Kanamycin resistance as DenTeeth. There are many particles on its surface, which might be composed of calcium crystals.

Feeding Frequency Validation

In order to validate the efficiency optimization model usable in any environment, we use E. coli with pSB1K3, hydrogen peroxide, and glucose to simulate as P. gingivalis, feeding dental bones and eating foods. As a result of the different environments of the experiment and the dog's mouse. We modified the environment reaction function to meet requirements.
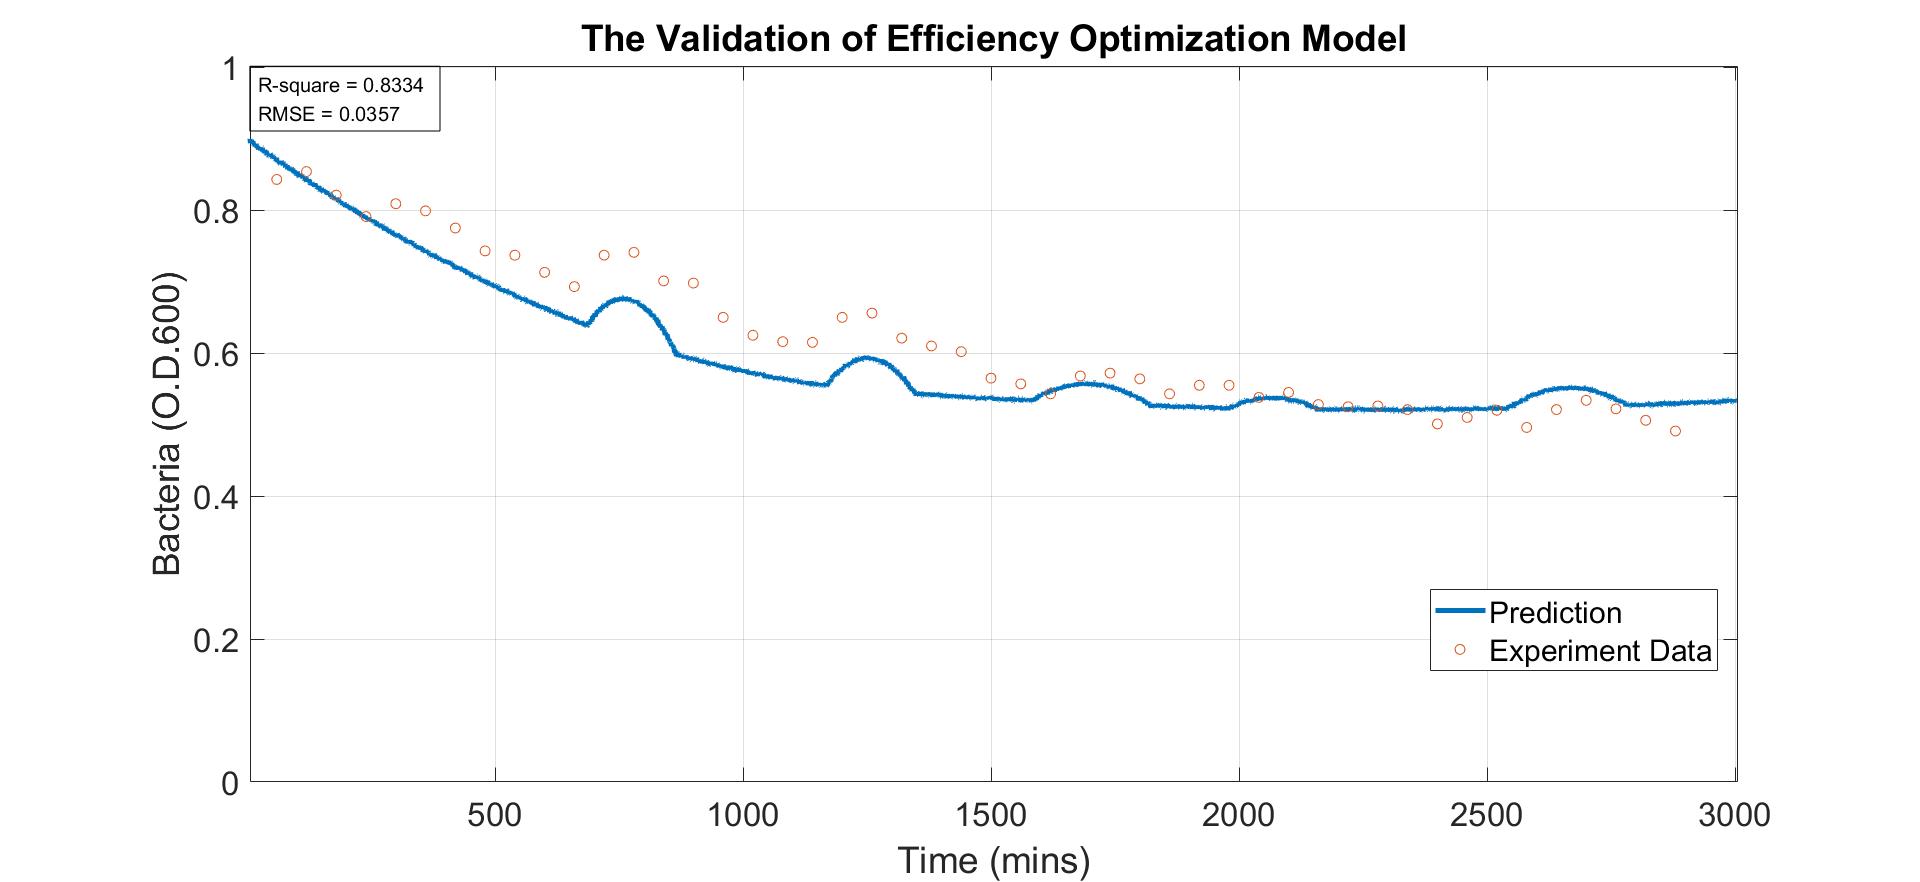
The above figure shows that the prediction value is very close to the experimental data, and the prediction is very accurate and precise by observing the R-square and RMSE.
After validating the accuracy and precision of the model, we further compare the reward of two dental bone feeding policies. Policy 1 (control group) is feeding dental bone with a fixed time interval. Policy 2 (experimental group) is feeding dental bone with RL prediction results.

Through calculating the reward of policy 1 and policy 2 by reward function, we can claim the reward of policy 2 is statistically higher than policy 1. Simply speaking, through the validation experiment, we successfully proved the optimization ability of this model.
Safety
To prove that DenTeeth can be inhibited by gastric acid, we conducted an Inhibition of Growth of DenTeeth Test. Because the HCl concentration of the animal's gastric acid ranged from 0.15M to 0.05M, we added 200μL HCl(aq) from 0.3M to 0.1M with equal DenTeeth and observed whether the DenTeeth in different concentrations of HCl(aq) would be inhibited. In addition, we chose ddH2O and HClO(aq) as our negative control and positive control, respectively.

The DenTeeth's biobrick could successfully degrade in any range from 0.1M to 0.3M HCl(aq). Only the sample added with ddH2O has the band in 4685 b.p., which was the length of our biobrick. The cloning result proved that the biobrick could not have the chance to transfer to another bacteria.

Reference
- Schink, S. J., et al. (2019). "Death rate of E. coli during starvation is set by maintenance cost and biomass recycling." 9(1): 64-73. e63.