Difference between revisions of "Team:NCKU Tainan/Hardware"
Minghan1005 (Talk | contribs) |
|||
| Line 47: | Line 47: | ||
| − | + | <section> | |
| + | <h2>Overview</h2> | ||
| + | <ol> | ||
| + | <li><p>Construct each part and test the function of TAL, <i>tyrP</i>, <i><i>pchR</i></i> and bacteriocin.</p></li> | ||
| + | <li><p>Using spot-on-lawn assay to test the bacteriocin bactericidal activity.</p></li> | ||
| + | <li><p>Use the previously developed method (<a href="https://2019.igem.org/Team:NCKU_Tainan/Protocols" target="_blank">see Protocols</a>) to measure the <i>p</i>-Coumaric acid production of TAL.</p></li> | ||
| + | <li><p>Knockout <i>dapA</i> and <i>can</i> gene and phenotype check.</p></li> | ||
| + | <li><p>Characterize the anaerobic sensing promoter <i>P<sub>fnr</sub></i> (<a href="http://parts.igem.org/Part:BBa_K1123000" target="_blank">BBa_K1123000</a>) and improve TAL with native RBS Biobrick (<a href="http://parts.igem.org/Part:BBa_I742148" target="_blank">BBa_I742148</a>)</p></li> | ||
| + | </ol> | ||
| + | </section> | ||
| + | <hr> | ||
<section> | <section> | ||
Revision as of 06:57, 17 October 2021

Overview
Construct each part and test the function of TAL, tyrP, pchR and bacteriocin.
Using spot-on-lawn assay to test the bacteriocin bactericidal activity.
Use the previously developed method (see Protocols) to measure the p-Coumaric acid production of TAL.
Knockout dapA and can gene and phenotype check.
Characterize the anaerobic sensing promoter Pfnr (BBa_K1123000) and improve TAL with native RBS Biobrick (BBa_I742148)
Background
Chronic stress has been identified as a significant factor in causing depression[1]. Using our engineered E. coli Nissle, MenTAUR provided a solution to suppress Chronic stress-induced depression by producing Taurine, an amino acid believed to suppress depression symptoms. Currently, most of the research that has already proven the efficacy of Taurine is only implemented in mouse experiments[2].. Based on these results, we built a microfluidic chip to simulate: what will happen to our engineered E. coli Nissle when they reach the jejunum. Therefore, in this opportunity, iGEM NCKU Tainan 2021 had come up with f(int).
Device Overview
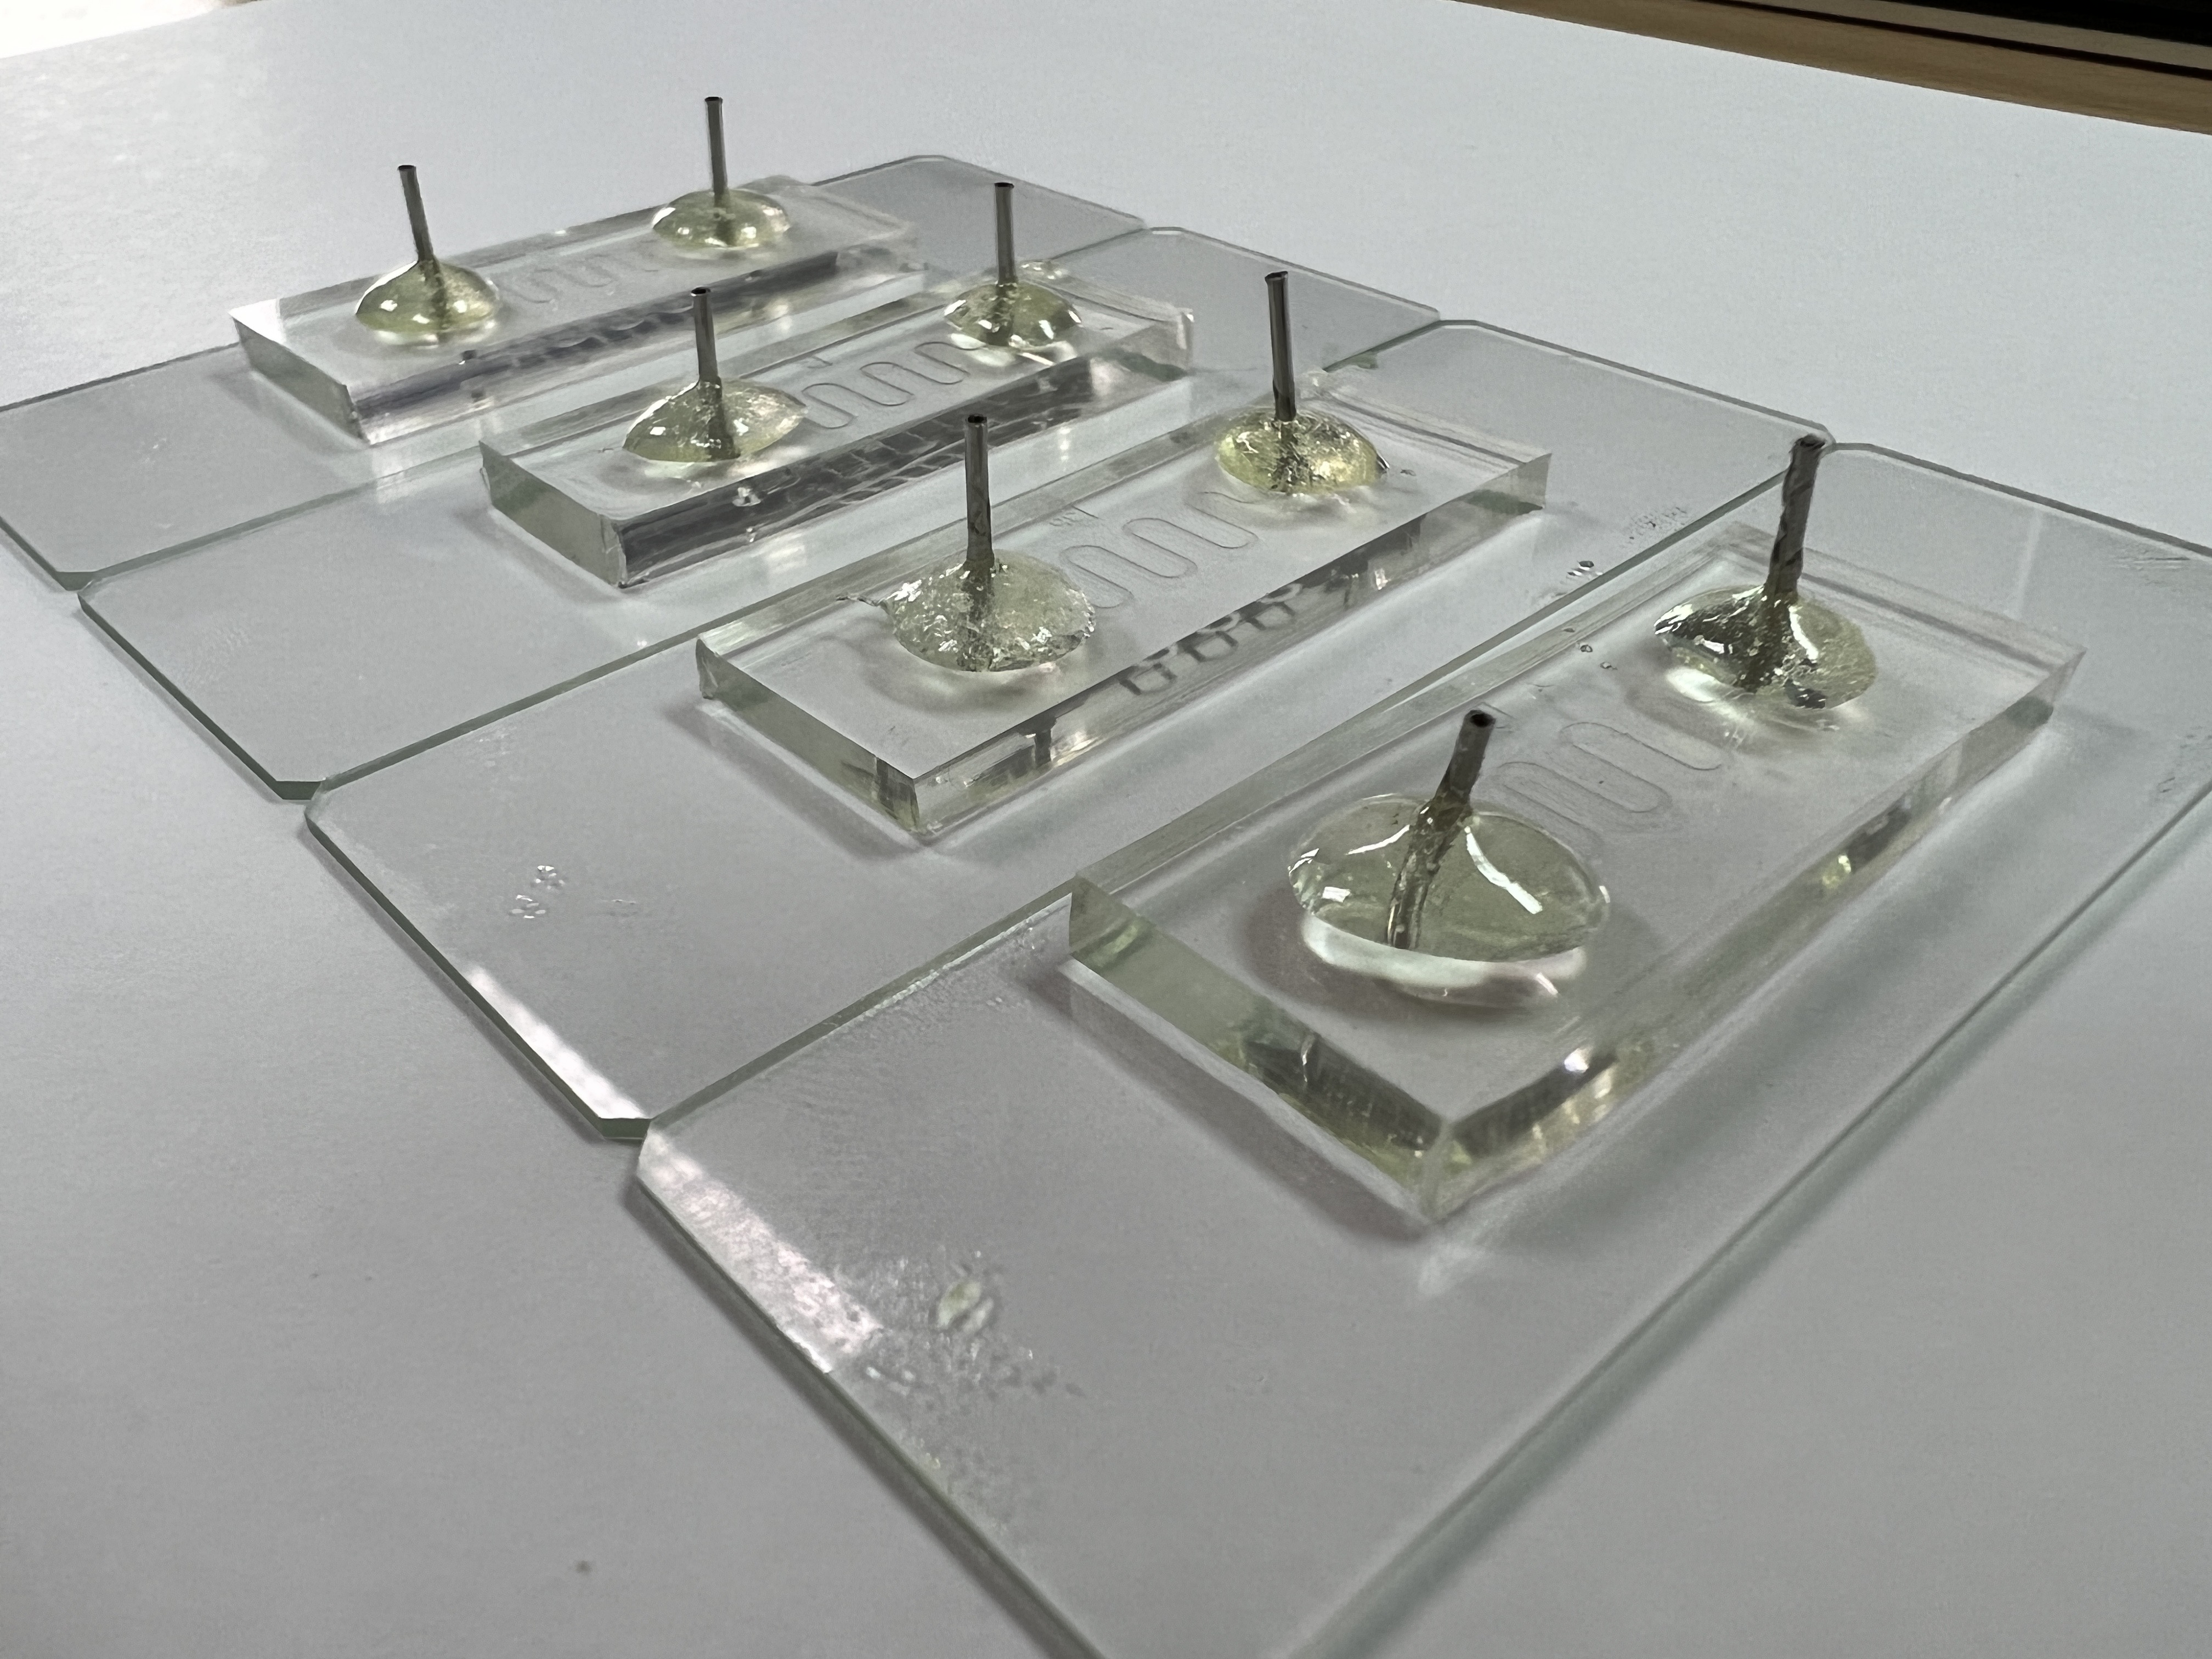
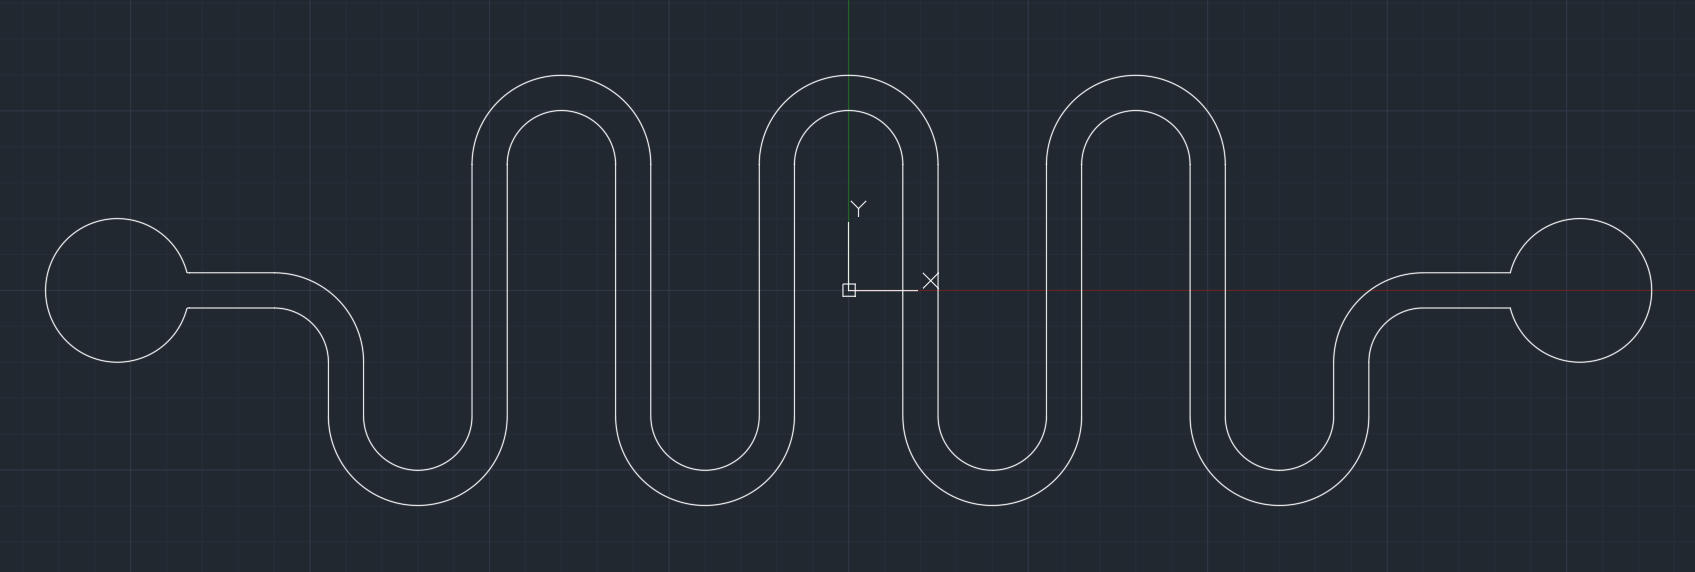
f(int) is an affordable and safe simulation device purposely built to mimic the human small intestine. The basis of f(int) design is a serpent style microfluidic that folds into each with the inner structure containing geometrical ordered half circles on the wall, representing intestinal circular folds and an additional rod-shaped structure representing intestinal villi. The primary function of f(int) is to calculate the bacteria retention rate that simulates how much bacteria stay in the channel.

Design
f(int) design is based on our implementation of a human small intestine structure, which aims to represent one section of the intestine: the jejunum. f(int) was built using the scale of 1:50, which includes the overall length of the jejunum (2500mm[3]), the diameter of Jejunum (24.5mm[4]), and both the size and configuration of circular folds. However, due to some restrictions we had to obey in designing the photomask, it is only possible to fabricate the villi with a scale three times bigger than the rest (1:16.65).
Microfluidic Generation 1 Design:
f(int) has four different channels to determine which design is the most suitable representation of Jejunum. The first channel, named “Smooth”, as shown in Figure x, is a channel without any internal structure and was intended as a control to see any residual rate differences when internal structures such as circular fold and villi were added into the channel.

Blood p-Cresol Reader
For determining p-Cresol levels in patient’s blood, CreSense’s integrated fluorescent detector quantifies light intensity emitted by the p-Cresol sensing bacteria, which expresses GFP when in contact with blood plasma p-Cresol.

In our BioBrick construct, we are using GFP as our reporter. To excite the emission of fluorescence by the GFP, we used a blue laser. The optimal fluorescence emission is at around 515 nm. A 510 nm filter is used to block the excitation light and allow only the emission light to pass through.
With the aid of a light-frequency converter - TSL 235R as our light sensor, we will be able to read different emission light intensity. Sensor readings will be converted to p-Cresol concentration and displayed on the LCD screen and uploaded onto our realtime database for further monitoring.
Our device is able to measure fluorescence intensity equivalent to 50 nM of fluorescein. We used the Fluorescein Sodium Salt provided in the measurement kit for our sensor calibration.

We also tested our fluorescence detector by adding autofluorescence E. coli (pSB1C3-j23100-sfGFP in DH5α) into blood plasma and we are now positive that our device can successfully sense the fluorescence emission from the bacteria in plasma.


When we first designed our fluorescence detector, we used LDR as our light sensor. However, we soon realized that without a filter, our detector reading could not reflect the actual fluorescence intensity. From Fig. S2C, we can see that the light sensor works fine for light transmittance measurement. The darker the surrounding is, the lower the LDR value.

This does not fit the purpose of our device which is fluorescence measurement. To measure only the fluorescence emission but not the total visible light transmission, we decided to add a narrow bandpass filter to block the excitation light (510 nm) from the blue laser reaching the light sensor. We also changed the position of the light sensor and avoid a collinear arrangement. Not only that, we replaced the light-dependent resistor with our TSL 235R light-frequency converter thus improving the accuracy of our device.
Online Database
CreSense is expected to be placed at all healthcare service providers. We connected the onboard Arduino Uno to a NodeMCU to upload detector readings onto Firebase - an online real-time database. These data can then be accessed by healthcare professionals. In the future, we are hoping that we can integrate this database with Taiwan’s Ministry of Health and Welfare database. By doing so, our device can make a greater impact by helping to monitor the blood p-Cresol level of our CKD patients.
Arduino code and Circuits
We use Arduino IDE to code for our Arduino UNO and a NodeMCU board for our whole device. The complete code can be found on Github.
Shown below is our entire wiring sketch:

Experiment and Result
CreSense is a user-friendly, affordable and customizable biosensing device, and is expected to be placed at all healthcare service providers as a simple and accessible alternative for measuring blood p-Cresol levels. To demonstrate how our engineered system works, we have made a video to explain the workings of CreSense and its operating processes.
Cost Estimation
CreSense is a user-friendly, affordable and customizable biosensing device, and is expected to be placed at all healthcare service providers as a simple and accessible alternative for measuring blood p-Cresol levels. To demonstrate how our engineered system works, we have made a video to explain the workings of CreSense and its operating processes.
Demonstration
CreSense is a user-friendly, affordable and customizable biosensing device, and is expected to be placed at all healthcare service providers as a simple and accessible alternative for measuring blood p-Cresol levels. To demonstrate how our engineered system works, we have made a video to explain the workings of CreSense and its operating processes.
References
- Gorkin, R., Park, J., Siegrist, J., Amasia, M., Lee, B. S., Park, J.-M., … Cho, Y.-K. (2010). Centrifugal microfluidics for biomedical applications. Lab on a Chip, 10(14), 1758. doi: 10.1039/b924109d
- Amasia, M., & Madou, M. (2010). Large-volume centrifugal microfluidic device for blood plasma separation. Bioanalysis, 2(10), 1701–1710. doi: 10.4155/bio.10.140