Team:NCKU Tainan/Model

Welcome to our model section! Two models which perfectly describe our core concepts of MenTAUR will be introduced here. The issue we targeted was depressive symptoms induced by the inflamed gut through the gut-brain axis. Therefore, we designed a bioengineered E. coli that can produce taurine after detecting ROS and a crucial cytokine biomarker- IFN-γ in the intestinal environment. There were two following questions we would like to answer in our Model.
- Could taurine, produced by our bioengineered E. coli, really reach a feasible concentration that inflicts beneficial effects without causing harm to the body?
- Did taurine metabolites really enhance the efficacy of the excessive ROS scavenging process?
After answering those important questions mentioned above, our project could echo from end to end.
Overview
-
We aimed to model Menbles' working efficiency in the intestine. This model figured out:
Time-dependent fluctuations of all substrates, coenzymes, by-products, and products
Reaction rates and outflows of all compounds
Outcomes of taurine production after our product, Menbles, successfully inhabits our intestine.
We identified the massive taurine consumption effect of tauD in E. coli. The result indicated that we should perform tauD knockout in the engineered bacteria.

Background
We dedicated ourselves to simulating the real taurine metabolism happening in the small intestine. Below were the critical points that should be considered:
- According to the taurine production pathway adapted from engineered Corynebacterium glutamicum[1], three important enzymes- CS, CSAD, and CDO1 that created two sequential pathways to produce taurine were the candidates for our engineered E. coli.

- Substrates for three enzymes, shown above, were not all available in E. coli directly. Moreover, bacteria's uptake rate of amino acids cannot outcompete that of humans. Therefore, de novo synthesis with high efficient carbohydrate transport phosphotransferase systems was how they deal with this problem[2]. In this pathway, glucose was the precursor of all the substrates listed above, thus the starting point of our model was from glucose.
- Of greater significance, the gene of E. coli encoded a protein, TauD, that could degrade taurine, which was an important factor that should be considered.
Based on the above consideration, the comprehensive chemical reaction was shown in Fig. 2.

Flow Diagram
This was the flow diagram of our model. Each step would be introduced in the following corresponding sections.

Growth Model ( I )
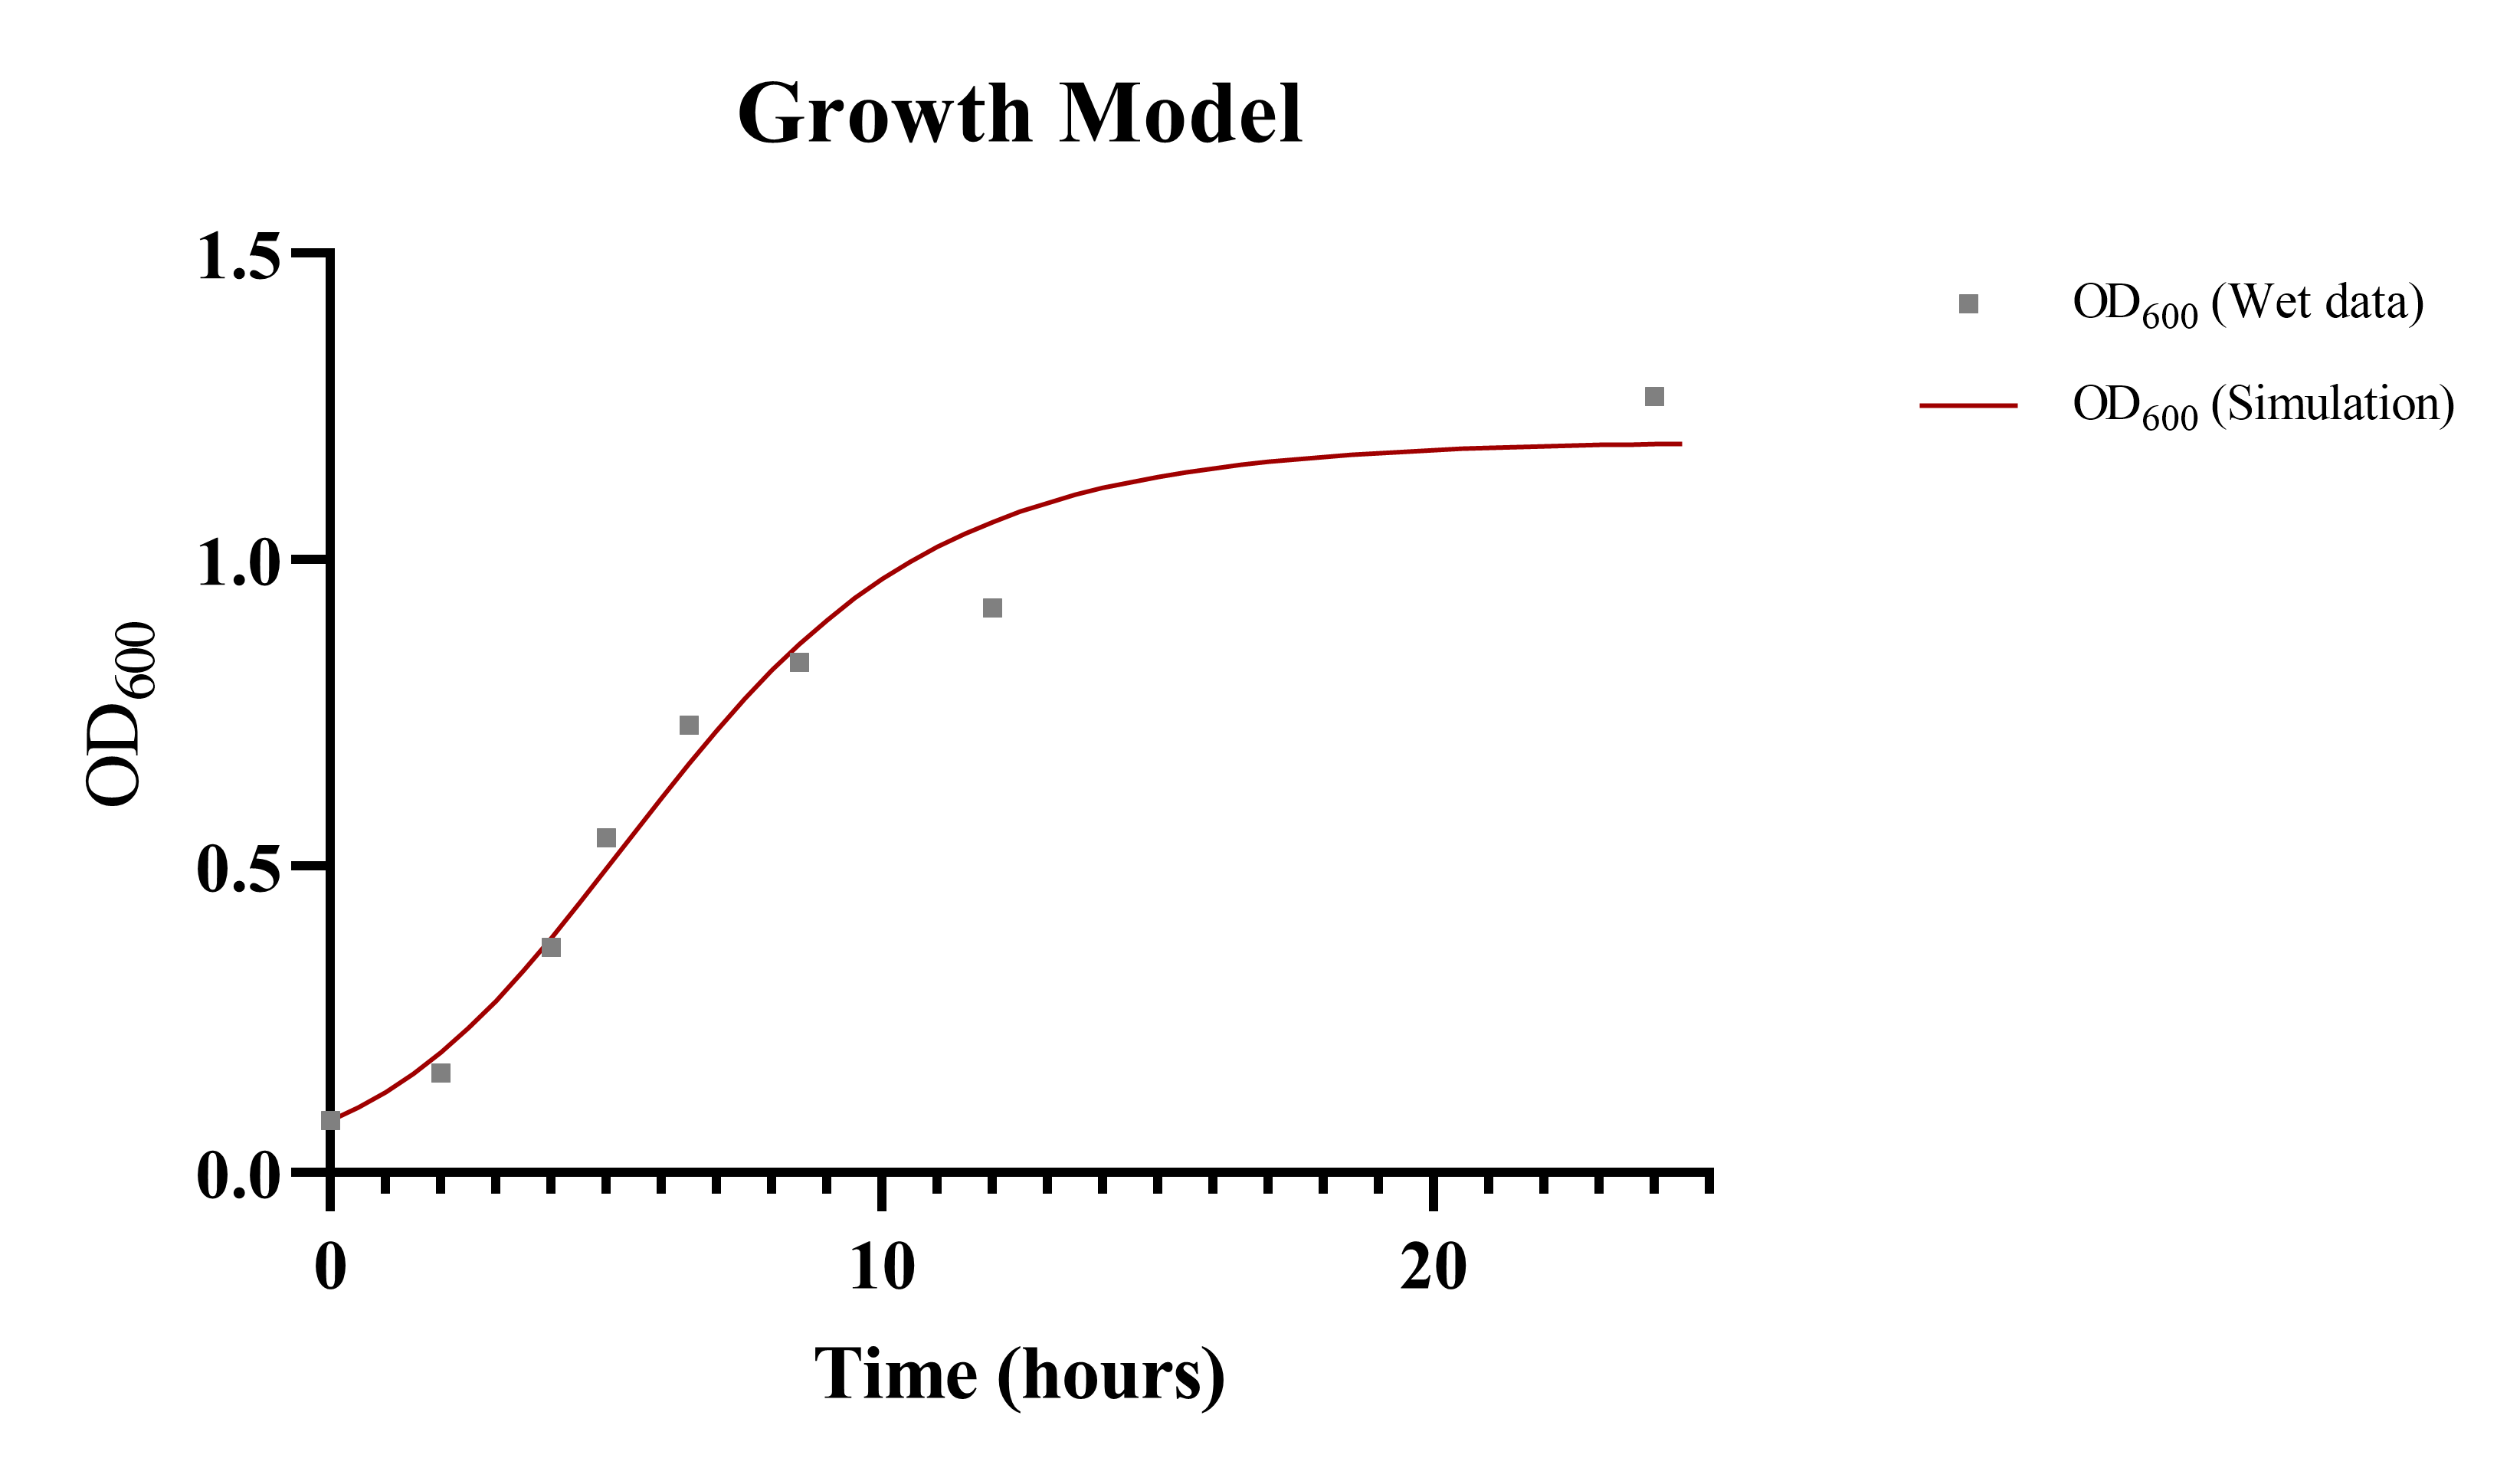
To calculate overall production of taurine within our culture, it was essential to identify the growth rate of the constructed bacteria first. We combined the specific growth pattern of our designed bacteria with the taurine production model for each unit of bacteria. The ordinary differential equation we modified was listed below[3,4]:

ComBase Excel DMFit[5] and SymPy in Python were introduced to solve the problem. We combined optimized parameters from experimental observations and ComBase database to generate a formulaic function for E. coli growth curve. The result for E. coli culture and predictions was in Fig. 4. Below (see Table 1) was the optimized parameters for our growth model:
| Parameter | Value | Unit | Description |
|---|---|---|---|
| q0 | 2.35 | 1 | Dimensionless quantity related to the physiological state of the bacteria within the jejunum. |
| umax | 1.07 | h-1 | Maximum specific growth rate for E. coli population is deducted from ComBase Database. |
| ODmax | 1.26 | 1 | Maximum OD value is determined by in vitro experiment data. |
Enzyme Kinetic Model ( II )
Inspired by Corynebacterium glutamicum metabolic mechanism presented in previous research[1] , we employed various Michaelis-Menten equations to depict the mechanism of central carbon metabolism[6] and serine biosynthesis in E. coli[7]. We utilized an open-source software application, COPASI, to create and solve mathematical models for biological processes. Besides, due to the lack of kinetic information regarding CS, CSAD, and CDO1 enzymes in current literature, we attempted to build the model based on reasonable deductions and assumptions. And lastly, the dynamics of tauD knocked-out in our engineered E. coli was added to our model to show the ability to prevent taurine from breaking down.
We divided our enzyme kinetic model into four categories listed below:
- Glucose Transport System
- Glycolytic Pathway
- Serine & Cysteine Synthesis
- Taurine Synthesis
Equations adopted in our Enzyme Kinetic Model are chiefly based on Michaelis-Menten equations. The Michaelis-Menten equation was commonly used for predicting enzymatic reactions. It approximated the original dynamic characteristics under the assumption that concentrations of enzymes remained constant. Under certain assumptions, the rate of product formation was shown in a simplified equation below:

| Symbol | Description |
|---|---|
| d[P]/dt | The formation rate of the product |
| v | The rate of the enzymatic reaction |
| Vmax | The maximum rate of reaction achieved by the system under certain conditions. |
| [S] | The concentration of substrate |
| Km | Michaelis-Menten constant, which also illustrates the substrate concentration when the reaction rate is half of the Vmax |
| kcat | The turnover number is the maximal number of molecules of substrate converted to product per active site per unit time. |
| [E]total | The total number of enzymes |
Glucose Transport System
We adopted the kinetic characteristics of phosphotransferase system (PTS) to represent the glucose transport system in our model due to its extensiveness in prokaryotes[6].
Glycolytic Pathway
Taurine synthesis involved the usage of phosphoserine and cysteine, where both of them were derived from the 7th glycolytic intermediate product, 3-phospho-glycerate (3PG). Therefore, the kinetics of remaining metabolites, such as phosphoenolpyruvate, and pyruvate, were omitted for simplification purposes. However, given their regulatory properties for the previous glycolysis pathway[6], we couldn’t omit them without doing anything. Setting them at a steady-state concentration was the alternative way that we used to enhance our accuracy in silico modulation.
Serine & Cysteine Synthesis
L-serine could be converted to L-cysteine, following its synthesis from 3PG. These two pathways linked up glycolysis with downstream taurine synthesis pathways. Nevertheless, only 12%~15% glucose was transformed into serine in E. coli[8,9], and merely two-thirds of serine flux drained into cysteine synthesis[10]. To ensure our result was close to reality, we had introduced some parameters and formulas into the original structure to represent the other glucose-involved and serine-involved pathways.
Taurine Synthesis
As mentioned previously, due to the lack of information for CSAD, CDO1, and CS, we constructed the kinetic equation based on their enzymatic attributes. Below were some properties we took into consideration when we designed our model.
- CASD is a pyridoxal-phosphate(PLP) dependent-protein with SO3H (cysteate) and CySO2H (sulfino-alanine) as its competitive inhibitors[11].
- CDO1 catalyzes the oxidation process of L-cysteine. Classical Michaelis–Menten kinetics with NADPH as its modifier, is supposed to fit with its kinetic characteristic[12].
- CS is a pyridoxal-phosphate protein that is highly specific for O-phospho-L-serine. Due to IUBMB literature, the reaction type is similar to that of O-phosphoserine sulfhydrylase, and therefore, it is rational to be regarded as a similar reaction formula for CS[13].
Assumption
Given to simplify our model, below were some assumptions we made.
- Coenzymes, such as NADH, maintain steady-state concentration.
- Given the previous iGEM team model design with 1.5 mM glucose influx per hour, we assumed that only 30 mM glucose would be involved in the E. coli metabolic pathway per day.
- We assumed that intracellular taurine produced could be viewed as the total yield of taurine.
- The oxidative reaction from hypotaurine to taurine is negligible.
- The bifurcation of 3-PG flux between R9 and R8 is 1 to 4.
- The bifurcation of serine flux between R14 and R20 is 2 to 1.
- The bifurcation of cysteine flux between R16 and R21 is 1 to 1.
Result
Validation ( III + IV )
After combining all of the above mathematical formulae, given to the insufficient enzyme kinetics data of taurine synthesis pathway, the first thing we did was to compare and modify our parameters based on the result from In Vivo Taurine Production Test 1 data.
Our experimental data showed that over 150 mg/L taurine was accumulated at 12 hours and decreased to lower than 50 mg/L at 24 hours under the initial OD600 value of 0.0853 in LB medium. It’s quite different compared with our model results due to the complexity of nutrient compositions in the wet experiment. Thus, what we took for reference was the concentration pattern with time, and it’s obvious that the experimental pattern was the same as our modeling results, showing the reliability of our models. (see Fig. 5).

Furthermore, in order to realize the effectiveness of tauD deletion more clearly, we simulated these two situations (with or without tauD deletion) under 0.2 mg/L, 0.5 mg/L, and 1 mg/L cysteine intake, respectively(see Fig. 5-9). The result revealed, after tauD deletion in E. coli, the maximum yield of taurine was at least three times higher than original E. coli. In addition, taurine could be preserved longer in E. coli (Δ tauD), showing that our engineered E. coli could produce accessible taurine with high efficiency.


Application ( V )
Inspired by University of Nottingham's 2020 iGEM team, we wanted to explore the real condition while applying our product in the human body rather than experimental conditions. Therefore, glucose was the deterministic substrate for taurine synthesis. Additionally, based on the design in the University of Nottingham's 2020 iGEM team, we assumed that 30mM glucose can be consumed by E. coli in one day. Under the situation, our outcome was settled to be most closely to the result of the real world.
Similarly, the maximum yield increased enormously in E. coli (Δ tauD). More interestingly, the CS-engaging taurine synthesis pathway was included this time. However, the simulation showed that the accumulation of intermediate product, cysteate, was too little to make an impact on the overall yield of taurine. Regarding this conclusion, we were capable of setting priority in designing our engineered E. coli biobricks by focusing on CSAD and CDOI.
Last but not the least, the production of taurine could be built up to approximately 600 mg/L in E. coli (Δ tauD), which was far lower than the acceptable daily intake recommended, 3 g/day (see Fig. 12) . In short, under suitable intake, our engineered E. coli could successfully provide antioxidant capacity with little safety concerns.


Conclusion
Using the data from previous research and our experimental results, we can use our model to demonstrate the results below:
- Deletion of tauD was essential to elevate our taurine production
- Compared with the CS plus CSAD pathway, CDO1 plus CSAD pathway had higher efficiency to produce taurine.
- Our engineered E. coli could provide an adequate dose of taurine continuously to alleviate depressive symptoms without safety concerns.
Nonetheless, we can do more than this in the future. First, to ensure the accuracy of our model, fitting our simulation with more available experimental data is necessary. Moreover, given the turbulent peristaltic waves in the intestine, we can combine our model with the retention rate from hardware data to achieve a more precise result.
All in all, we had built a backbone for the taurine synthesis model.
Are you wondering how taurine could alleviate depressive symptoms?
See our ROS scavenging system model page to get the answer now!
Appendix
References
- Joo Y-C, Ko YJ, You SK, et al. Creating a New Pathway in Corynebacterium glutamicum for the Production of Taurine as a Food Additive. Journal of Agricultural and Food Chemistry. 2018/12/26 2018;66(51):13454-13463. doi:10.1021/acs.jafc.8b05093
- Zoetendal EG, Raes J, van den Bogert B, et al. The human small intestinal microbiota is driven by rapid uptake and conversion of simple carbohydrates. The ISME Journal. 2012/07/01 2012;6(7):1415-1426. doi:10.1038/ismej.2011.212
- Koseki S, Nonaka J. Alternative Approach To Modeling Bacterial Lag Time, Using Logistic Regression as a Function of Time, Temperature, pH, and Sodium Chloride Concentration. Applied and Environmental Microbiology. 2012;78(17):6103-6112. doi:10.1128/aem.01245-12
- Team:Bilkent-UNAMBG/Model - 2019.igem.org. Igem.org. Published 2019. Accessed October 14, 2021. https://2019.igem.org/Team:Bilkent-UNAMBG/Model
- Home. Combase.cc.https://www.combase.cc/index.php/en/
- Chassagnole C, Noisommit-Rizzi N, Schmid JW, Mauch K, Reuss M. Dynamic modeling of the central carbon metabolism of Escherichia coli. Biotechnology and Bioengineering. 2002;79(1):53-73. doi:10.1002/bit.10288
- Smallbone K, Stanford NJ. Kinetic Modeling of Metabolic Pathways: Application to Serine Biosynthesis. Methods in Molecular Biology. Published online 2013:113-121. doi:10.1007/978-1-62703-299-5_7
- Gu P, Yang F, Su T, Li F, Li Y, Qi Q. Construction of an l-serine producing Escherichia coli via metabolic engineering. Journal of Industrial Microbiology and Biotechnology. 2014;41(9):1443-1450. doi:10.1007/s10295-014-1476-6
- Tran K-NT, Eom GT, Hong SH. Improving L-serine production in Escherichia coli via synthetic protein scaffold of SerB, SerC, and EamA. Biochemical Engineering Journal. 2019/08/15/ 2019;148:138-142.doi:https://doi.org/10.1016/j.bej.2019.05.002
- Krömer JO, Wittmann C, Schröder H, Heinzle E. Metabolic pathway analysis for rational design of L-methionine production by Escherichia coli and Corynebacterium glutamicum. Metabolic Engineering. 2006;8(4):353-369. https://doi.org/10.1016/j.ymben.2006.02.001
- Jacobsen JG, Thomas LL, Smith LH. Properties and distribution of mammalian l-cysteine sulfinate carboxy-lyases. Biochimica et Biophysica Acta (BBA) - Specialized Section on Enzymological Subjects. 1964;85(1):103-116. doi:10.1016/0926-6569(64)90171-3
- Lombardini JB;Singer TP;Boyer PD. Cystein oxygenase. II. Studies on the mechanism of the reaction with 18oxygen. The Journal of biological chemistry. 2021;244(5). Accessed October 5, 2021. https://pubmed.ncbi.nlm.nih.gov/5767301/
- BRENDA - Information on EC 2.5.1.76 - cysteate synthase. Brenda-enzymes.org. Published 2021. Accessed October 5, 2021. https://www.brenda-enzymes.org/enzyme.php?ecno=2.5.1.76
Overview
Reducing the amount of ROS was the main goal of Menbles, and the mechanism we proposed was the anti-oxidative characteristic of a taurine derivative, TauCl, that could eliminate excessive ROS in the gut. The reaction required the involvement of neutrophils and its active product, HOCl. We will thoroughly describe this whole process in the taurine scavenging model, in order to deeply investigate the mechanism and efficiency of our product.

Aims
In this model, we wanted to demonstrate the mechanism of taurine’s antidepressant effect, and to prove that under the production of TauCl, intestinal epithelial cells could unprecedentedly enhance their endogenous ROS scavenging system.
Background
Reactive oxidative species (ROS) and taurine were two main elements in our project. ROS could act as a toxic chemical that killed bacteria but also play as an oxidant that harmed our normal cells[1,2]. In short, ROS was well-known for playing a dual role as a constructive and destructive species.
In that case, why did ROS take its place in our project? In fact, chronic stress-induced depression (CSID) was positively correlated to uncontrolled inflammation in the central nervous system[3], the main reason for inducing abnormal neurotransmission. Besides, neurotransmission was co-regulated by intestinal epithelial cells and gut microbiota as well. More importantly, based on the gut-brain axis theory, inflammation in CNS resulted in disruption of intestinal permeability that would boost inflammatory in situ and further systemic impact on physiological status[4]. The bidirectional effect between the brain and the intestine aggravated the state of depression. Herein, we would illustrate how taurine blocked the interaction with the simulation.
Innate ROS metabolism cycle
Normally, cells could get along with ROS smoothly under the innate ROS metabolism cycle. The innate ROS metabolism cycle maintained the equilibrium of ROS in response to specific irritation. The glutathione redox cycle, NADPH suppliers pathway (including the upper part of the glycolytic pathway), the pentose phosphate pathway (PPP), and the gluconate shunt all built up the innate ROS metabolism cycle. Among all, reduced glutathione (GSH) was the one directly scavenging ROS. Nonetheless, the existence of NADPH was crucial for GSH replenishment[5].

Taurine’s Role in ROS Scavenging System
Taurine was an effective antioxidant to whole-body tissue since it could scavenge ROS through several indirect routes[6]. The mechanism leading by taurine chloramine (TauCl) was what we focused on in this project. After taurine reacted with hypochlorous acid (HOCl), a strong oxidative antimicrobial agent produced by activated neutrophils[7], TauCl suddenly culminated. With the formation of TauCl, not only did excessive HOCl be readily converted to TauCl, but TauCl itself could exert sequential anti-inflammatory actions including inhibiting the assembly of NADPH oxidase, increasing expression of antioxidant enzymes such as heme oxygenase-1 (HO-1), and rising level of intracellular antioxidant GSH[8]. In brief, TauCl, released by activated neutrophils in inflamed tissue, could make surrounding cells more defensive to oxidative damage[9].

Cell-cell Interaction Model
According to mechanisms between taurine and scavenging ROS, we constructed a novel model to exhibit the anti-inflammatory activity of taurine by utilizing COPASI. The whole structure could be divided into three parts listed below.
- TauCl synthesis
- ROS metabolism cycle in cell
- Anti-inflammatory action of TauCl on intestinal epithelial cell
Further information in the following sections would be presented in corresponding parts of Supplementary Information of Model 2.
Assumption:
- The neutrophils were readily activated upon stimulus.
- The formation rate of H2O2 remained constant.
- Endogenous ROS would produce persistently due to the stabilization of the cell innate defense system.
- There was full conservation of TauCl when it diffused from neutrophils to nearby intestinal epithelial cells.
Taurine chloramine (TauCl) synthesis in neutrophils
TauCl synthesis in neutrophils required a sequential reaction. Before HOCl could react with taurine to form TauCl, there were about 4 steps to go through.
- Firstly, the neutrophil was recruited and activated by ROS or lipopolysaccharides from the intestinal environment.
- Secondly, NADPH oxidase assembled and ended up resulting in the accumulation of superoxide radical (O2•−).
- Thirdly, O2•− was converted to H2O2 by superoxide dismutase (SOD).
- Ultimately, HOCl was produced under the catalyzation of H2O2 by myeloperoxidase[10].
To simplify the complexity of our simulation, our model started from the formation of HOCl and H2O2 levels set at steady-state concentration.
Innate ROS metabolism cycle in cell
Endogenous ROS Consecutive Production
Cytoplasmic ROS (cytoROS) production played an important role in intracellular signaling and disease pathophysiology. According to literature research, one of the most well-known sources of cytoROS was the NOX family of enzymes[11]. NOX family could continually produce O2•− and other ROS byproducts through NADPH electron exchange, influencing many metabolic processes and disease states. In conclusion, we chose the prominent NOX family enzyme dynamic statistics for our further model construction and yield the function Φ.
Innate ROS Scavenging Pathway
GSH was the major antioxidant we modulate, because of its sophisticated mechanism with TauCl. GSH, which would become oxidized glutathione (GSSG) once scavenging a free radical, had a complicated production system. In addition, GSSG could be reduced again after acquiring NADPH, forming a ROS scavenging recycle. As a result, we needed to incorporate those mechanisms into our model ROS scavenging backbone.
Anti-inflammatory action of Taurine chloramine (TauCl)
In this part, we corporated the transportation of TauCl from neutrophil to epithelial cells and the induction of GSH by TauCl into a sequence of ordinary differential reactions. Since there was little literature discussing the mathematical model mentioned above, we racked our brains to find reasonable solutions.
Result
It was noteworthy that neutrophil transmigration across the intestinal epithelium into crypt lumens was a hallmark of an inflamed intestine, eventually inducing CSID if treated improperly. Therefore, our “Taurine and ROS” model focused on the subtle pathobiology of the neutrophil-intestinal epithelial cell interaction.
Initial ROS scavenging system that we modulated utilized NADP+ and NADPH as the replenishment cycle for yielding antioxidant GSH. Without consistently intaking nutrients, GSH will be consumed thoroughly. ROS would maintain an equilibrium state. Nevertheless, it manifested that without other antioxidant replenishment systems, intestinal epithelial cells might fall into a hazardous situation under chronic inflammatory substances infiltration conditions.

Fig. 5. represented the enhanced ROS scavenging system in which taurine intake remains 26mM. Fig. 6. represented a similar system as Fig. 5. with the exception of steady taurine concentration. Though it showed similar substrate concentration patterns as Fig. 4, we could easily tell that the steady-state concentration of ROS shows a significant difference from Fig. 9.


Detailed metabolite concentration fluctuations were shown in Fig. 7. and Fig. 8.


We successfully proved that by intaking the TauCl released by adjacent neutrophils, the time required by the intestinal epithelial cell to eliminate abnormal ROS showed a prominent decrease (see Fig. 9.); more importantly, ROS could maintain at 2.4 μM compared with the higher amount of that in the intestinal epithelial cell with innate system.

Conclusion
Excessive generation and exposure to ROS in epithelial cells might lead to apoptosis. In our simulation, we demonstrated that TauCl could reduce the hazards of cell exposure to ROS. Moreover, the strong anti-inflammatory effects of taurine weren’t limited to it. In fact, there were robust bidirectional boost effects between IFN-γ and ROS. Therefore, we could deduce that, in the cell-cell interaction scale, TauCl could inflict a more powerful inhibitory effect against overproduced ROS, and the prolonged inflammatory microenvironment within CSID patient intestine had a chance to be improved.
In short, MenTaur could alleviate the burden for CSID patients effectively.
Appendix
References
- Munir S. Sources of ROS Species an Its Harmful and Benefical Effects on Human Health. 2021;
- Aviello G, Knaus UG. NADPH oxidases and ROS signaling in the gastrointestinal tract. Mucosal Immunology. 2018/07/01 2018;11(4):1011-1023. doi:10.1038/s41385-018-0021-8
- Dey A, Hankey Giblin PA. Insights into Macrophage Heterogeneity and Cytokine-Induced Neuroinflammation in Major Depressive Disorder. Pharmaceuticals. 2018; 11(3):64. https://doi.org/10.3390/ph11030064
- Bazaz MR, Balasubramanian R, Monroy-Jaramillo N, Dandekar MP. Linking the Triad of Telomere Length, Inflammation, and Gut Dysbiosis in the Manifestation of Depression. ACS Chemical Neuroscience. 2021;12(19):3516-3526. doi:10.1021/acschemneuro.1c00457
- Schittenhelm D, Neuss-Radu M, Verma N, Pink M, Schmitz-Spanke S. ROS and pentose phosphate pathway: mathematical modelling of the metabolic regulation in response to xenobiotic-induced oxidative stress and the proposed Impact of the gluconate shunt. Free Radical Research. 2019/10/03 2019;53(9-10):979-992. doi:10.1080/10715762.2019.1660777
- Schaffer SWSW, Azuma J, Mozaffari M. Role of antioxidant activity of taurine in diabetesThis article is one of a selection of papers from the NATO Advanced Research Workshop on Translational Knowledge for Heart Health (published in part 1 of a 2-part Special Issue). Canadian Journal of Physiology and Pharmacology. 2009;87(2):91-99. doi:10.1139/y08-110 %m 19234572
- Kim C, Cha Y-N. Production of Reactive Oxygen and Nitrogen Species in Phagocytes is Regulated by Taurine Chloramine. Springer New York; 2009:463-472.
- Piao S, Cha YN, Kim C. Taurine chloramine protects RAW 264.7 macrophages against hydrogen peroxide-induced apoptosis by increasing antioxidants. J Clin Biochem Nutr. 2011;49(1):50-56. doi:10.3164/jcbn.10-120
- Sun Jang J, Piao S, Cha YN, Kim C. Taurine Chloramine Activates Nrf2, Increases HO-1 Expression and Protects Cells from Death Caused by Hydrogen Peroxide. J Clin Biochem Nutr. 2009;45(1):37-43. doi:10.3164/jcbn.08-262
- McCann SK, Roulston CL. NADPH Oxidase as a Therapeutic Target for Neuroprotection against Ischaemic Stroke: Future Perspectives. Brain Sciences. 2013; 3(2):561-598. https://doi.org/10.3390/brainsci3020561,
- Forrester SJ, Kikuchi DS, Hernandes MS, Xu Q, Griendling KK. Reactive Oxygen Species in Metabolic and Inflammatory Signaling. Circulation Research. 2018;122(6):877-902. doi:10.1161/circresaha.117.311401
- Neufeld DS, Wright SH. Basolateral transport of taurine in epithelial cells of isolated, perfused Mytilus californianus gills. Journal of Experimental Biology. 1995;198(2):465-473. doi:10.1242/jeb.198.2.465
- Kim C, Cha Y-N. Taurine chloramine produced from taurine under inflammation provides anti-inflammatory and cytoprotective effects. Amino Acids. 2013;46(1):89-100. doi:10.1007/s00726-013-1545-6