Team:NCKU Tainan/Hardware

Background
Chronic stress has been identified as a significant factor in causing depression[1]. Using our engineered E. coli Nissle, MenTAUR provided a solution to suppress Chronic stress-induced depression by producing Taurine, an amino acid believed to suppress depression symptoms. Currently, most of the research that has already proven the efficacy of Taurine is only implemented in mouse experiments[2]. Based on these results, we built a microfluidic chip to simulate: what will happen to our engineered E. coli Nissle when they reach the jejunum. Therefore, in this opportunity, iGEM NCKU Tainan 2021 had come up with f(int).
Device Overview
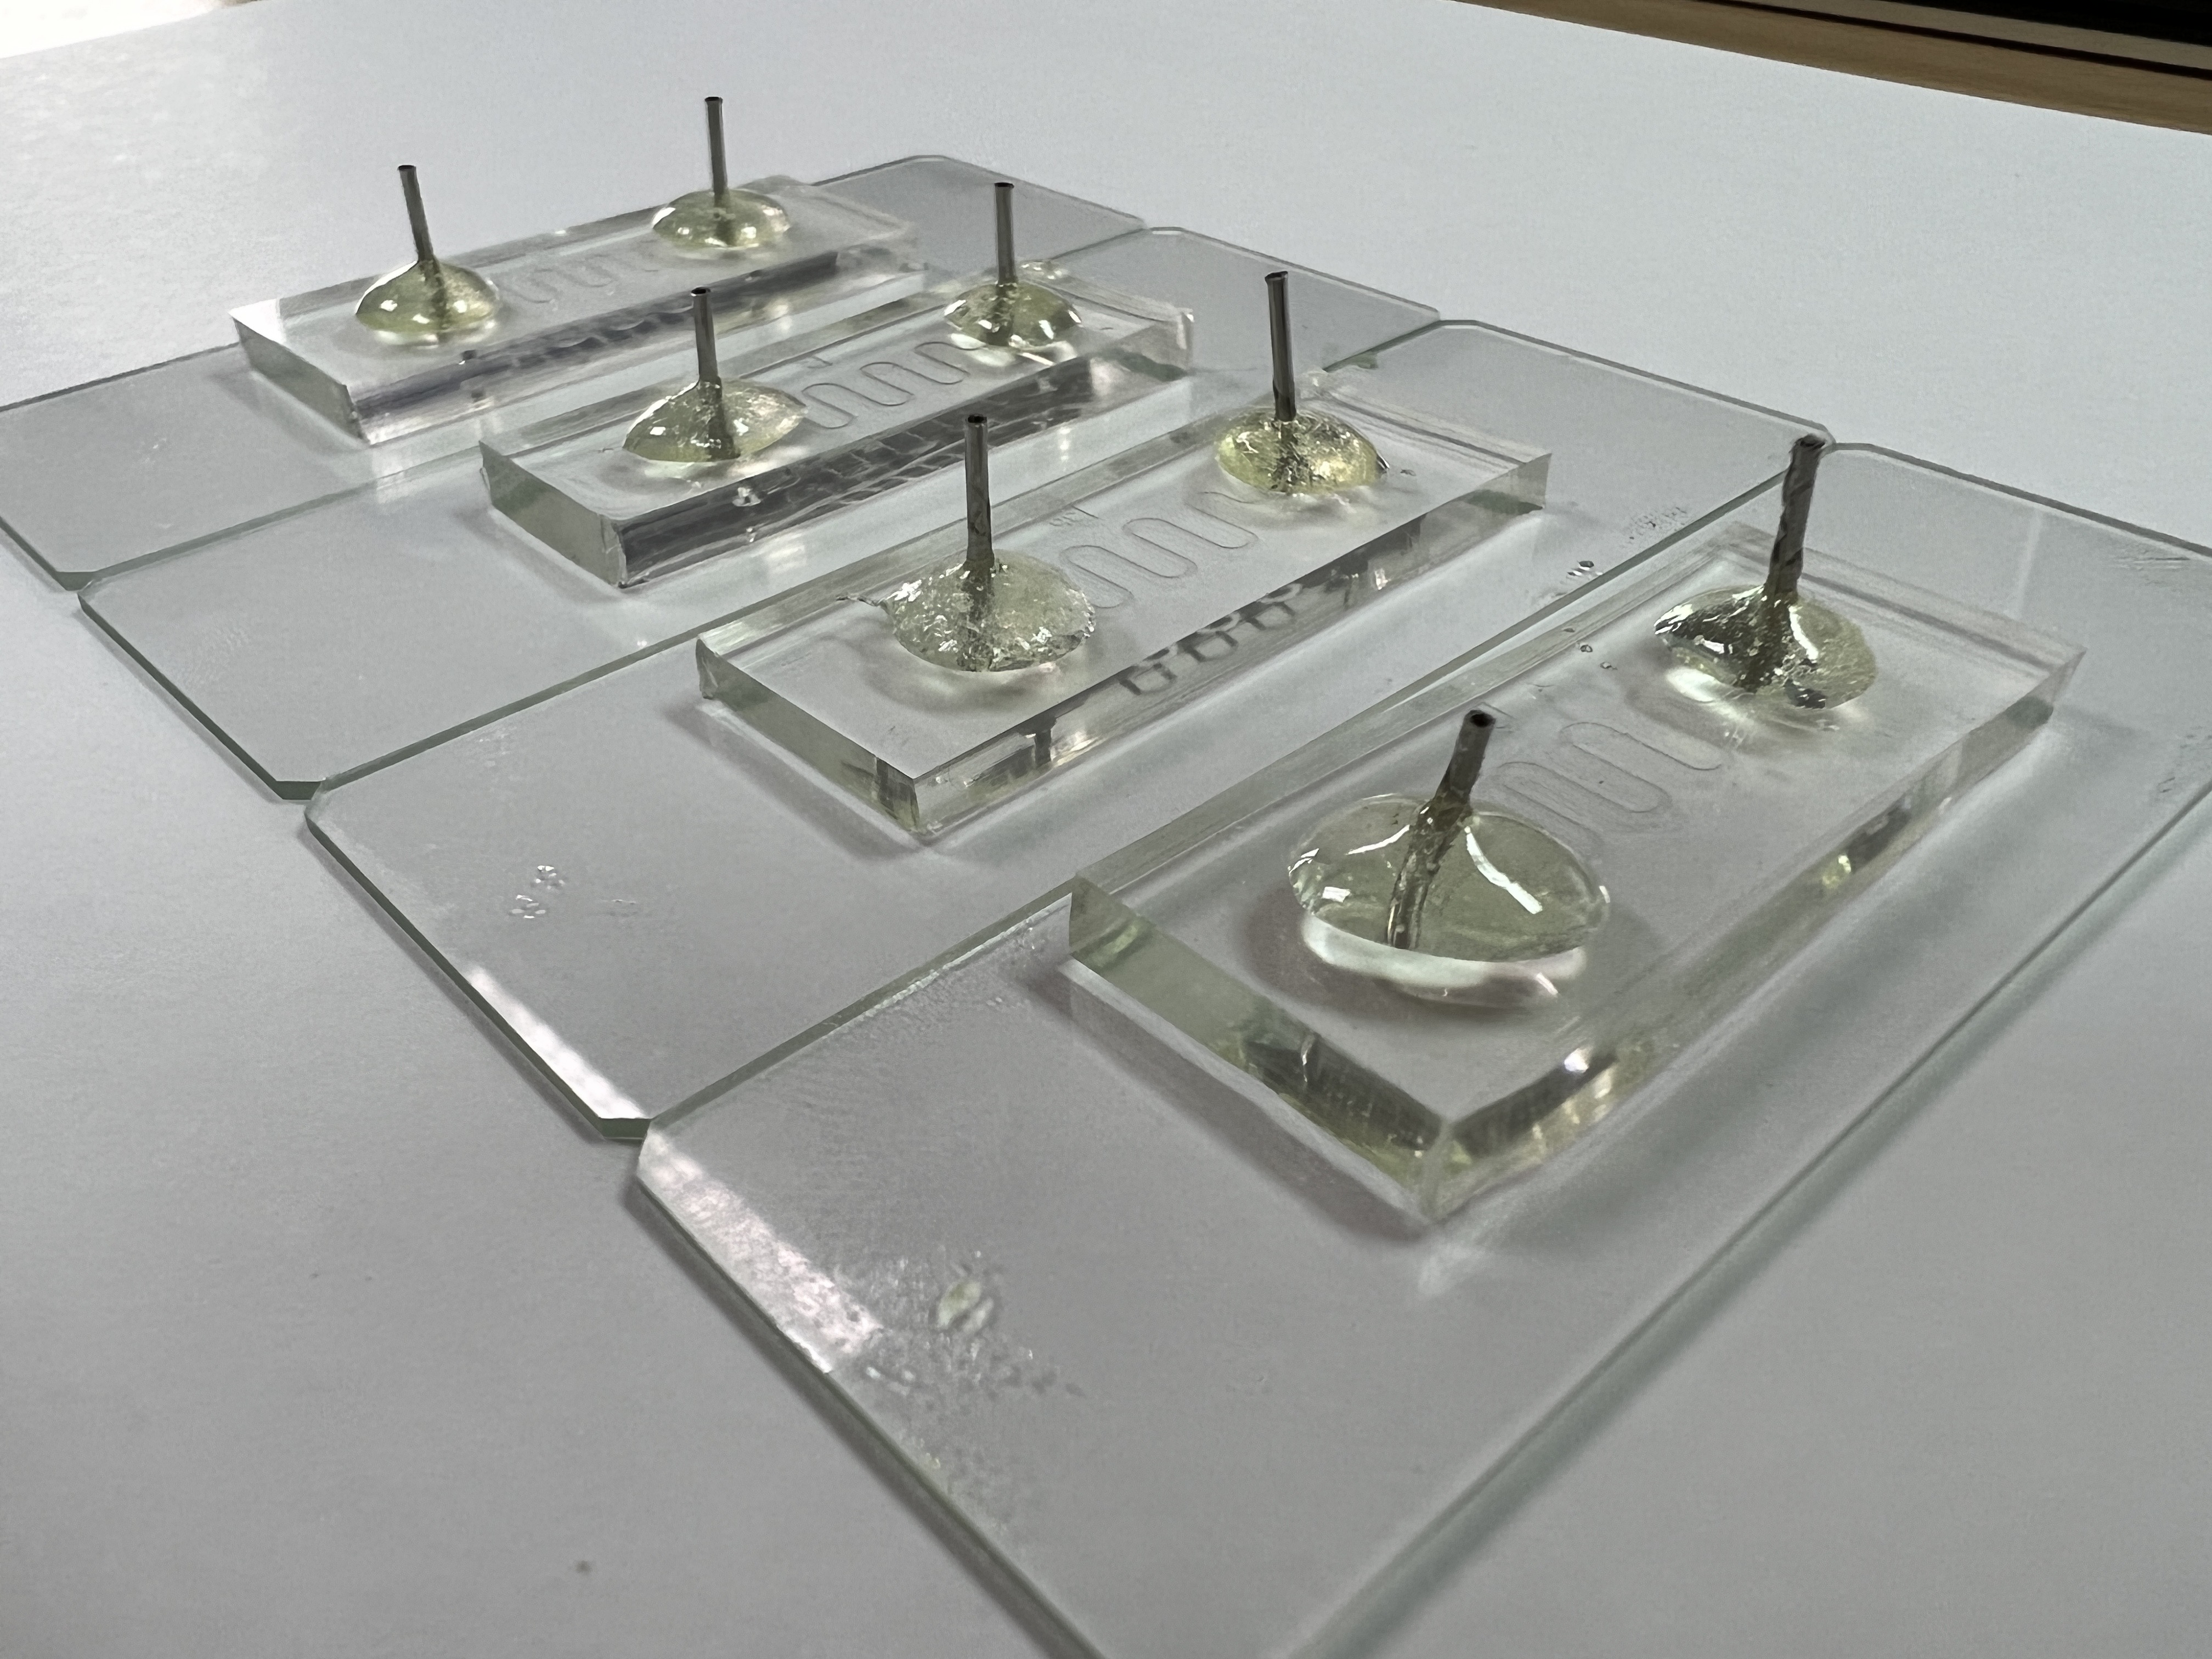
f(int) is an affordable and safe simulation device purposely built to mimic the human small intestine. The basis of f(int) design is a serpent style microfluidic that folds into each with the inner structure containing geometrical ordered half circles on the wall, representing intestinal circular folds and an additional rod-shaped structure representing intestinal villi. The primary function of f(int) is to calculate the bacteria retention ratio that simulates how much bacteria stay in the channel.

Design
f(int) design is based on our implementation of a human small intestine structure, which aims to represent one section of the intestine: the jejunum. f(int) was built using the scale of 1:50, which includes the overall length of the jejunum (2500 mm[3]), the diameter of the jejunum (24.5 mm[4]), and both the size and configuration of circular folds. However, due to some restrictions we had to obey in designing the photomask, it is only possible to fabricate the villi with a scale three times bigger than the rest (1:16.65).
Microfluidic Generation 1 Design:
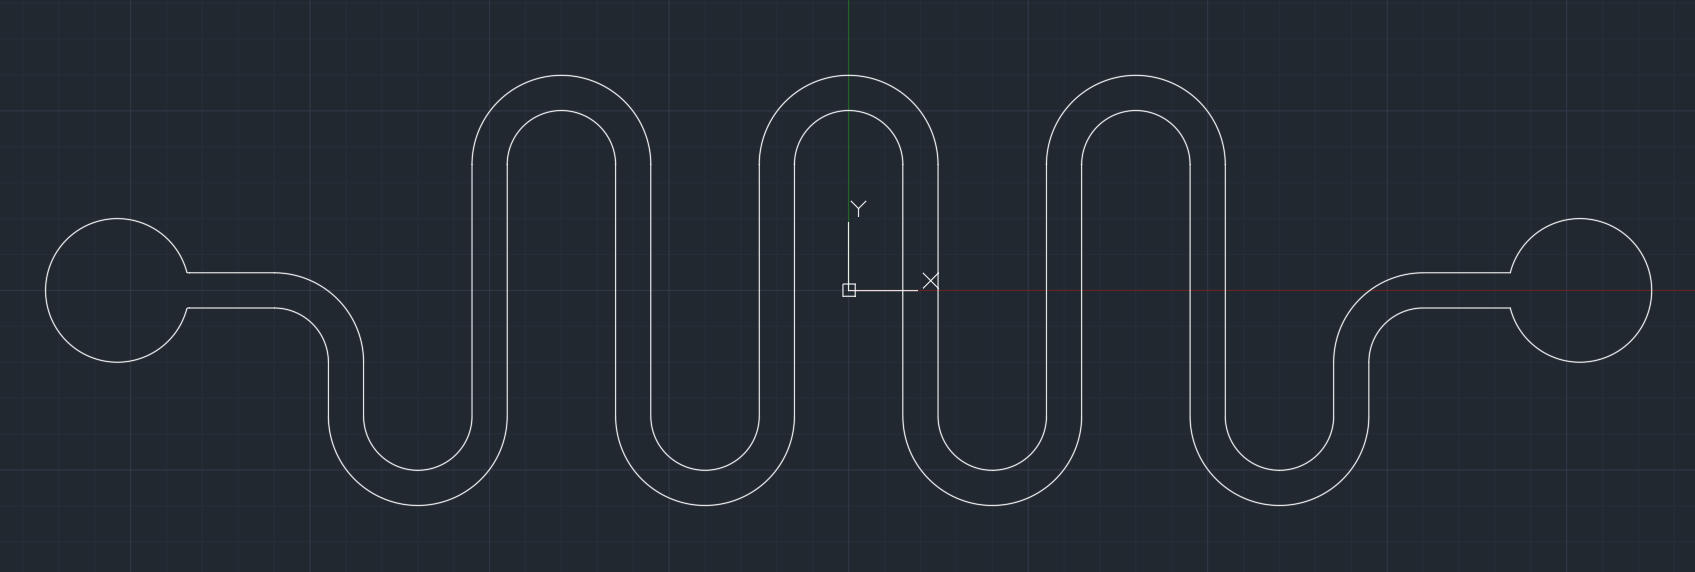
f(int) has four different channels to determine which design is the most suitable representation of the jejunum. The first channel, named “Smooth”, as shown in Fig. 3, is a channel without any internal structure and was intended as a control to see any retention ratio differences when internal structures such as circular fold and villi were added into the channel.

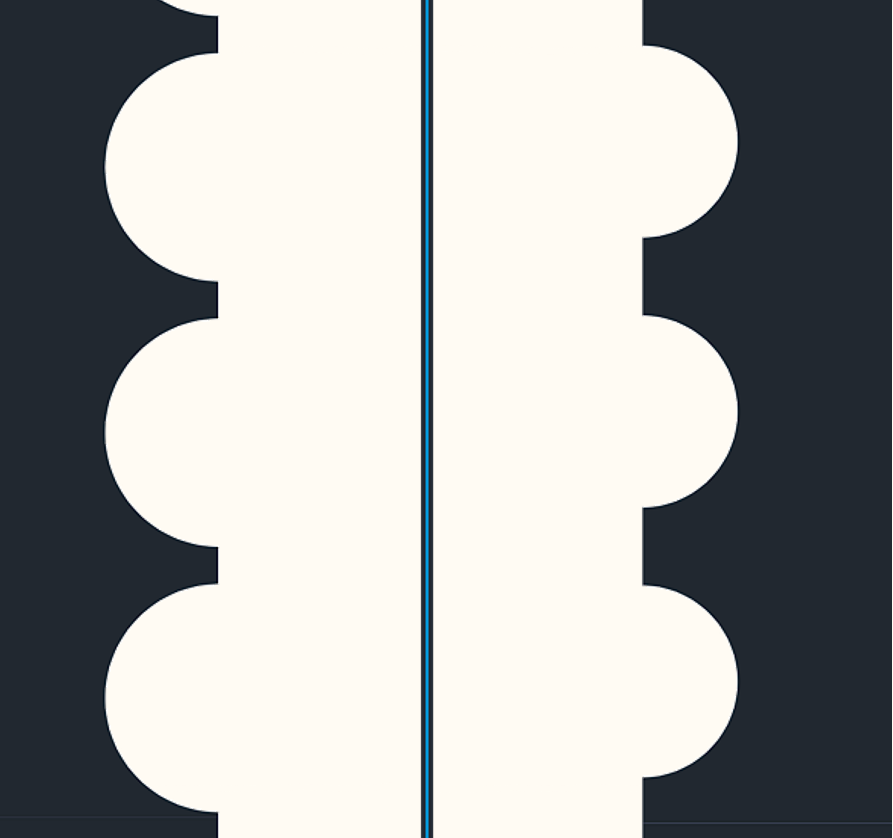
The second channel, named “w/ CF” (with Circular Folds), has an additional internal structure that looks like a half-circle along channel walls representing the jejunum circular fold, as shown in Fig. 5. The size of circular folds was derived from its maximum height (8 mm)[5], and the number of circular folds in every inch (4-7)[6], and was inspired by Quizlet’s picture of circular folds.[7]
Because of some restrictions and limitations we had to obey, we decided to take the lowest number of circular folds per inch of 4 and the height(radius) of 2.375mm, which was scaled down in a factor of 50.

The third channel, named “w/ CF+Villus”, has a villus added into every circular fold angled 90o (corresponding to circular fold angle). Although villus size varies between 0.5 to 1 mm[8], we decided to use the optimum feasible size (1mm) to fabricate the villus. Due to restrictions that we had to face, we decided to make the villus three times bigger than our overall scale (16.65).

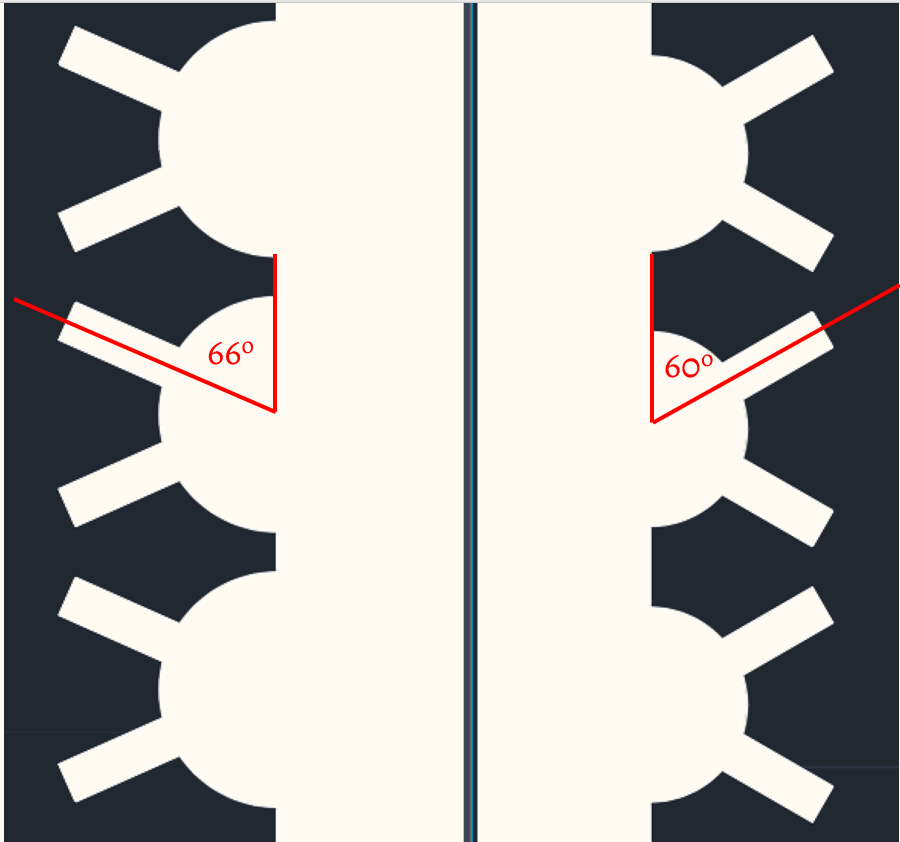
The fourth channel, named “w/ CF+2Villi” follows the same pattern from the third channel with an additional villus in every circular fold. The two villi were designed with the angle of 60o and 120o corresponding to circular fold angles.


For an easier understanding of our first-generation summary, look at table 1 :
| Jejunum | Microfluid | Scale | Unit | |
|---|---|---|---|---|
| Jejunum Length | 2500[3] | 50 | 1:50 | mm |
| Jejunum Diameter | 24.5[4] | 0.49 | 1:50 | mm |
| Villi Length | 1[8] | 0.06 | 1:16.65 | mm |
| Villi Diameter | 0.333 | 0.02 | 1:16.65 | mm |
| Circular fold height | 2.375[5] | 0.0475 | 1:50 | mm |
Microfluidic Generation 2 Design :
The general idea of Generation 2 is pretty much the same as Generation 1. Still, in Generation 2, we wanted to test another parameter: whether a more extensive surface area of the internal structure directly correlates with a probable higher retention ratio. So, in Generation 2, the size of the circular folds increases by 21% from a radius of 0.0475 mm to 0.0575 mm. However, the design still obeys the same rule of 4 circular folds every inch[6]. So, as a result of circular fold size increase, the distance between each circular fold decreases from 40 μm to 20 μm, as shown in Fig. 9.
Other than circular folds difference from Generation 1, the channel configuration with 2 villi is slightly different. Generation 1 villi angles (corresponding to circular folds angle) are 60o and 120o; however, Generation 2 villi angles are 66o and 114o, as shown in Fig. 10. This approach was implemented to make the distance between each villus on top of the circular folds bigger.
Before we settled with our first-generation design, there were several prototypes and thoughts that we had made to represent the human intestine better. However, due to limitations and skills, especially since our first-hand experience fabricating the microfluidic device, we finally decided to abandon this idea and settle with generation 1. These are several preliminary designs that we had done :

Microfluidic-Preliminary-Prot1 was derived from some existing designs of intestinal organ-on-chip[9]; this design includes four sections. Both left and right chambers were supposed to be vacuum chambers that could be controlled by a pump to stretch and contract under pressure changes. For example, under low pressure, both sections will pull the inner chamber out which eventually make a convex shape; otherwise, high pressure will push in and contract the inner chamber. Thus, if we cycle high and low pressure, we will simulate human intestinal peristaltic motion. And the peristaltic simulation is only possible because of the chip fabrication material: PDMS (Polydimethylsiloxane), which is a type of elastomer[10] that deforms easily under stresses.
As we can see from Fig. 11, a section with several tubular structures protruding from the base will mimic the inner part of the human intestine, with the plan of filling the section with Phosphate Buffer Saline (PBS) (pH 7.4 [11][12]), and bacteria of choice. The lower chamber will simulate the outer part of the intestine, which will be filled with MQ water or PBS to simulate how much Taurine produced by our engineered E. coli Nissle will diffuse through the PDMS membrane. Then, after some duration, we need to flow out the lower chamber with fresh MQ or PBS then check Taurine concentration; this will represent how much Taurine our intestine will absorb.
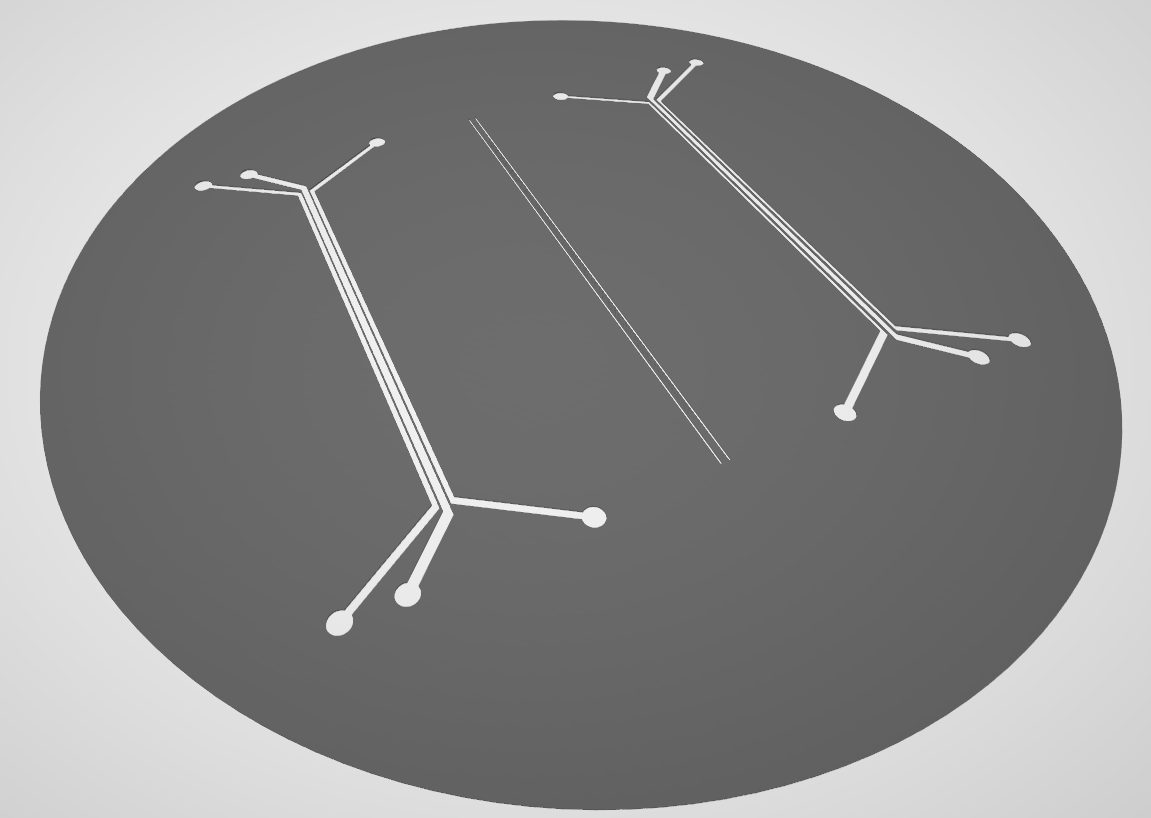
Microfluidic-Preliminary-Prot1-Photomask was intended to be the photomask for Microfluidic-Preliminary-Prot1. From Fig. 12, there are 3 separate parts, the left and right parts are created equal with mirrored configurations which when assembled will be the upper and lower part of the microfluidic chamber. And in the middle part of the photomask, we can see 2 long lines, after the molding process, it is the villi that will be stacked in sandwiched configuration between the upper and lower chamber.
However, due to its complexity and high initial cost, considering 1 silicone wafer can only fabricate a single microfluidic chamber, and the assembly of the three parts needs very high accuracy, which will render our product unusable if it is not perfectly aligned. Due to the reasons above, we abandoned this design and eventually came up with Generation 1.
Flow Rate Calculation
In order to make the condition inside our microfluidics as close as possible to the human intestine, we have to calculate the proper flow rate. We use a widely used formula to calculate the flow rate of a model called Reynolds number [13]. But, after some research about the flow rate of the real human intestine, it is almost impossible for us to get the exact number, we finally assumed that the flow rate of our intestine is 1 mm/s
There had been several assumptions that we had made until finally settled with the flow rate of 1 mm/s, our primary consideration is from the average of the time it takes for food to pass through our entire small intestine (Duodenum, Jejunum, Ileum), and it takes around 2-6 hours[14,15] which we finally settled with 6 hours. After that, with the average length of the entire intestine, which is estimated to be 5500 mm[16], it is estimated that the flow rate is 15.2777 mm/minutes.
However, it turns out that the human intestine is not flowing constantly in one direction; instead, it has peristaltic motion that moves like a wave and generates 12 waves every minute[17]. So, we can assume that every wave propagates for 1.273 mm, with a speed averaging from 1 to 4 mm/s[17], so finally, we settle with the lowest number of flow rates which is 1 mm/s.
Then, we need to convert the real human intestine flow rate into the model flow rate using Reynolds number, which can be derived as :

Then, using the data provided in Table. 2, we can calculate the flow speed of the microfluid using the Reynolds number equation such as shown in Fig. 14, the assumption that the Reynolds number of human intestine is the same as the microfluidic condition is to make dynamic similarity[18] thus making the flow speed between the jejunum and microfluidic “similar”.
| Intestine | Microfluid | Units | |
|---|---|---|---|
| V | 1 | ? | mm/s |
| ρ | 1008 [19] | 1067.5[20] | kg/m3 |
| D | 24.5*10-3 | 0.49*10-3 | m |
| μ | 1.15*10-3[21] | 1*10-3[22] | Pa*s |

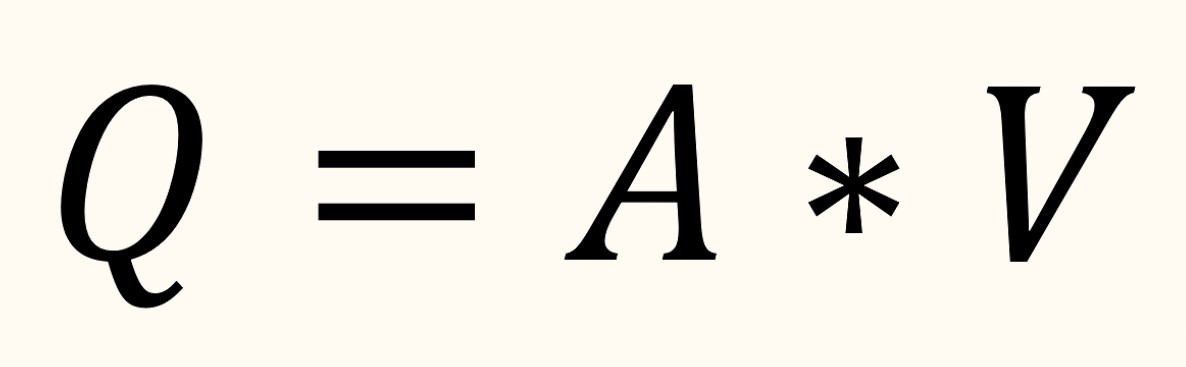
After the calculation using the formula above, we will get the flow speed of 0.041 m/s; we can calculate the flow rate of our microfluidic system using the formula shown in Fig. 15. with the assumption that our microfluidic chamber is tubular-shaped with a diameter of 0.49 mm, which will result in the flow rate of 27.833 ml/hr.
Experiment and Result
Experimental procedure
Without hyaluronic acid/ 5% HA (Hyaluronic acid)
- Adjust the heating plate to 45℃ ( with some heat conductivity losses, the temperature of the chip will be around 37.5℃), place Petri dish on top of the heating plate (to avoid any possible spillage), and put the microfluidic chip on top of it (don’t close the lid).
- Inject BSA (Bovine Serum Albumin) into the channel with a flow rate of 1 ml/hr for 6 minutes (or 100 μL) (For further explanation find out in Contribution, then prepare a reservoir for the excess flow as the leftover product.
- Inject 0.1 M PBS with the same flow rate for 3 minutes (or 50 μL) to wash out any excess BSA in the channel[23]. Wait until PBS entirely flows out of the channels.
- Prepare hyaluronic acid with PBS with the ratio of 1:19 to make a dilution of 20, mixed it well (PBS: 95% and hyaluronic acid: 5%).
- Inject the diluted hyaluronic acid into the channel with a 1 ml/hr flow rate for 3 minutes (or 50 μL) and wait for 5 minutes.
- Prepare a syringe with ±35 cm tube attached to the needle, then fill the syringe with ±1ml PBS (try to remove any air bubbles), suck 100 μL of pure Bacteria (E. coli Nissle) into the tube then inject it into the microfluidic channel with a flow rate of 1 ml/hr for 6 minutes (or 100 μL).
- Wait for 20 minutes.
- Inject PBS with a flow rate of 27.833 ml/hr and collect the liquid into a reservoir for 100 μL at a time
- Repeat step.8 consecutively three more times (use different collection reservoirs for four different samples).
- Dilute the collected solution ten times and detect OD values.
- Dilute the Bacteria (E. coli Nissle) 10 times with MQ water and detect the OD value as our control.

Result-OD600
In Generation 1 microfluidic experiment, we tried to compare the difference in retention ratio between various structures and the condition of 5% hyaluronic acid being added or not. From the bar chart (Fig. 17), we can observe that the result of each channel with 5% HA has a higher retention ratio than without HA added. Among microfluidic chips with 5% HA, the w/ CF+2villi channel has the highest retention ratio.Link to Proof of concept

In Generation 2 microfluidic experiment (Fig. 18), the overall retention ratio is lower than Generation 1. Our conclusion is that Generation 2 retention ratio is lower than Generation 1, because of the shorter distance between each circular fold. Even though the surface area of the circular folds is more extensive, which we thought would result in a higher boundary layer condition[24], the experiment data turned out to be less effective than Generation 1.

For a better understanding of the substantial result difference between Generation 1 and Generation 2, we provided two charts with apple to apple comparison, shown in Fig. 19.

Result-Microscope with Mercury Light
Other than checking the result of retention ratio using OD600, we also used a microscope equipped with a mercury lamp which enables us to have a better view of our E. coli Nissle (E. coli Nissle used in the experiment has sfGFP) stays throughout the channel.
Click the arrow to see more designs
Smooth

w/ CF

w/ CF+Villus

w/ CF+2Villi

Smooth

w/ CF

w/ CF+Villus

w/ CF+2Villi

Cost Estimation
Cost is divided into 3 categories: Initial investment for the mold, price per microfluidic chip, and price per experiment. As shown in Table 3, Table 4, and Table 5.
| Cost(NTD) | Cost(USD) | Explanation | |
|---|---|---|---|
| Silicon Wafer | 2900 | 96.67 | Piece(R~5 cm) |
| Photomask | 260 | 8.67 | Price per area |
| Silicon Wafer Workshop | 880 | 29.3 | Includes Photoresist(SU8) + manufacturing price |
| Total | 4040 | 134.67 | 1 USD ~ 30 NTD |
| Cost(NTD) | Cost(USD) | Explanation | |
|---|---|---|---|
| PDMS A & B | 1 | 0.04 | PDMS price per kg is 4 USD |
| Slide Glass | 1.2 | 0.04 | Price per piece |
| Petri Dish | 6 | 0.2 | Price per unit |
| Syringe & Needle | 4 | 0.13 | Price per unit |
| Epoxy Resin | 5 | 0.17 | Bulk price for Epoxy Resin varies between 3~5 USD for 15 ml |
| Gasses(O2 & N2) | 5 | 0.17 | The price of Oxygen and Nitrogen for an entire cylinder is 24 USD |
| Total | 22.5 | 0.75 | 1 USD ~ 30 NTD |
| Cost(NTD) | Cost(USD) | Explanation | |
|---|---|---|---|
| BSA(Bovine Serum Albumin) | 2 | 0.07 | The price for 100 ml pure BSA(should be dilute with water 1:25) is 113 USD |
| PBS Buffer | 1 | 0.04 | PBS was mixed by our lab |
| Lab tubing | 22 | 0.733 | The price for 50 ft is 25 USD, every experiment use about 45 cm |
| Pipette tips | 1.5 | 0.06 | |
| Total | 26.5 | 0.9 | 1 USD ~ 30 NTD |
Demonstration
References
- The Links Between Stress and Depression: Psychoneuroendocrinological, Genetic, and Environmental Interactions | The Journal of Neuropsychiatry and Clinical Neurosciences. The Journal of Neuropsychiatry and Clinical Neurosciences. Published 2020.
- Jakaria Md, Azam S, Haque MdE, et al. Taurine and its analogs in neurological disorders: Focus on therapeutic potential and molecular mechanisms. Redox Biology. 2019;24:101223. doi:10.1016/j.redox.2019.101223
- Collins JT, Nguyen A, Madhu Badireddy. Anatomy, Abdomen and Pelvis, Small Intestine. Nih.gov. Published August 11, 2021.
- Cronin CG, Delappe E, Lohan DG, Roche C, Murphy JM. Normal small bowel wall characteristics on MR enterography. European Journal of Radiology. 2010;75(2):207-211. doi:10.1016/j.ejrad.2009.04.066
- Zha J, Zou S, Hao J, et al. The role of circular folds in mixing intensification in the small intestine: A numerical study. Chemical Engineering Science. 2021;229:116079. doi:10.1016/j.ces.2020.116079
- Small Intestine. Imaging Anatomy: Chest, Abdomen, Pelvis. Published online 2017:636-665. doi:10.1016/b978-0-323-47781-9.50031-3
- https://quizlet.com/415552688/major-layers-of-the-digestive-tract-diagram/
- Villus | anatomy | Britannica. In: Encyclopædia Britannica. ; 2021.
- Bein A, Shin W, Jalili-Firoozinezhad S, et al. Microfluidic Organ-on-a-Chip Models of Human Intestine. Cellular and Molecular Gastroenterology and Hepatology. 2018;5(4):659-668. doi:10.1016/j.jcmgh.2017.12.010
- Materials for Microfluidic Chip Fabrication. ACS Publications. Published 2013.
- Medina A, Manuel J, Bravo C, Serrano-Medina A, Cornejo-Bravo J. Buffer Effects on Drug Release Kinetics From Acidic Hydrophobic Gel Discs Article. J Mex Chem Soc. 011(1):2-6.
- Fallingborg J. Intraluminal pH of the human gastrointestinal tract. Danish medical bulletin. 2011;46(3).
- Sci-Hub | Integrated Nano-Biomechanics || Biomechanics of the Digestive System | 10.1016/B978-0-323-38944-0.00003-6. Mksa.top. Published 2018.
- How Long Does Food Stay in Your Stomach? Healthline. Published August 10, 2020.
- Fielding S, McKnight JR. How long does it take to digest food? About 4 to 6 hours. Insider. Published April 16, 2021.
- Collins JT, Nguyen A, Madhu Badireddy. Anatomy, Abdomen and Pelvis, Small Intestine. Nih.gov. Published August 11, 2021.
- Kant Avvari R. Biomechanics of the Small Intestinal Contractions. Digestive System - Recent Advances. Published online January 8, 2020. doi:10.5772/intechopen.86539
- Tu J, Yeoh G-H, Liu C. Governing Equations for CFD: Fundamentals. Computational Fluid Dynamics. Published online 2018:65-124. doi:10.1016/b978-0-08-101127-0.00003-9
- Intestinal Juice. TheFreeDictionary.com. Published 2021.
- Phosphate Buffered Saline solution, 10X Concentrate | AmericanBio. Archive.org. Published 2020.
- Vamanu E. Effect of gastric and small intestinal digestion on lactic acid bacteria activity in a GIS1 simulator. Saudi Journal of Biological Sciences. 2017;24(7):1453-1457. doi:10.1016/j.sjbs.2015.06.028
- Yeom E, Kang YJ, Lee S-J. Changes in velocity profile according to blood viscosity in a microchannel. Biomicrofluidics. 2014;8(3):034110. doi:10.1063/1.4883275
- Tv Windvoel, M. Mbanjwa, N. Mokone, A. Mogale, K. Land. Surface Analysis of Polydimethylsiloxane Fouled with Bovine Serum Albumin. undefined. Published 2017.
- Boundary Layer. Nasa.gov. Published 2021.
- Icons made by Vitaly Gorbachev from www.flaticon.com
- Icons made by Freepik from www.flaticon.com
- Icons made by Eucalyp from www.flaticon.com
- Icons made by ultimatearm from www.flaticon.com