Team:NCKU Tainan/Results

Menbles Production Experiments
Goal
To test whether Menbles final product can effectively protect E. coli Nissle 1917 under different pH values of milk tea, and to compare which bubble size is the most capable to protect our bacteria.
Achievements
1. Proved that the bubble is effective to protect the bacteria inside by minimizing loss of bacteria, in the pH conditions of milk tea.
2. Identified which bubble size has the best structure based on recovery rates.
Process
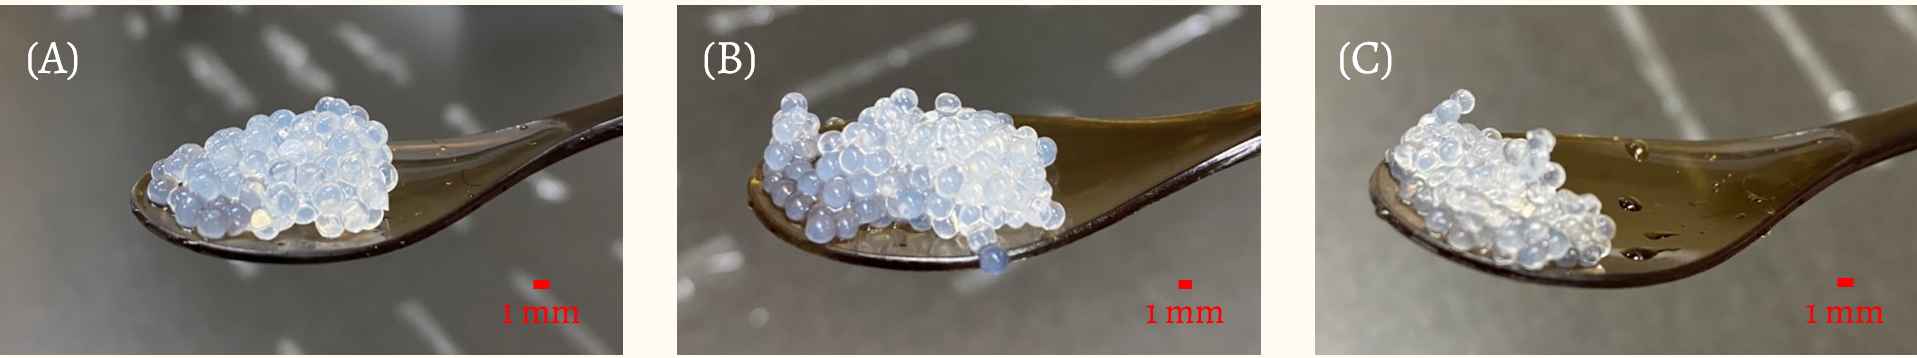
After we decided on sodium alginate and calcium chloride as the raw material for Menbles, we conducted several experiments to test the number of bacteria recovered from the bubble at different pH levels of milk tea (4.5, 5.0, 5.5, 7.0). Menbles is produced by mixing 2 ml of freshly cultured E. coli Nissle 1917 (OD600 = 1) with 50 ml of alginate solution, then using different sizes of laboratory pipettes we dripped 2.5 ml of the solution drop by drop into calcium chloride solution. As the result of different pipette sizes being used, there are three different sizes of the bubble, with the volumes approximately equal to 14.14 mm3 (Large), 4.19 mm3 (Medium), and 1.77 mm3 (Small).

Then, the bubbles were extracted from calcium chloride solution through filtration, which would be equally distributed and submerged into 12.5 ml of disodium hydrogen diphosphate buffer with 4 different pH levels for 2 hours at room temperature.
After the bubbles were submerged for 2 hours, 60 μl of supernatant from every pH sample was smeared culture into LB plate medium, and the rest of the bubbles were separated from the buffer than would be crushed with the compression of a syringe. The crushed bubble should be submerged back into its original buffer, then 60 μl of supernatant samples were smeared again to another LB medium. Negative controls were also smeared into LB medium which involves buffer without any bubble present to identify any possible contamination.
After the plates were incubated for 12 hours at 37°C, CFU quantification was conducted to determine the bacteria recovery rate from the bubble. By calculating the amount of bacteria supposed to be inside the bubble in each pH buffer, we can approximate the percentage of bacteria recovered both in the supernatant and the crushed bubble. The results shown in Fig. 3. are the bacteria recovery rate of the large, medium, and small bubbles, with additional negative control plates did not grow any colonies, so the results obtained are devoid of any contamination.

Based on the results shown in Fig. 3, we concluded that the bubble with a volume of 4.19 mm3 (Medium) delivers the best results due to its stable recovery rate and suits our hypothesis of a lower pH will lower down the bacteria loss.
Oxidative Stress Sensing
Plasmid Construction for Oxidative Stress Assay
Achievement
1. Construction of the plasmid containing different promoters that can detect oxidative stress.
Process
In E. coli, there are two main promoters that can detect oxidative stress, the katG promoter (PkatG) (BBa_K3771047) and the soxS promoter (PsoxS) (BBa_K3771048). To determine which promoter to use in our final biobrick in order to express the taurine-producing enzyme, an oxidative stress assay is essential. Hence, we need to construct plasmids with different promoters and utilize the reporter, sfGFP, to determine the intensity and sensitivity of both promoters.
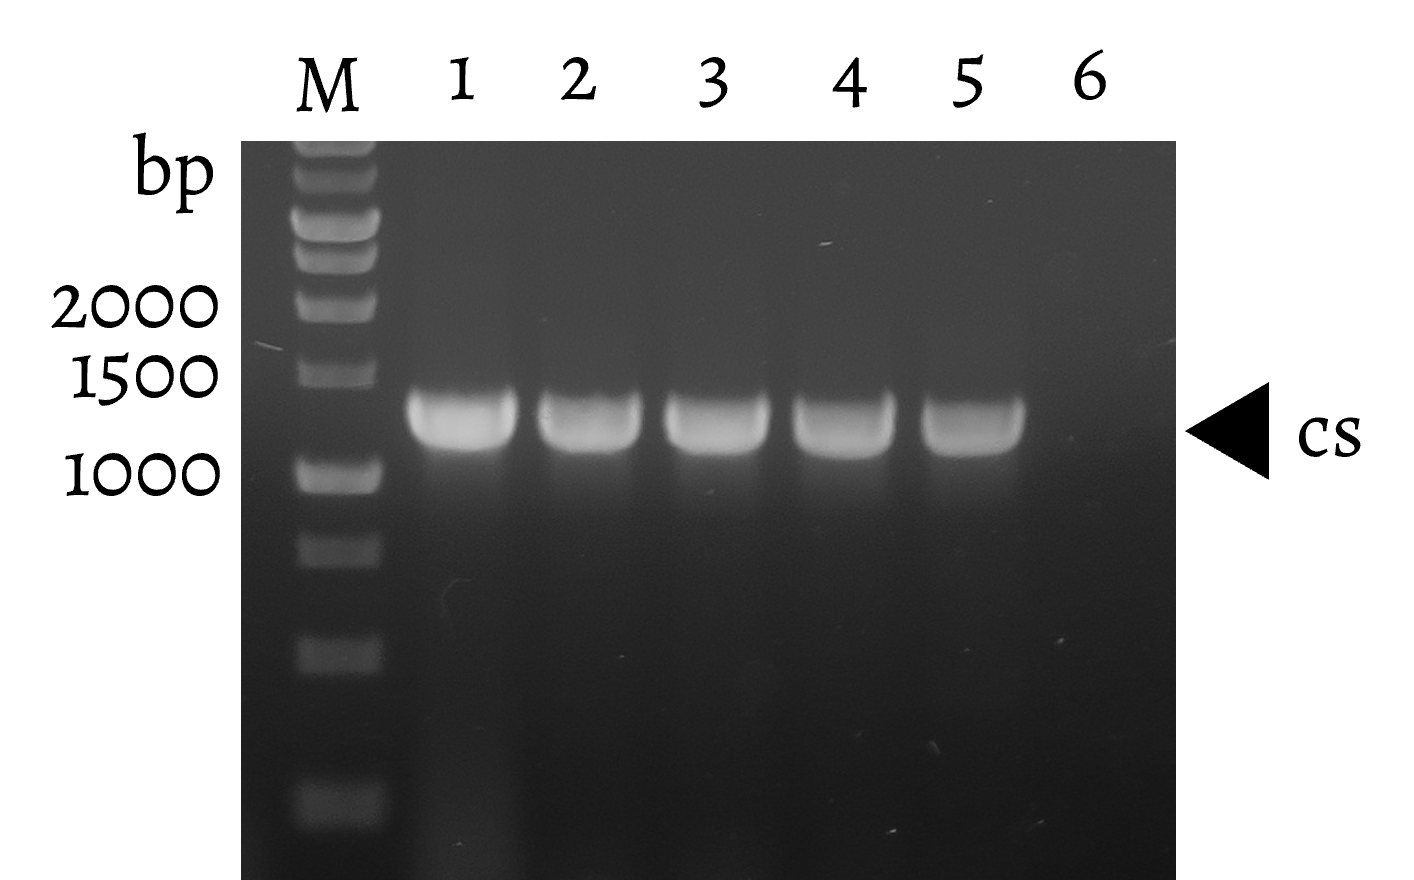
First, we conducted PCR to amplify the fragment of PkatG, PsoxS, and soxR gene with PsoxS from the chromosome of E. coli MG1655. SoxR is a transcriptional activator of PsoxS. The fragments were used to replace J23100 promoter in pSAA-J23100-sfgfp (BBa_K3771050). We obtained three new plasmids, pSAA-PkatG-sfgfp (BBa_K3771091), pSAA-PsoxS-sfgfp (BBa_K3771092), and pSAA-soxR-PsoxS-sfgfp (BBa_K3771093). To ensure the correctness of the sequence, we conducted colony PCR after transformation and the result showed that the plasmid contains the correct sequence (Fig. 4).

Oxidative Stress Assay
Achievement
1. Compared the intensity and sensitivity of different promoters under the stimulation by oxidative stress.
2. Selected a suitable promoter for regulating the expression of L-cysteine sulfinic acid decarboxylase (CSAD).
Process
We compared the relative fluorescence intensity of sfGFP expressed by different promoters when induced by different concentrations of paraquat (PQ). Paraquat can react with oxygen to produce various types of reactive oxygen species (ROS), such as superoxide radical (O2−•), hydrogen peroxide (H2O2), and hydroxyl radical (OH−•)[5], which is used to simulate abnormal oxidative stress in the intestines of stressed individuals.
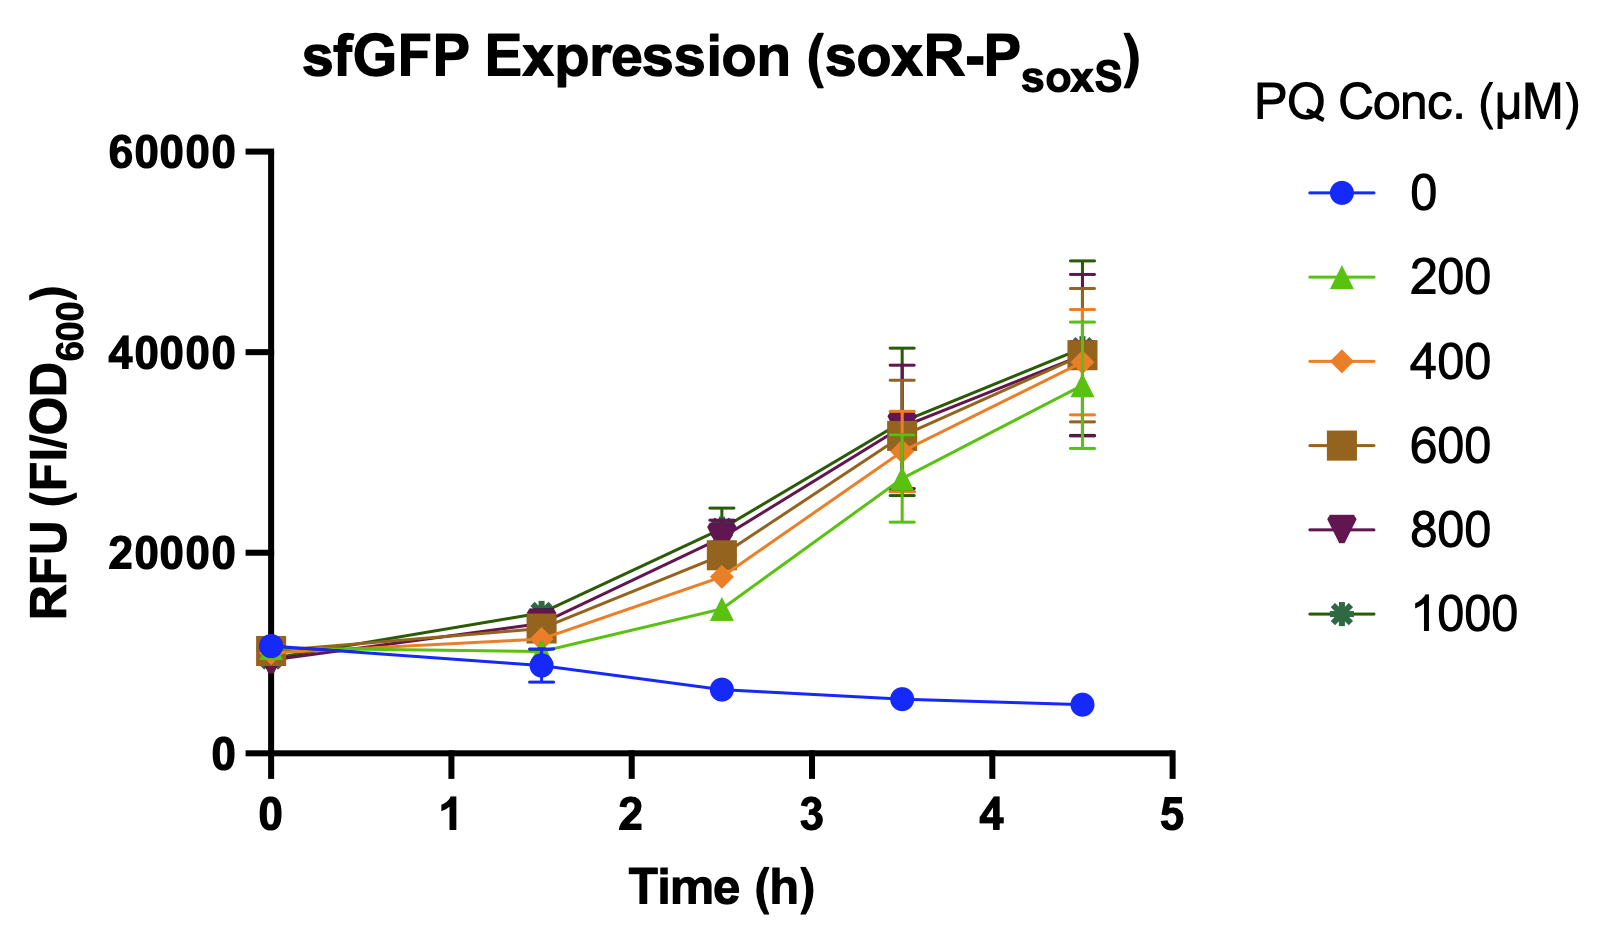
Over a period of 4.5 hours after paraquat was added, the relative fluorescence intensity was measured. J23100, a constitutive promoter, being the positive control, shows no difference in sfGFP expression level between the samples with and without paraquat. The activity of PsoxS (BBa_K3771048) is higher than that of PkatG (BBa_K3771047), but the activity is greatest when the SoxR transcription factor (BBa_K3771100) is added in the construction together with PsoxS (Fig. 5 and 6).


Another oxidative stress assay was performed only with SoxR and PsoxS promoter to determine the efficiency of this detection system. The sfGFP level was measured hourly during the 4.5 hours after paraquat induction, and results showed that even low concentrations of paraquat were able to activate the detection system (Fig. 7 and 8).

Plasmid Construction for CSAD Enzyme Expression
Achievements
1. Construction of the plasmid containing the soxRS regulon and the csad gene.
Process
After confirming the function of soxR-PsoxS, the coding sequence of sfGFP was replaced with the csad gene (BBa_K3771008), resulting in a new plasmid - pSAA-soxR-PsoxS-csad-6xHis (BBa_K3771097). This plasmid is essential for producing taurine in our project, and the 6xHis-tag was designed for detecting the expressed protein through western blot. We conducted colony PCR after transformation to verify whether E. coli uptook the correct plasmid. The size of the PCR product was as expected (Fig. 9). The plasmid was also confirmed by sequencing and has no mutations.

Enzyme (CSAD) Production
Achievements
1. Confirmation of CSAD (BBa_K3771008) enzyme expression under oxidative stress by western blot.
Process
To confirm that the CSAD enzyme is successfully expressed when induced by paraquat, the western blot was performed. When the OD600 of the bacterial culture reached 0.5, we added 0.1 mM paraquat into the culture and collected samples at 2, 4, 6 hours after paraquat was added. The result confirmed that CSAD was expressed under oxidative stress. The sample collected at 6 hours after paraquat was added had the greatest expression, and CSAD expression increases as the time allowed for paraquat to induce the SoxS promoter increases (Fig. 10).

Interferon-gamma Sensing System and Production
Plasmid Construction for IFN-γ Induction Assay
Achievements
1. Constructed PpspA-ofp-PlacI-ompA/oprF (BBa_K3771017) and PpspA-ofp-PompA-ompA/oprF (BBa_K3771018) plasmids for the IFN-γ induction assay
Process
For the IFN-γ induction assay, OFP is used as the reporter to compare the strengths of the lacI promoter (BBa_R0010) and the ompA promoter (BBa_K3771011). Therefore, two plasmids with the respective promoters were constructed, while also containing the pspA promoter (BBa_K3071013) required for the activation of the IFN-γ sensing system.
First, the pspA promoter synthesized by IDT was amplified by PCR and then ligated to the ofp gene (BBa_K156009), already present in our starting pUC cloning vector, resulting in PpspA-ofp (BBa_K3771014). To construct PlacI-ompA/oprF (BBa_K3771015), lacI promoter in our starting pUC cloning vector, was ligated with the ompA/oprF fragment (BBa_K3771009) synthesized by IDT. We then cloned the ompA promoter sequence (BBa_K3771011) from E. coli MG1655 and replaced lacI promoter with ompA promoter, resulting in PompA-ompA/oprF (BBa_K3771016).
Both the PlacI-ompA/oprF (BBa_K3771015) and PompA-ompA/oprF (BBa_K3771016) fragments were double digested and ligated to the PpspA-ofp vector (BBa_K3771014), respectively, which formed the final plasmids required for the IFN-γ assay: PpspA-ofp-PlacI-ompA/oprF (BBa_K3771017) and PpspA-ofp-PompA-ompA/oprF (BBa_K3771018) plasmids.


IFN-γ Induction Assay
Achievements
1. Selected a suitable promoter for regulating the expression of chimeric OmpA/OprF protein
2. Determined the minimum IFN-γ concentration required for activation of the sensing system
3. Determined the time required for the system to produce a significant difference in protein expression
Process
The two plasmids PpspA-ofp-PlacI-ompA/oprF (BBa_K3771017) and PpspA-ofp-PompA-ompA/oprF (BBa_K3771018) were transformed into ompA gene knockout strain, JW0940, to prevent OmpA from interfering with IFN-γ binding to chimeric OmpA/OprF. Human IFN-γ of concentrations 300 pM and 600 pM were added to bacteria cultures to induce the system. OFP expression (RFU) was recorded using a microplate reader and normalized by OD600. As shown in Fig. 13 and 14, starting at around 12 hours after induction, OFP expression of both samples increased dramatically.
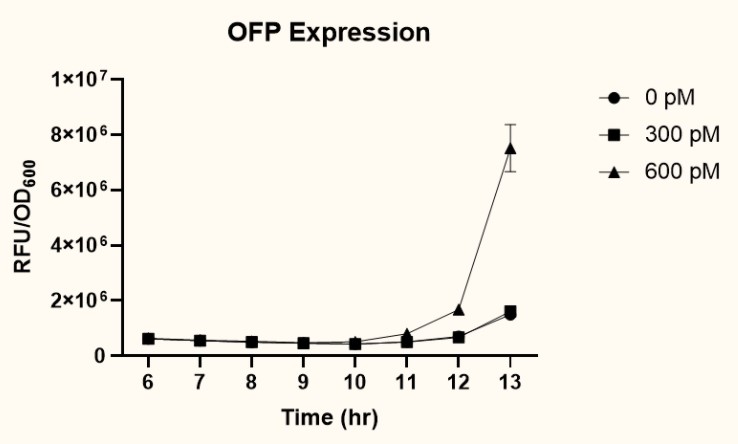

As presented in Fig. 15, at 12 hours after induction, sample 2 (PpspA-ofp-PompA-ompA/oprF) (BBa_K3771018) with the addition of 600 pM IFN-γ had higher OFP expression than that of sample 1 (PpspA-ofp-PlacI-ompA/oprF) (BBa_K3771017). Since ompA promoter stimulates higher protein expression than lacI promoter, we decided to incorporate the ompA promoter in our final biobrick to regulate the expression of CS.

Plasmid Construction for CS Enzyme Expression
Achievements
1. Completed construction of the plasmid PpspA-cs-6xHis-PompA-ompA/oprF (BBa_K3771044) for confirming expression of CS (BBa_K3771012) when induced by IFN-γ
Process
In our final biobrick, the production of CS is regulated by the IFN-γ sensing system. For CS expression to be confirmed by western blot, a 6xHis-tag sequence was attached to the 3’ end of the cs sequence.
First, ofp (BBa_K156009) in PpspA-ofp (BBa_K3771014) was replaced with the cs enzyme sequence, resulting in PpspA-cs-6xHis (BBa_K3771039). Similar to the construction of plasmids for the IFN-γ assay, PompA-ompA/oprF (BBa_K3771016) was double digested and ligated to the PpspA-cs-6xHis vector. The final PpspA-cs-6xHis-PompA-ompA/oprF (BBa_K3771044) is induced by IFN-γ, and its expression was confirmed by western blot (Fig. 16).

Chimeric OmpA/OprF Expression
Achievements
1. Confirmed the expression of chimeric OmpA/OprF protein (BBa_K3771009)[1].
Process
The two plasmids PpspA-ofp-PlacI-ompA/oprF (BBa_K3771017) and PpspA-ofp-PompA-ompA/oprF (BBa_K3771018) were transformed into ompA gene knockout strain, JW0940, to prevent simultaneous expression of both OmpA (BBa_K3771010) and chimeric OmpA/OprF in the same sample. Then, western blot was performed to confirm that the chimeric OmpA/OprF protein can be expressed in the E. coli membrane.
As shown in Fig. 17, MG1655 strain in lane 1 expresses OmpA, the positive control, and serves as comparison to chimeric OmpA/OprF. In lane 2, the ompA gene knockout strain, JW0940, with no transformed plasmid is the negative control. In lanes 3 and 4, chimeric OmpA/OprF (~39 kDa) is successfully expressed in JW0940, albeit in lower amounts compared to that of OmpA (~35kDa).

Enzyme (CS) Production
Achievements
Confirmed CS expression by western blot when under regulation of the IFN-γ sensing system.
Process
The plasmid with PpspA-cs-6xHis-PompA-ompA/oprF (BBa_K3771044) was transformed into ompA gene knockout strain JW0940 to prevent OmpA from interfering with IFN-γ binding to chimeric OmpA/OprF. Human IFN-γ concentrations of 600pM and 1200pM were added to bacteria cultures, which were then incubated at 37°C. Bacterial pellets of each sample were collected at 6 and 12 hours after IFN-γ induction.
Western blot of the collected samples was performed to confirm the expression of CS enzyme after IFN-γ induction. Although CS enzyme is successfully expressed, the results are not as expected, since even without IFN-γ, CS enzyme is produced (Fig. 18).

In the future, we hope to improve the sensitivity of the pspA promoter (BBa_K3071013) by adding an inhibitor or another transcriptional element to the biobrick so that this sensing system could function more properly according to the fluctuation of IFN-γ.
Proof of Function: Taurine Production
In Vitro vs In Vivo testing
In vitro testing refers to experiments conducted outside the living organism, while in vivo testing refers to research done in the living organism. To determine taurine production that most closely resembles that of the human intestine, we wanted to conduct in vivo testing of the function of the JJU-CoaBC pathway. However, transformation of both JJU and CoaBC plasmids into one bacteria failed and no colonies grew. Therefore, the JJU and CoaBC plasmids were transformed and cultured separately, and JJU and CoaBC supernatants were added to a reaction solution. In this case, since the substrates are added after incubation, this is considered as in vitro testing of taurine production by JJU and CoaBC.
In our second attempt to conduct in vivo testing of taurine production, we used the enzymes of the other taurine production pathway, including CSAD, CS, and CDO1 enzymes, which are not naturally found in the human body. There was successful transformation of the three plasmids into one bacterial colony, so in vivo tests of taurine production of these enzymes were conducted.
The step by step in vitro and in vivo testing of the taurine production pathways are described in the following sections.
Plasmid Construction
Achievements
Constructed the plasmids required for determining the taurine production yield:
1. For in vitro testing: PT7-jju (BBa_K3771079) and PT7-coaBC (BBa_K3771080)
2. For in vivo testing: Ptrc-csad (BBa_K3771077), Ptrc-cdo1 (BBa_K3771075) , Ptrc-cs (BBa_K3771078), and PlacI-csad (BBa_K3771076)
Process
Plasmid construction for In Vitro Enzyme Testing
To construct PT7-jju (BBa_K3771079), the jju (BBa_K3771000) sequence synthesized by IDT was amplified by PCR and ligated to T7 promoter (BBa_I719005) in the pET28a cloning vector. Similarly, coaBC sequence (BBa_K3771001) synthesized by IDT was amplified by PCR and ligated in the same cloning vector. Digestion results are shown in Fig. 19 and 20.


Plasmid construction for In Vivo Enzyme Testing
Ptrc-csad (BBa_K3771077) plasmid was constructed by ligating the amplified csad (BBa_K3771003) fragment to the trc promoter (BBa_K864400) in the pSUI cloning vector. Ptrc-cdo1 (BBa_K3771075), cloned into the pSB4K1 vector, and PlacI-csad (BBa_K3771076), cloned into the pSAA vector, were constructed using the same process. Digestion results are shown in Fig. 21, 22, and 23.

In Vitro Tests for Taurine Production by JJU-CoaBC
Achievements
1. In vitro Test 1&2: Chose suitable E. coli strains for taurine production of JJU (BBa_K3771000) and CoaBC (BBa_K3771001)enzymes
2. Determined the taurine production of JJU and CoaBC enzymes[2,3]
Results
In Vitro Test 1: Taurine Production of JJU and CoaBC in BL21(DE3)
PT7-jju (BBa_K3771000) and PT7-coaBC (BBa_K3771080) were each transformed into the BL21(DE3) strain. Supernatants (S) were collected to confirm extracellular enzyme expression and later, taurine production. The proteins in supernatant samples contain folded proteins and enzymes ready to function. On the other hand, bacterial pellets were washed and lysed to prepare whole cell (WC) samples to determine intracellular proteins, which contain a higher concentration of unfolded proteins. JJU and CoaBC expression in both supernatants and whole cell samples were confirmed by SDS-PAGE (Fig. 24).


2:1 ratio of JJU to CoaBC supernatant volume had the highest taurine production (Fig. 25). Because JJU concentrations were lower, two times as much JJU supernatant volume compared to CoaBC supernatant volume was required to produce a significant amount of taurine.
In Vitro Test 2: Taurine Production of JJU in BD7G and CoaBC in BL21(DE3)
Since JJU expression in BL21(DE3) strain was not prominent in the supernatant, we performed another in vitro test in which PT7-coaBC (BBa_K3771080) was transformed into the BL21(DE3) strain, while PT7-jju (BBa_K3771000) was transformed into the BD7G strain instead of the BL21(DE3) strain. The BD7G strain contains chaperone protein GroELS that aids in protein folding[4]. SDS-PAGE results confirm JJU and CoaBC expression in all samples (Fig. 26).


PT7-coaBC (BBa_K3771080) was transformed into the BL21(DE3) strain, while PT7-jju (BBa_K3771000) was transformed into the BD7G strain instead of the BL21(DE3) strain. The BD7G strain contains chaperone protein GroELS that aids in protein folding[4]. SDS-PAGE results confirm JJU and CoaBC expression in all samples (Fig. 26).
The whole cell and supernatant JJU and CoaBC samples are collected and added in a JJU:CoaBC volume ratio of 1:1, 2:1, and 1:2. In In Vitro Test 1, a greater volume of JJU sample was needed to produce the maximum amount of taurine. However, this time when PT7-jju was transformed into the BD7G strain, 1:1 ratio of JJU to CoaBC supernatant had the highest taurine production (Fig. 27). This suggests the activity level of JJU does not significantly differ from that of CoaBC, and both are equally crucial and effective in converting L-cysteine to taurine.
In Vivo Tests for Taurine Production by CS-CSAD-CDO1
Achievements
1. In Vivo Test 1: Selected the medium in which taurine production is greatest for the CDO1 (BBa_K3771004), CSAD (BBa_K3771003), and CS (BBa_K3771002) enzymes[5]
2. In Vivo Test 2: Determined extracellular taurine concentrations in ∆tauD, ∆tauD-∆ompA double knockout (DkO), and TOP10 strains
3. In Vivo Test 3: Determined intracellular taurine concentrations in DkO and TOP10 strains
4. In Vivo Test 4: Determined taurine production yield under the regulation of the oxidative stress sensing system
Results
In Vivo Test 1: Choosing a Growth Medium
Since the intestine is not as nutrient-rich as LB (lysogeny broth), we chose to test taurine production in both LB and M9 (minimal salts) mediums. M9 consists of fewer nutrients than LB and more closely mimics the nutrient composition of the human intestine.
First, Ptrc-cdo1 (BBa_K3771075), PlacI-csad (BBa_K3771076), and Ptrc-cs (BBa_K3771078) were transformed into DH5α strain. In another sample, only Ptrc-cdo1 and Ptrc-csad (BBa_K3771077) were transformed. The two samples were each grown in LB with IPTG inducer (LB+), M9 with IPTG inducer (M9+) , and M9 without IPTG inducer (M9-) mediums.
The samples’ respective growth curves are shown in Fig. 28 and 29. Interestingly, the sample with all three enzymes (Ptrc-cdo1 +PlacI-csad +Ptrc-cs) had a lower growth rate in M9+ medium than in M9- medium. In the sample with two enzymes (Ptrc-cdo1+Ptrc-csad), M9 medium with or without an inducer added produced similar growth curves. Both samples grew best in LB (Fig. 28, 29).
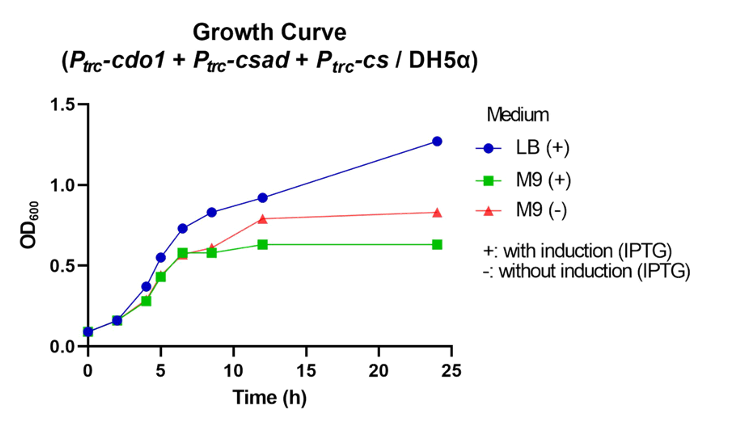
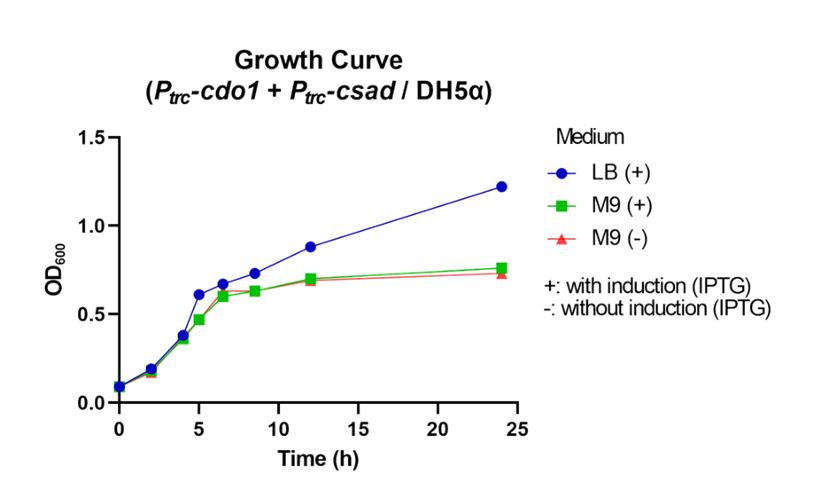
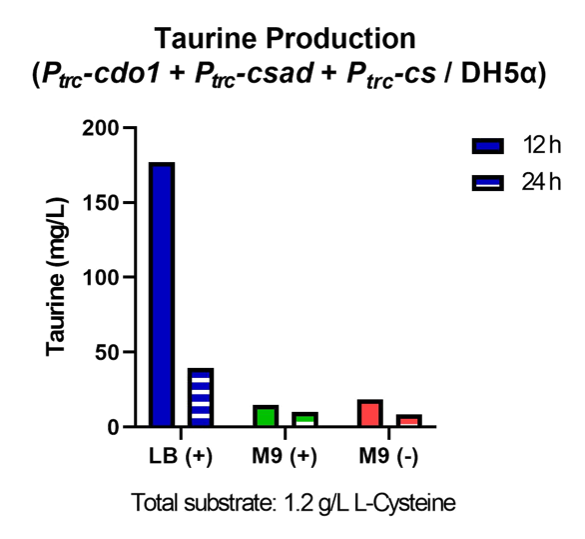
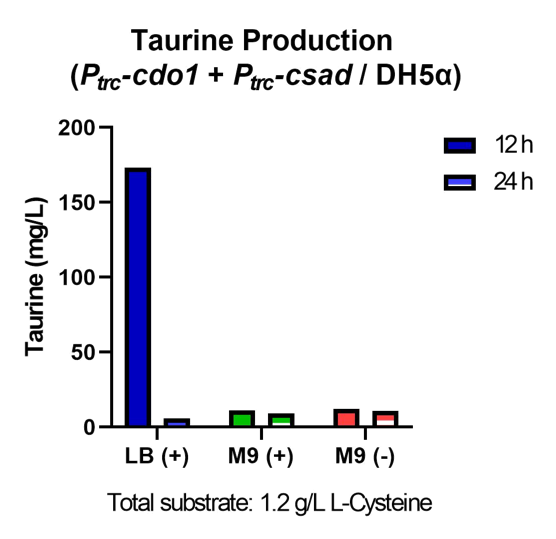
Taurine concentrations were highest at 12 hours when grown in LB (Fig. 30, 31). However, at 24 hours, taurine levels in all three mediums were very low. To more easily detect and quantify taurine production, we decided to use LB medium for the rest of the in vivo taurine production experiments. In addition, because there is no difference in taurine produced with or without CS, we decided to conduct the rest of the experiments with CSAD and CDO1 enzymes. In the future, we hope to perform more experiments with the CS enzyme.
In Vivo Test 2: Determining Extracellular Taurine Concentrations in Different E. coli Strains
Once the taurine production enzymes are expressed, they can be found intracellularly and extracellularly, resulting in different taurine concentrations inside and outside the bacteria. To determine extracellular taurine, the supernatants of the bacteria culture samples are collected, and taurine production was compared between different knockout strains.
For sample preparation, Ptrc-cdo1 (BBa_K3771075) and Ptrc-csad (BBa_K3771077) are each transformed into ∆tauD (taurine dioxygenase gene deletion), ∆tauD-∆ompA (tauD and ompA gene deletion) double knockout (DkO), and TOP10 strains. In the ∆tauD strain, the deletion of the taurine dioxygenase gene prevents taurine from degradation by catabolic enzymes in the cell. In addition to the tauD gene deletion, the ompA gene is also knocked out in the ∆tauD-∆ompA double knockout strain, which prevents OmpA from interfering with IFN-γ binding to chimeric OmpA/OprF for the IFN-γ sensing system. TOP10 strain contains no gene deletions and serves as the control. More information about how the tauD and ompA genes were knocked out can be found in the Engineering page.
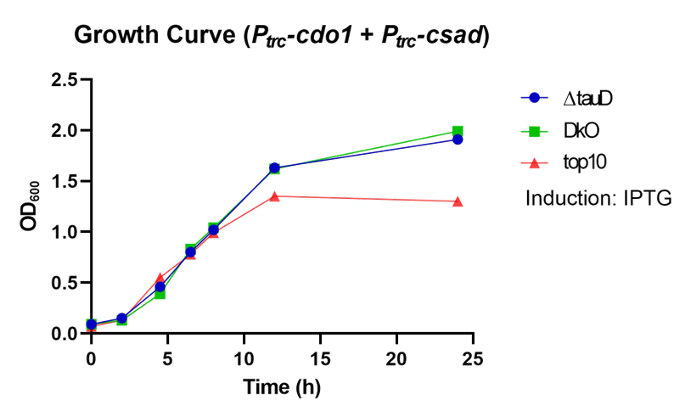
For ∆tauD and DkO strains, OD600 of samples with no transformed plasmid were also recorded, serving as the negative control group (Fig. 33, 34). Even with a transformed plasmid, the bacteria still show adequate growth.


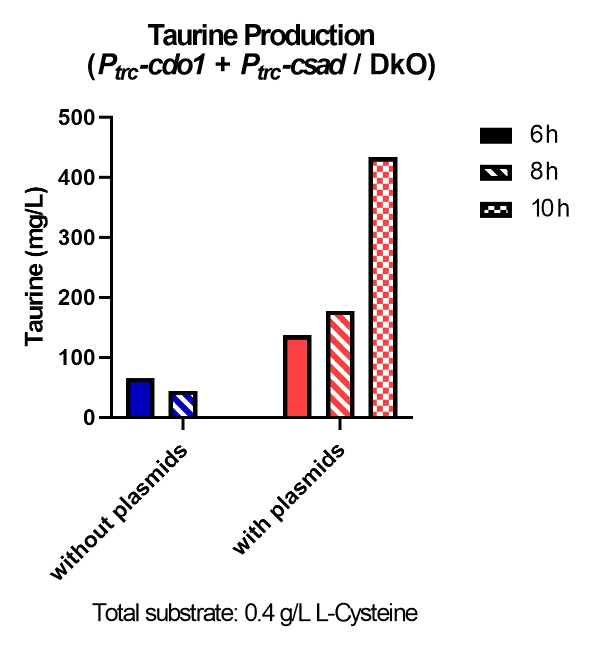
Extracellular CSAD and CDO1 expression at 8 and 10 hours after incubation were confirmed by SDS-PAGE (Fig. 35, 36).


Taurine was successfully produced in ∆tauD, DKO, and TOP10 strains (Fig. 37) Taurine concentration is highest at 10 hours after incubation for both the ∆tauD and DKO strains (Fig. 38, 39). After confirming extracellular taurine concentrations by the DkO strain, we continued the following in vivo tests with the DkO strain.


In Vivo Test 3: Determining Intracellular Taurine Concentration in the DKO Strain
To further understand the bacteria’s taurine production, we conducted another in vivo experiment to determine intracellular taurine concentration in the DkO and TOP10 strains. Instead of measuring taurine concentrations in the supernatants of the samples as we did for extracellular concentrations, intracellular taurine concentrations were determined by conducting HPLC on lysed bacterial pellets of each sample.
For sample preparation, Ptrc-cdo1 (BBa_K3771075) and Ptrc-csad (BBa_K3771077) are each transformed into the DKO strain and TOP10 strain. Growth curves in each of the strains are shown in Fig. 40.

Expression of CSAD and CDO1 in both supernatant and whole cell samples was confirmed by SDS-PAGE (Fig. 41).


To determine intracellular taurine concentration, HPLC was conducted on the whole cell samples, which contain all soluble proteins within the bacteria. Although CSAD expression is higher in the supernatant sample of the TOP10 strain than in the DKO strain according to SDS-PAGE results (Fig. 41), DKO strain still produced more taurine than the TOP10 strain (Fig. 42). This proves that the deletion of the tauD gene is crucial in increasing taurine concentrations.
In Vivo Test 4: Taurine Production Under the Regulation of the Oxidative Stress Sensing System
From the previous in vivo tests, we proved that the DKO strain with our transformed plasmids can successfully express CDO1 and CSAD and produce taurine. In the final in vivo test, the trc promoter in Ptrc-csad was changed to the soxS promoter to determine extracellular taurine production under the regulation of the oxidative stress sensing system.
For sample preparation, Ptrc-cdo1 (BBa_K3771077) and soxR-PsoxS-csad of the oxidative stress sensing system were both transformed into the DKO strain. Since IPTG is not naturally found in the human body, lactose was also added as an inducer instead of IPTG to consider taurine production in the intestine. Paraquat was added to induce the oxidative stress system. The growth curve is shown in Fig. 43 below.
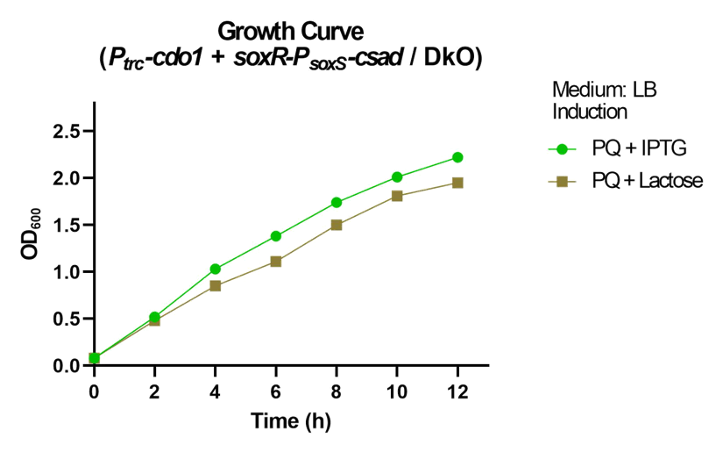
CSAD and CDO1 expression after 8 hours of incubation was successful as shown in the SDS-PAGE results (Fig. 44).

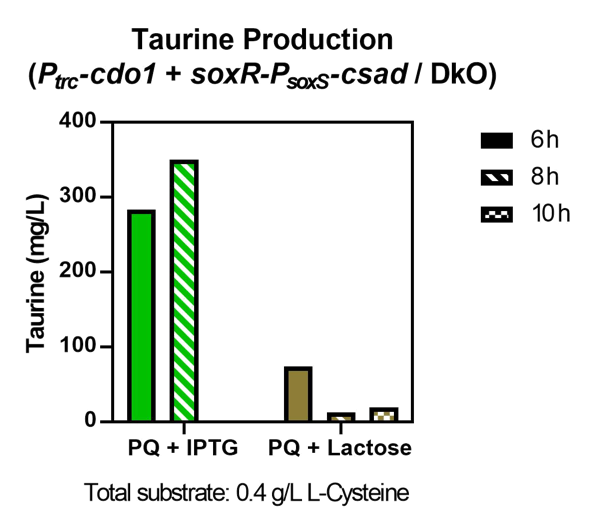
The oxidative stress sensing system successfully expressed CSAD which aided in the production of taurine. Although having a lower taurine concentration than the IPTG-induced sample, the lactose-induced sample proves that the oxidative sensing system also has the potential to activate the bacteria’s taurine production in the human intestine (Fig. 45).
In conclusion, from the experiment data collected through four in vivo tests, we proved that our bacteria with the tauD gene deletion can successfully produce taurine when under oxidative stress. To increase E. coli’s specificity in detecting and responding to depressive symptoms, we hope to exchange the lactose-induced trc promoter with the biobrick of the IFN-γ sensing system for the regulation of CDO1 expression.
References
- Aurand TC, March JC. Development of a synthetic receptor protein for sensing inflammatory mediators interferon‐γ and tumor necrosis factor‐α. Biotechnology and Bioengineering. 2016;113(3):492-500. doi:10.1002/bit.25832
- BRENDA - Information on EC 4.4.1.10 - cysteine lyase. Brenda-enzymes.org. Published 2021. Accessed October 6, 2021. https://www.brenda-enzymes.org/enzyme.php?ecno=4.4.1.10
- Mendes V, Green SR, Evans JC, et al. Inhibiting Mycobacterium tuberculosis CoaBC by targeting an allosteric site. Nature Communications. 2021;12(1). doi:10.1038/s41467-020-20224-x
- Yu T-H, Yi Y-C, Shih I-Tai, Ng I-Son. Enhanced 5-Aminolevulinic Acid Production by Co-expression of Codon-Optimized hemA Gene with Chaperone in Genetic Engineered Escherichia coli. Applied Biochemistry and Biotechnology. 2019;191(1):299-312. doi:10.1007/s12010-019-03178-9
- Sung Ok Han et. al. Creating a New Pathway in Corynebacterium glutamicum for the Production of Taurine as a Food Additive. J. Agric. Food Chem. 2018, 66, 13454−13463Sung Ok Han et. al. Creating a New Pathway in Corynebacterium glutamicum for the Production of Taurine as a Food Additive. J. Agric. Food Chem. 2018, 66, 13454−13463