Difference between revisions of "Team:NCKU Tainan/Improvement"
Minghan1005 (Talk | contribs) |
Minghan1005 (Talk | contribs) |
||
| Line 122: | Line 122: | ||
<!-- put link in href & src , width in a can adjust--> | <!-- put link in href & src , width in a can adjust--> | ||
<a href="https://static.igem.org/mediawiki/2021/0/0b/T--NCKU_Tainan--improvement2.png" target="_blank" style="width:50%"><img src="https://static.igem.org/mediawiki/2021/0/0b/T--NCKU_Tainan--improvement2.png" alt="" title="" style="width:100%"></a> | <a href="https://static.igem.org/mediawiki/2021/0/0b/T--NCKU_Tainan--improvement2.png" target="_blank" style="width:50%"><img src="https://static.igem.org/mediawiki/2021/0/0b/T--NCKU_Tainan--improvement2.png" alt="" title="" style="width:100%"></a> | ||
| − | + | <figcaption>Fig. 3. soxR-P<sub>soxS</sub>-sfGFP</figcaption> | |
</figure> | </figure> | ||
</div> | </div> | ||
| Line 128: | Line 128: | ||
</div> | </div> | ||
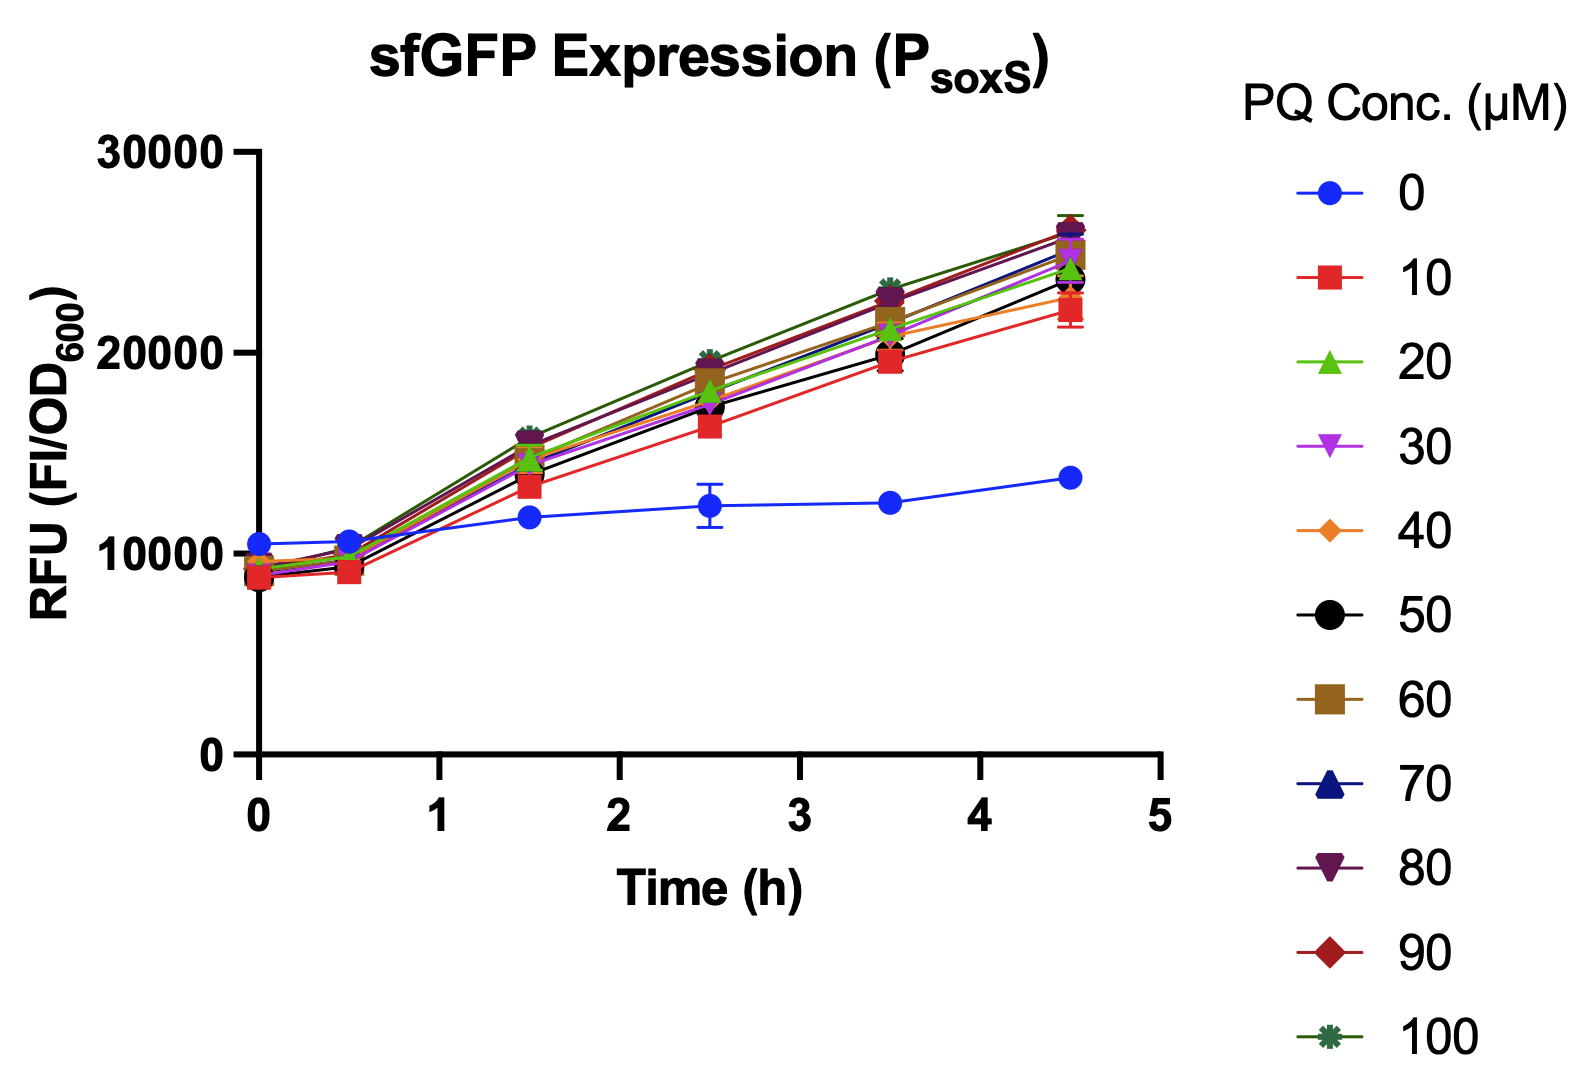
| − | <p> | + | <p> In this experiment, an overnight culture was prepared, diluted 10 times and transferred into the 96 well plate. The inducer (paraquat-PQ) was added after incubating in 37 °C.The sfGFP expression level was measured hourly during the 4.5 hours after paraquat induction using an ELISA reader.</p> |
| − | <p> | + | <p> We compared sfGFP expression levels of soxS promoter with and without the activation of SoxR transcription factor. As shown in Fig. 3., sfGFP expression levels were higher with SoxR than without SoxR. In addition, there was no leakage problem after we added SoxR into our biobrick<sup>[<a href="#ref4">4</a>]</sup>.[Fig. 4]</p> |
| − | + | <div class="container-fluid p-0"> | |
| + | <div class="row no-gutters"> | ||
| + | <div class="col-lg "> | ||
| + | <figure class="d-flex flex-column justify-content-center align-items-center px-lg-3"> | ||
| + | <!-- put link in href & src , width in a can adjust--> | ||
| + | <a href="https://static.igem.org/mediawiki/parts/6/63/T--NCKU_Tainan--Low_sfGFP_Expression_%28PsoxS%29.png" target="_blank" style="width:50%"><img src="https://static.igem.org/mediawiki/parts/6/63/T--NCKU_Tainan--Low_sfGFP_Expression_%28PsoxS%29.png" alt="" title="" style="width:100%"></a> | ||
| + | <a href="https://static.igem.org/mediawiki/parts/3/33/T--NCKU_Tainan--Del_Low_sfGFP_Expression_%28soxR-PsoxS%29.png" target="_blank" style="width:50%"><img src="https://static.igem.org/mediawiki/parts/3/33/T--NCKU_Tainan--Del_Low_sfGFP_Expression_%28soxR-PsoxS%29.png" alt="" title="" style="width:100%"></a> | ||
| + | <figcaption>Fig. 4. Leakage problem was perfectly solved after the improvement.</figcaption> | ||
| + | </figure> | ||
| + | </div> | ||
| + | </div> | ||
| + | </div> | ||
| + | <p> Please visit <a href="https://2021.igem.org/Team:NCKU_Tainan/Results">Results page</a> for more information.</p> | ||
| + | |||
| + | |||
| + | </section> | ||
<section class="ref"> | <section class="ref"> | ||
| Line 136: | Line 151: | ||
<ol> | <ol> | ||
<!--id name must corespond --> | <!--id name must corespond --> | ||
| − | <li id="ref1">https:// | + | <li id="ref1">Overkamp W, Beilharz K, Detert Oude Weme R, et al. Benchmarking Various Green Fluorescent Protein Variants in Bacillus subtilis, Streptococcus pneumoniae, and Lactococcus lactis for Live Cell Imaging. <i>Applied and Environmental Microbiology</i>. 2013;79(20):6481-6490. doi:10.1128/aem.02033-13</li> |
| − | <li id=" | + | <li id="ref2"><i>Creation, Expression, Purification and Characterization of GFP G4b GFP Expression and Melting Curves.<a href="https://www.biophysik.physik.uni-muenchen.de/teaching/laboratory_courses/gfp_expression/g4b_gfp_expressionenglish_2017.pdf">https://www.biophysik.physik.uni-muenchen.de/teaching/laboratory_courses/gfp_expression/g4b_gfp_expressionenglish_2017.pdf</a> </i></li> |
| − | + | <li id="ref3">Baez A, Shiloach J. Escherichia coli avoids high dissolved oxygen stress by activation of SoxRS and manganese-superoxide dismutase. <i>Microbial Cell Factories</i>. 2013;12(1):23. doi:10.1186/1475-2859-12-23</li> | |
| − | + | <li id="ref4">Seo S, Kim D, Szubin R, Palsson Bernhard O. Genome-wide Reconstruction of OxyR and SoxRS Transcriptional Regulatory Networks under Oxidative Stress in Escherichia coli K-12 MG1655. <i>Cell Reports</i>. 2015;12(8):1289-1299. doi:10.1016/j.celrep.2015.07.043</li> | |
| + | <li id="ref5">Part:BBa E0040 - parts.igem.org. Igem.org. Published 2013. Accessed October 16, 2021. <a href="http://parts.igem.org/Part:BBa_E0040">http://parts.igem.org/Part:BBa_E0040</a></li> | ||
| + | </ol> | ||
</section> | </section> | ||
</main> | </main> | ||
Revision as of 15:57, 20 October 2021

Overview
In our project, the superfolder green fluorescent protein (sfGFP) allows better quantification of promoter strength and sensitivity.[1,2]. In the oxidative stress sensing system biobrick, we improved the biobrick BBa_K2610031 from the 2019 iGEM Leiden team by changing GFP (BBa_E0040)[2]. into sfGFP(BBa_I746916), which is hypothesized to have a higher expression level than GFP [Fig. 1]. We also added transcription activator SoxR to our biobrick for increased function of the oxidative stress sensing system[3].

Results
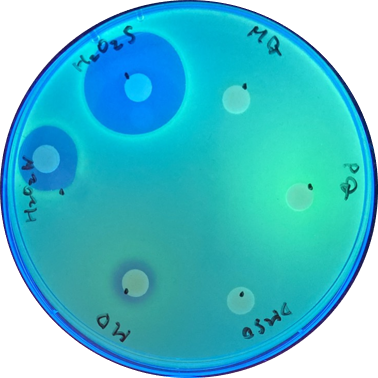
Disk assay
Disk assay was used to check the effect of each inducer. The concentration of the different inducers we used are listed below:
| Inducer | Volume per disk |
|---|---|
| H2O2s (30%) | 10μl |
| H2O2w (3%) | 10μl |
| MD (menadione)(10mM) | 10μl |
| DMSO (solvent for MD) | 10μl |
| PQ (paraquat)(1mM) | 10μl |
| MQ (solvent for PQ) | 10μl |
With sfGFP, the induced system result can be checked under UV light, making it easier to tell the difference between each inducer. [Fig 2.]
Oxidative Stress Assay

In this experiment, an overnight culture was prepared, diluted 10 times and transferred into the 96 well plate. The inducer (paraquat-PQ) was added after incubating in 37 °C.The sfGFP expression level was measured hourly during the 4.5 hours after paraquat induction using an ELISA reader.
We compared sfGFP expression levels of soxS promoter with and without the activation of SoxR transcription factor. As shown in Fig. 3., sfGFP expression levels were higher with SoxR than without SoxR. In addition, there was no leakage problem after we added SoxR into our biobrick[4].[Fig. 4]

Please visit Results page for more information.
References
- Overkamp W, Beilharz K, Detert Oude Weme R, et al. Benchmarking Various Green Fluorescent Protein Variants in Bacillus subtilis, Streptococcus pneumoniae, and Lactococcus lactis for Live Cell Imaging. Applied and Environmental Microbiology. 2013;79(20):6481-6490. doi:10.1128/aem.02033-13
- Creation, Expression, Purification and Characterization of GFP G4b GFP Expression and Melting Curves.https://www.biophysik.physik.uni-muenchen.de/teaching/laboratory_courses/gfp_expression/g4b_gfp_expressionenglish_2017.pdf
- Baez A, Shiloach J. Escherichia coli avoids high dissolved oxygen stress by activation of SoxRS and manganese-superoxide dismutase. Microbial Cell Factories. 2013;12(1):23. doi:10.1186/1475-2859-12-23
- Seo S, Kim D, Szubin R, Palsson Bernhard O. Genome-wide Reconstruction of OxyR and SoxRS Transcriptional Regulatory Networks under Oxidative Stress in Escherichia coli K-12 MG1655. Cell Reports. 2015;12(8):1289-1299. doi:10.1016/j.celrep.2015.07.043
- Part:BBa E0040 - parts.igem.org. Igem.org. Published 2013. Accessed October 16, 2021. http://parts.igem.org/Part:BBa_E0040