Difference between revisions of "Team:NCKU Tainan/Improvement"
Minghan1005 (Talk | contribs) |
Minghan1005 (Talk | contribs) |
||
| Line 36: | Line 36: | ||
<!--section name:Overview--> | <!--section name:Overview--> | ||
<h2 id ="Subtitle1">Overview</h2> | <h2 id ="Subtitle1">Overview</h2> | ||
| − | <p>In our project, the superfolder green fluorescent protein (sfGFP) allows better quantification of promoter strength and sensitivity.<sup>[<a href="#ref1">1</a>,<a href="#ref2">2</a>]</sup>. In the oxidative stress sensing system biobrick, we improved the <a href="http://parts.igem.org/Part:BBa_K2610031">biobrick BBa_K2610031</a> from the <a href="https://2019.igem.org/Team:Leiden">2019 iGEM Leiden team</a> by changing GFP (<a href="http://parts.igem.org/Part:BBa_E0040">BBa_E0040</a>)<sup>[<a href="#ref2">2</a>]</sup>. into sfGFP(<a href="http://parts.igem.org/Part:BBa_I746916">BBa_I746916</a>), which is hypothesized to have a higher expression level than GFP [Fig. 1]. We also added transcription activator SoxR to our biobrick for increased function of the oxidative stress sensing system<sup>[<a href="#ref3">3</a>]</sup>. | + | <p> In our project, the superfolder green fluorescent protein (sfGFP) allows better quantification of promoter strength and sensitivity.<sup>[<a href="#ref1">1</a>,<a href="#ref2">2</a>]</sup>. In the oxidative stress sensing system biobrick, we improved the <a href="http://parts.igem.org/Part:BBa_K2610031">biobrick BBa_K2610031</a> from the <a href="https://2019.igem.org/Team:Leiden">2019 iGEM Leiden team</a> by changing GFP (<a href="http://parts.igem.org/Part:BBa_E0040">BBa_E0040</a>)<sup>[<a href="#ref2">2</a>]</sup>. into sfGFP(<a href="http://parts.igem.org/Part:BBa_I746916">BBa_I746916</a>), which is hypothesized to have a higher expression level than GFP [Fig. 1]. We also added transcription activator SoxR to our biobrick for increased function of the oxidative stress sensing system<sup>[<a href="#ref3">3</a>]</sup>. |
<div class="container-fluid p-0"> | <div class="container-fluid p-0"> | ||
<div class="row no-gutters"> | <div class="row no-gutters"> | ||
| Line 102: | Line 102: | ||
</div> | </div> | ||
| − | + | <p> With sfGFP, the induced system result can be checked under UV light, making it easier to tell the difference between each inducer. [Fig 2.]</p> | |
| − | + | ||
| + | <div class="container-fluid p-0"> | ||
<div class="row no-gutters"> | <div class="row no-gutters"> | ||
<div class="col-lg "> | <div class="col-lg "> | ||
<figure class="d-flex flex-column justify-content-center align-items-center px-lg-3"> | <figure class="d-flex flex-column justify-content-center align-items-center px-lg-3"> | ||
<!-- put link in href & src , width in a can adjust--> | <!-- put link in href & src , width in a can adjust--> | ||
| − | <a href="https://static.igem.org/mediawiki/ | + | <a href="https://static.igem.org/mediawiki/2021/8/88/T--NCKU_Tainan--PsoxS_Disk_Assay.png" target="_blank" style="width:50%"><img src="https://static.igem.org/mediawiki/2021/8/88/T--NCKU_Tainan--PsoxS_Disk_Assay.png" alt="" title="" style="width:100%"></a> |
<figcaption>Fig. 3. 12% SDS PAGE of <i>E. coli</i> Nissle 1917 with different plasmids. M: Marker; Lane 1: Wild Type; Lane 2: pSB1C3; Lane 3: BBa_K2997009 ; Lane 4: BBa_K2997010; Lane 5: Dual plasmid containing BBa_K2997009 and BBa_K2997000; Lane 6: Dual plasmid containing BBa_K29970010 and BBa_K2997000 ; Lane 7: Positive control (c.d. 3392)</figcaption> | <figcaption>Fig. 3. 12% SDS PAGE of <i>E. coli</i> Nissle 1917 with different plasmids. M: Marker; Lane 1: Wild Type; Lane 2: pSB1C3; Lane 3: BBa_K2997009 ; Lane 4: BBa_K2997010; Lane 5: Dual plasmid containing BBa_K2997009 and BBa_K2997000; Lane 6: Dual plasmid containing BBa_K29970010 and BBa_K2997000 ; Lane 7: Positive control (c.d. 3392)</figcaption> | ||
</figure> | </figure> | ||
Revision as of 15:35, 20 October 2021

Overview
In our project, the superfolder green fluorescent protein (sfGFP) allows better quantification of promoter strength and sensitivity.[1,2]. In the oxidative stress sensing system biobrick, we improved the biobrick BBa_K2610031 from the 2019 iGEM Leiden team by changing GFP (BBa_E0040)[2]. into sfGFP(BBa_I746916), which is hypothesized to have a higher expression level than GFP [Fig. 1]. We also added transcription activator SoxR to our biobrick for increased function of the oxidative stress sensing system[3].

Results
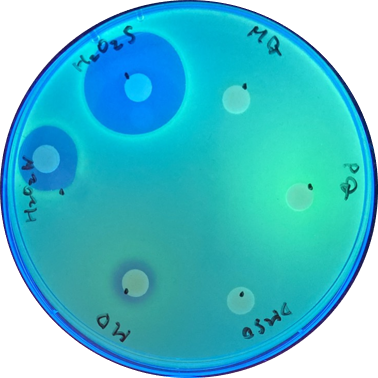
Disk assay
Disk assay was used to check the effect of each inducer. The concentration of the different inducers we used are listed below:
| Inducer | Volume per disk |
|---|---|
| H2O2s (30%) | 10μl |
| H2O2w (3%) | 10μl |
| MD (menadione)(10mM) | 10μl |
| DMSO (solvent for MD) | 10μl |
| PQ (paraquat)(1mM) | 10μl |
| MQ (solvent for PQ) | 10μl |
With sfGFP, the induced system result can be checked under UV light, making it easier to tell the difference between each inducer. [Fig 2.]
Finally, to confirm the protein activity of TAL and TyrP, we performed a functional test using n-octanol extraction method, which was previously proposed by iGEM_Uppsala 2013 and has been verified by HPLC[3]. The p-Coumaric acid concentration was measured through the absorbance value at 310 nm wavelength under Nanodrop UV-Vis wavelength.

We compared the TAL constructs containing the native and B0034 ribosome binding sites, (BBa_K2997009 and BBa_K2997010) to determine if p-Coumaric Acid production is improved by changing the ribosome binding sites. From the results seen in Fig. 4, BBa_K2997010 is able to produce a higher amount of p-Coumaric acid. Hence, we are able to prove that by changing the RBS (from Native to B0034), the conversion of tyrosine into p-Coumaric acid can increase by 1.73-fold. Therefore, we have shown that we have improved a previous BioBrick.
For more information, please visit our Results page.
References
- https://2007.igem.org/wiki/index.php/Edinburgh/Team
- Chen, H., Bjerknes, M., Kumar, R., & Jay, E. (1994). Determination of the optimal aligned spacing between the Shine – Dalgarno sequence and the translation initiation codon of Escherichia coli mRNAs. Nucleic Acids Research, 22(23), 4953–4957.
- https://2013.igem.org/Team:Uppsala