Team:Think Edu China/Model

Modeling
Simulation:
Using our engineered antibiotic-degrading probiotics in biogas fermentation tanks using antibiotic-contaminated livestock manure.
Objective:
To guide the quantity of engineering probiotics in actual use.
The known enzyme activity assay data:
To determine the enzyme activity of the whole cell catalyst,2, 2-biazo-bis (3-ethyl-benzothiazol-6-sulfonic acid) diammonium salt (ABTS) was used as the substrate, and the enzyme activity was calculated at 480 nm absorption wavelength.(Bebrone, 2007)。First, the engineered strains were inoculated to LB medium at 1% for overnight culture at 37℃. After supernatant was removed by centrifugation, the bacteria were collected (6000 r/min,10 min). The bacteria were washed twice with PBS buffer (ph=7.0) and prepared into a bacterial suspension with cell concentration of 1.0×10⁹ CFU/mL for later use. The reaction temperature was set at 30℃, and the enzyme activity reaction system was 3 mL, including 1 mL of 5mmol/L ABT, 0.5 mL bacterial cell suspension, and 1.5 mL of 0.1 mol/L faloxate buffer (pH=5.0). 1 unit of enzyme activity (U) refers to the amount of ABTS free radical increased from A to B by the whole cell catalyst oxidizing 1 mmoL ABTS within 1 minute at 30℃. The unit of enzyme activity is 1mmoL /min, i.e., U/g (solid).
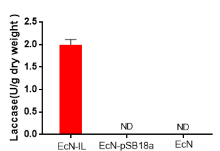
To evaluate the activity of laccase in EcN, the activity of laccase in whole cell catalyst was 1.99± 087 U/g cell dry weight when ABTS was used as substrate at 420nm (Figure 1-1), while no activity was detected in control EcN-PSB18a and wild-type EcN. The results showed that the laccase gene was successfully expressed on the cell membrane and exhibited high enzyme activity.
The known experimental data of optimal conditions:
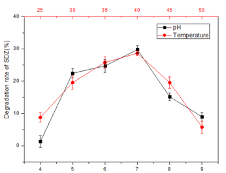
The reaction conditions of whole cell catalyst EcN-IL were optimized. In order to detect the optimal reaction pH, the engineered strains were first inoculated in LB medium with 1% inoculation amount at 37℃, 180 r/min, and incubated overnight for 10min. After supernatant removal, the thallus was collected by centrifugation (6000 r/min,10min) and suspended in PBS buffer with pH=4, 5, 6, 7, 8 and 9. Then sulfadiazine sodium salt (SDZ) at a concentration of 50 mg/L was added to each system. After reaction for 1 h, the thallus precipitation was discarded by centrifugation. The residues of SDZ in supernatant were determined by HPLC. In order to determine the optimal reaction temperature, the bacteria were obtained with the same treatment method, suspended in PBS buffer at the temperature of 25, 30, 35, 40, 45 and 50℃, and sulfadiazine sodium salt at the concentration of 50 mg/L was also added to them. After 1 h of reaction, the supernatant samples were centrifuged, filtered by 0.22 μm filter membrane, and the degradation of SDZ by ECN-IL was detected by HPLC (the same as 3.2.1).
When pH was in the range of 4-7, the degradation rate of EcN for SDZ increased gradually, and reached the maximum value at pH=7.0. With the increasing of pH, degradation efficiency decreased gradually. In Figure 3-2, it can also be concluded that the degradation rate of SDZ increases gradually with the increase of temperature, and the degradation efficiency is the highest when the temperature is 40℃. Therefore, the optimal reaction temperature is 40℃, the optimal pH is 7.0.
Related variables, (it is difficult to have all variables, you can set some variables to quantitative)
1. Initial concentration of antibiotics in biogas fermentation liquid (this variable consists of 1. Volume A of fermentation liquid and 2. Volume b3 of excrement and antibiotic concentration c of excrement) g = (B * C)/(A + B)
2. Temperature (D) and pH (F) in the biogas digester
Based on the above data, the degradation curve of antibiotic (Y) with time under certain conditions could be established.
Y = (data available)
Setting safe levels for antibiotic concentrations and the need to reach safe levels (10,? ; 12:?) The initial concentration, temperature and pH of antibiotics in different biogas fermentation broth can be obtained under the minimum amount of engineered probiotics.
According to the specific data in the second figure (including ph value, temperature value and degradation rate of SDZ) and the trend of the data, the following mathematical model is established.
Set the ph variable as x_PH, temperature as x_T, and the degradation rate of SDZ as y. Then we established mathematical models between ph value and SDZ degradation rate, temperature value and SDZ degradation rate respectively. It is obvious from the above figure that the DEGRADATION rate of SDZ decreases first and then increases with the increase of ph/temperature, and the relationship is non-linear.
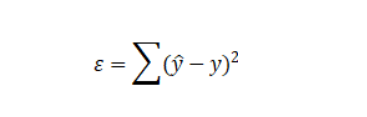
Before the formal modeling, Python was used to make tentative exploration, and according to the data between temperature/pH value and degradation rate, unary quadratic model and unary cubic model were established respectively, and the error between fitting results and real results was estimated. Assume that the fitting value of SDZ degradation rate is y ̂ and the error symbol is ε, and the error can be calculated as follows:
1. Results of quadratic fitting:
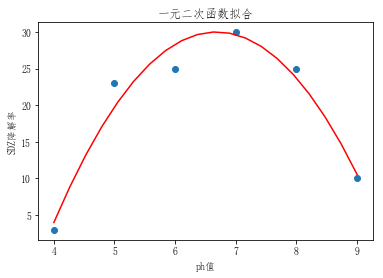
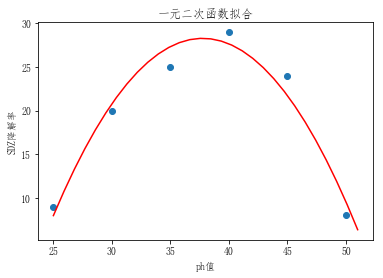
As shown in the figure above, in the model of pH value and SDZ degradation rate, the error is 24.5; in the model of temperature and SDZ degradation rate, the error is 43.5.
1. Results of unary cubic fitting:
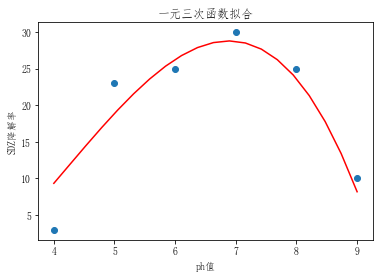
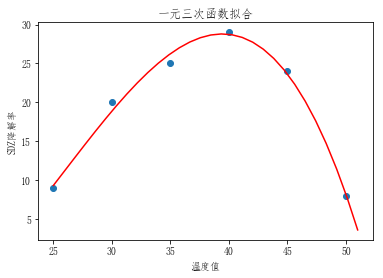
As shown in the figure above, in the model of pH value and SDZ degradation rate, the error is 24.5; in the model of temperature and SDZ degradation rate, the error is 3.2.
Based on the principle of simple modeling, the error value of the ph value is equal to that of the quadratic model, so the PH value can be established quadratic model; The error value of establishing unary cubic equation of temperature value decreases obviously, so the unary cubic mathematical model of temperature value is established.
3. ph value and degradation rate of SDZ:
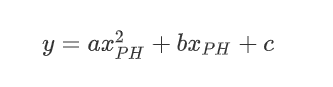
a, b, and c are parameters to be estimated.
4. temperature and degradation rate of SDZ:
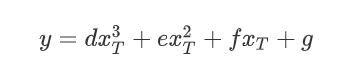
d, e, f, g are parameters to be estimated.
5. estimation of parameters (from Python)
In order to estimate the values of the above six parameters based on the real data in the experiment and obtain the mathematical relationship between temperature/pH value and degradation rate, the curve_FIT function in SCIPY module was called in Python.
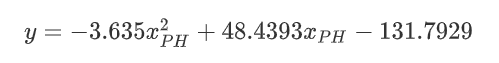
Finally, the mathematical model between pH value and SDZ degradation rate was solved as:
-3.62500000001 48.4392857144 -131.792857143
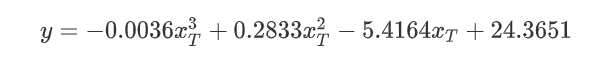
The mathematical model between temperature value and SDZ degradation rate was solved as:
6. Michealis-Menten equation parameter fitting:
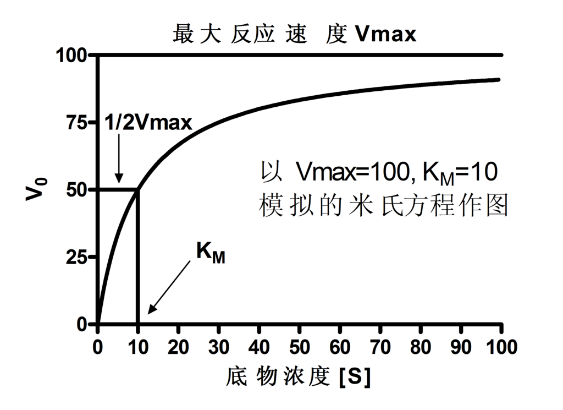
Michaelis-menten equation can effectively represent the velocity relationship between the initial velocity of enzymatic reaction and the substrate concentration, as shown below
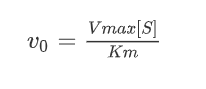
Among them, Km reflects the tight binding degree between substrate and enzyme, and Vmax reflects the speed of enzyme-catalyzed reaction. To measure Km and Vmax in the equation, v_0 can be measured at different substrate concentrations [S], and Km and Vmax can be obtained by nonlinear or linear plotting.
a) linear graphing method:
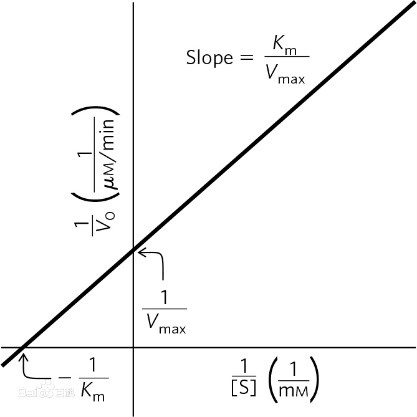
Get equation by inverting both sides of original equation:
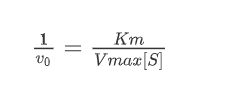
That can be written in linear equation:
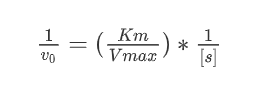
We can see 1/v_0 as dependent variable,1/([S]) as dependent variable, and the linear fitting regression solution was performed:
b) Nonlinear graphing
The final parameters can be obtained by directly fitting the Michealis equation according to the given nonlinear function form;
c)fitting result
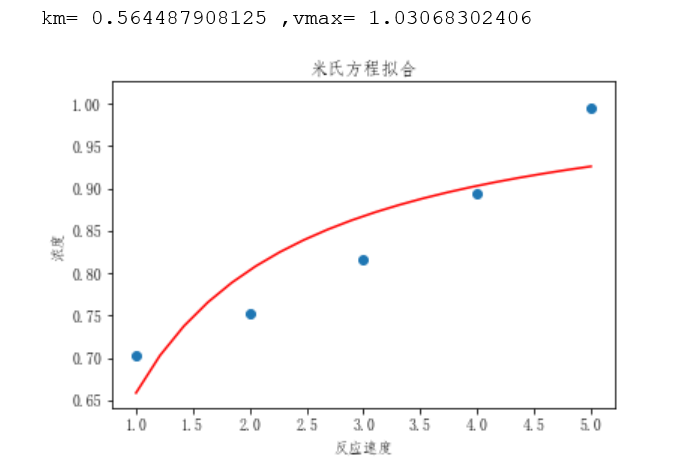
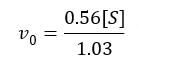
By combining Miltonian equation and fitting data, the fitting results of Miltonian equation can be obtained as shown in the figure above, where Km=0.56, Vmax=1.03, that is, the relationship between substrate concentration and reaction speed can be expressed as:
7. Multiple nonlinear regression models were established for substrate concentration, PH value, temperature, and reaction rate
After the above exploratory experiments, on the basis of the control variable method, reaction velocity y has a linear relationship with substrate concentration [S], Phx_PH has a quadratic relationship with velocity, and temperature x_(T )has a cubic relationship with velocity. Therefore, based on the above three models and experimental data, a multivariate nonlinear regression model is constructed as follows:

Multivariate nonlinear equation fitting was carried out by Python, and R^2=0.9435,R^2>0.8 in the fitting result. Therefore, the multivariate nonlinear regression results are as follows:
