As our goal is to produce the additive that could secret PKC enzyme to help degrade the cellulose in silage,
we want to ensure that our engineered strain can make the best of itself at its best condition. From this
perspective, we designed several different induction conditions for protein expression and decided to build
the model to determine the optimal condition for our engineered strain to “work” better.
Below is the initial data:
Team:Shanghai Metro HS/Model
 MODEL
MODEL
Table 1. The gray value of E. coli/PKC-OP under different concentrations of IPTG against time
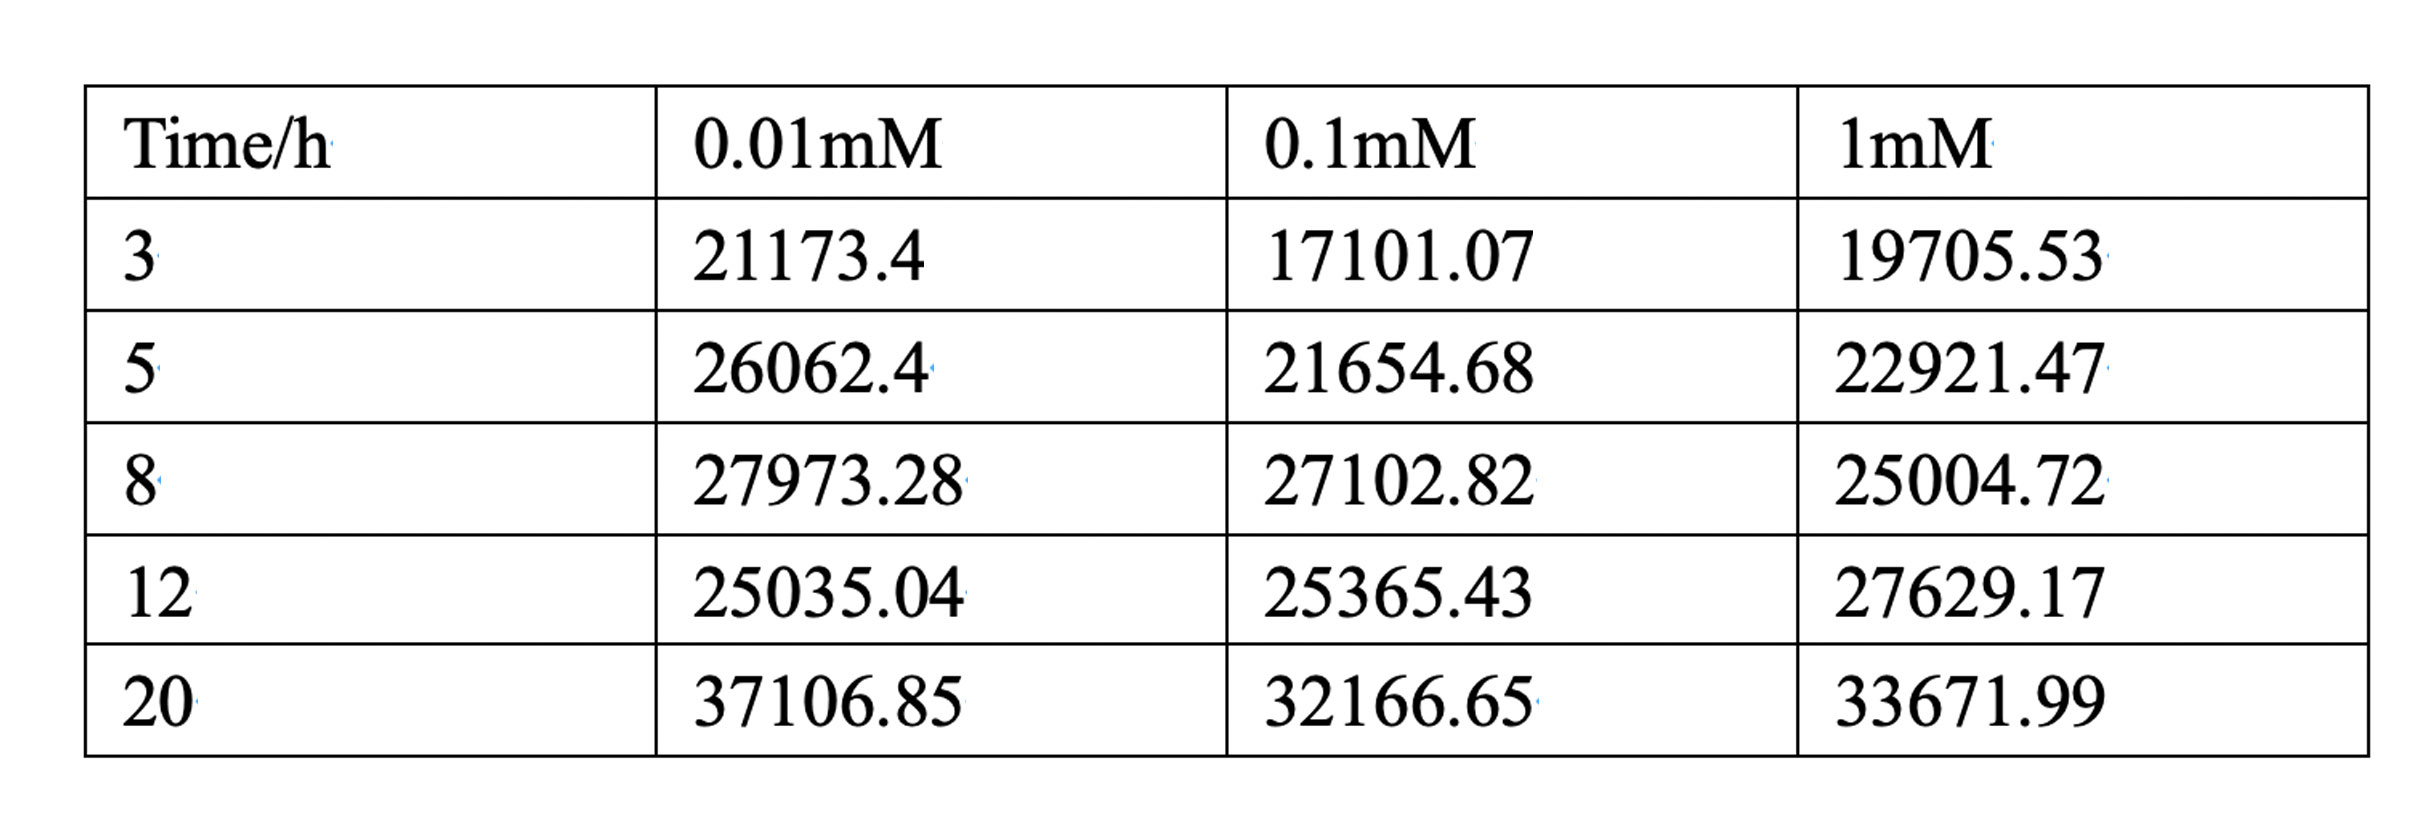
In table 1, gray values were measured by Image J in order to quantify the protein expression level. In this
case, we tested three concentrations of IPTG to conduct induction.
According to the scatter plots, we noticed that the cubic polynomial equation could fit the trends very well with all fitting degrees higher than 0.98.
According to the scatter plots, we noticed that the cubic polynomial equation could fit the trends very well with all fitting degrees higher than 0.98.
Cubic polynomial equation:
y = p1x3 + p2x2 + p3x + p4
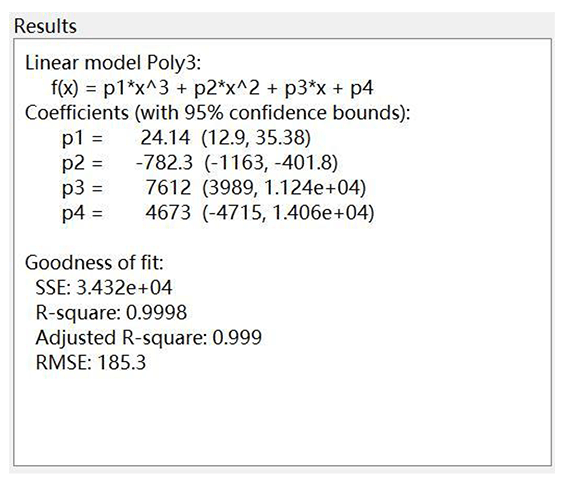 Figure 1. The model result when IPTG concentration equals 0.01 mM
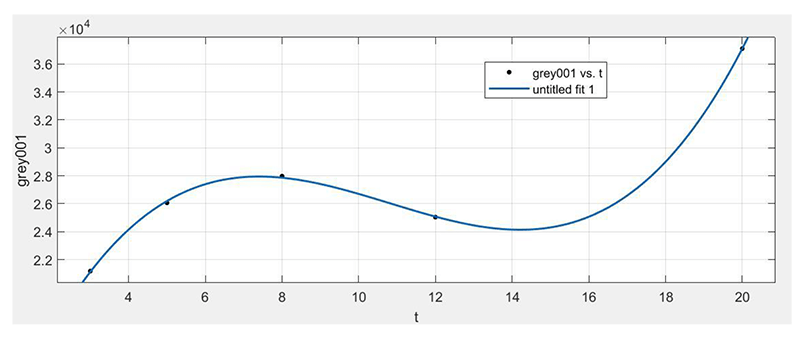 Figure 2. The fitting curve of the model when IPTG concentration equals 0.01 mM
When E. coli/PKC-OP is induced by 0.01mM IPTG, it indicates that before 12 hours
there is a peak at 7 hours when the protein was expressed the best. Otherwise, if there is enough time
given, the protein could be expressed more after 18 hours and the induction duration to be chosen will
depend on the production plan.
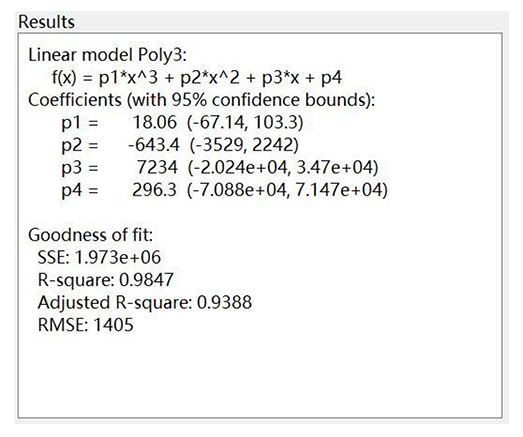 Figure 3. The model result when IPTG concentration equals 0.1 mM
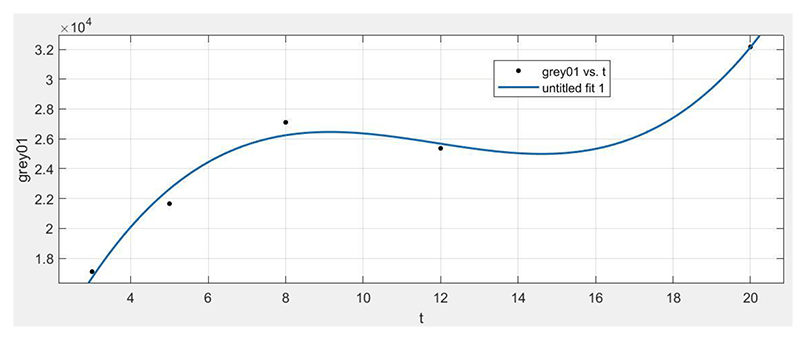 Figure 4. The fitting curve of the model when IPTG concentration equals 0.1 mM
When E. coli/PKC-OP is induced by 0.1mM IPTG, we can see that the basic trend of
the protein expression level is increasing as the induction time increases. In this case, we would suggest
the least induction time to be 8 hours.
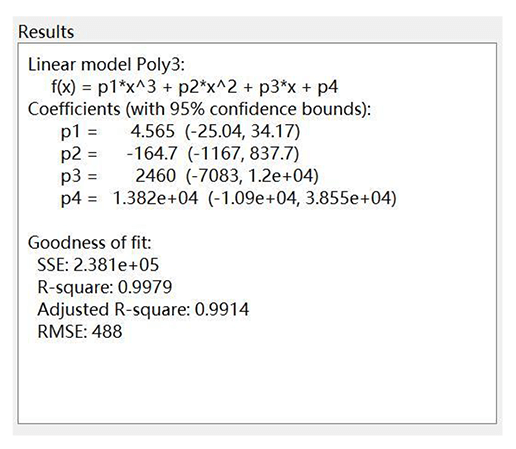 Figure 5. The model result when IPTG concentration equals 1 mM
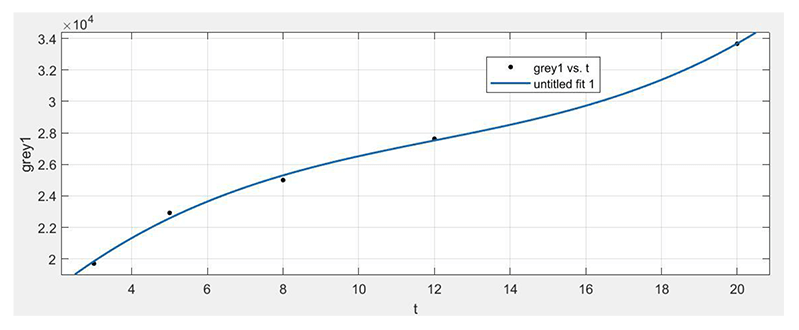 Figure 6. The fitting curve of the model when IPTG concentration equals 1 mM
When E. coli/PKC-OP was induced by 1 mM IPTG, it shows a clear increasing trend of
the protein expression
level as the induction time increases.
Comparison
In order to further analyze the effect of the IPTG concentration on the protein
expression level of E.
coli/PKC-OPO, we put these three lines on the same page as shown in figure 7 and the coding is given below:
“
clear;clc;
t0=[3 5 8 12 20];
grey001=[21173.401 26062.4 27973.278 25035.036 37106.845];
grey01=[17101.066 21654.681 27102.823 25365.43 32166.652];
grey1=[19705.53 22921.471 25004.723 27629.166 33671.986];
p001=polyfit(t0,grey001,3);
p01=polyfit(t0,grey01,3);
p1=polyfit(t0,grey1,3);
t=[0:0.1:22];
y001=polyval(p001,t);
y01=polyval(p01,t);
y1=polyval(p1,t);
plot(t,y001,t,y01,t,y1,'LineWidth',1)
”
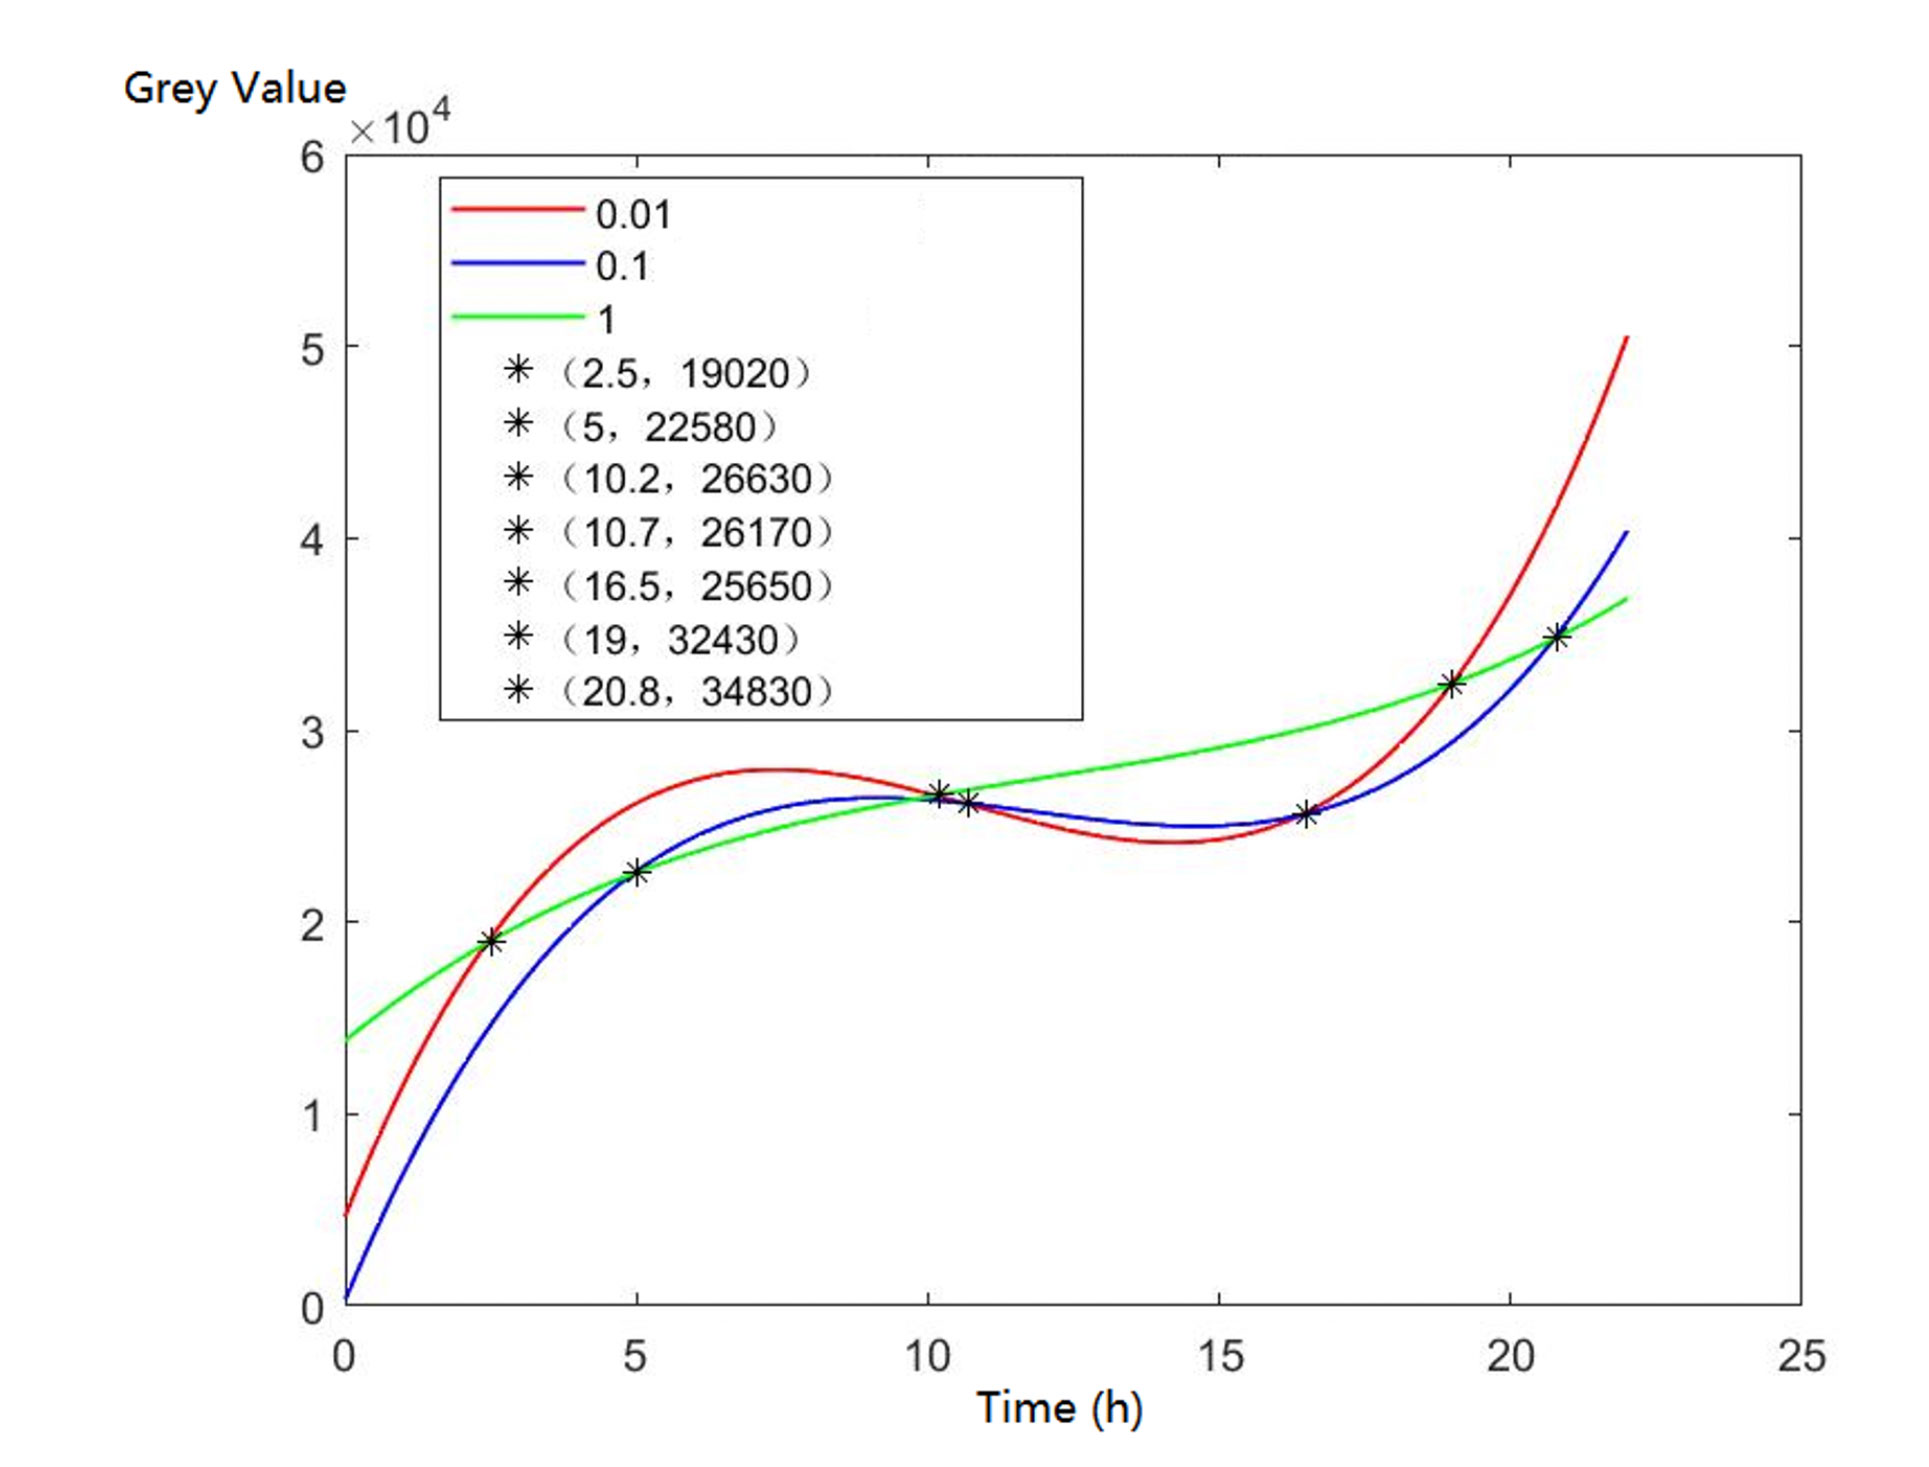 Figure 7. Comparison graph of the fitting curves of three models
Based on the graph where we can see several cross points’ coordinates of lines, we
could adjust the IPTG concentration according to the induction time which could be pre-decided by the
production plan in the future.
When the induction time is given
less
than 2.5 hours, 1 mM IPTG would be more recommended;
When the induction time is given
during 2.5 hours 10.2 hours, 0.01 mM IPTG would be
more recommended;
When the induction time is given
during 10.2 hours ~ 19 hours, 1 mM IPTG would be
more recommended;
When the induction time is given
very enough like more than 19 hours, 0.01 mM IPTG
would be
more
recommended.