Team:SZU-China/Results

Results

This year, we successfully constructed several plasmid expression systems. The plasmid name, skeleton origin and functional design notes are shown in Table 1.
| Name | Source of plasmid skeleton | Plasmid functional design |
|---|---|---|
| PJSG | pUC18 | Constitutive express SOD gene heat shock protein with
GST label and triclosan resistance gene, ampicillin resistance |
| PJSH | pUC18 | Constitutive express SOD gene heat shock protein with
His tag and triclosan resistance gene, ampicillin resistance |
| PJB | pUC18 | Constitutive express heat shock protein gene of BSH gene with
his tag and triclosan resistance gene, ampicillin resistance |
| PJT | pUC18 | Constitutive express Tes4 gene with His tag heat shock protein gene
and triclosan resistance gene, ampicillin resistance |
| PJL | pUC18 | Constitutive express LL-37 gene, heat shock protein gene and
triclosan resistance gene, ampicillin resistance |
| PYHSG | pJSG | The acid-dependent response promoter PrcfB expressed heat shock
protein of SOD gene with GST label, triclosan resistance gene and ampicillin resistance gene |
| pet-S | pET-22b(+) | Constitutive exosomes express SOD gene with GST tag and His tag,
kana-resistance |
| pet-RR | pET-28a(+) | Constitutive type expresses RcfB gene and RFP protein,
ampicillin resistance |
| pet-GluK | pET-28a(+) | The glucose response promoter is used to express mazF gene and
mRFP gene with His tag, kana-resistance |
| pet-PhoK | pET-28a(+) | The expression of tetR gene and mRFP gene with His tag depended on
phosphate response promoter, and the expression of mazF gene and Kana resistance depended on tetR trans-acting factor response promoter |
Table.1 Plasmid name, skeleton origin, functional design.
Since both plasmids pJSG and pJB carry this system, we transformed the plasmids pJSG into E.coli DH5α and Nissle 1917 to detect the expression of FabV gene encoding protein, and transformed the plasmids pJB into E.coli DH5α and Nissle 1917 to determine the screening concentration.
The DNA level
After the engineered bacteria were transformed, the target plasmid after DH5α transformation was extracted and verified by DNA gel electrophoresis. For Nissle 1917, we extracted the target plasmid and amplified the SOD expression element on the plasmid, which was verified by DNA gel electrophoresis. We also carried out enzyme digestion verification on the plasmid, adding restriction endonuclease MIuI and SacI for double enzyme digestion, and obtained bands of expected size, as shown in figure 1. This further indicates that our plasmid transformation is successful.
 |
 |
 |
Fig.1 A Gel electrophoresis of DNA transformed into E.coli DH5α by plasmid PJSG (5939 bp). B After transformation,
Nissle 1917 SOD expression element was amplified(target fragment size was 1890 bp).
C The PJSG was double-digested
with restriction endonuclease MIuI and SacI, and the expected band sizes were 1918 bp and 4021 bp.
The protein level
The experimental group was DH5α with PJSG plasmid, and the control group was DH5α empty vector. As can be seen from figure 2, protein expression in the experimental group was near 45 kDa, which was consistent with our target protein band of 44 kDa. It indicated that FabV protein was successfully expressed by the engineered bacteria.

Fig.2 SDS-PAGE of DH5α intracellular protein containing PJSG plasmid was performed.
The untransformed DH5α was used as blank control group. The target protein size was 44 kDa.
Functional characterization
0.625 μM/mL triclosan concentration, there was no colony growth in the control group, but a few colonies grew in the experimental group. We selected a single colony and transferred it to the liquid before plasmid extraction for gel running and enzyme digestion verification. The target band was 5477 bp, proving that the growing colony was indeed a transpromoter.
DH5α:
In order to find the effective working concentration of this screening system, LB plates were prepared at 0.625 μM/mL triclosan concentration, 1.25 μM/mL triclosan concentration and without resistance, The DH5α bacterial solution at the early logarithmic growth stage was coated on the plate on the medium (the concentration of the two groups was controlled at about OD=0.4). Place the plates at 37℃ in a constant temperature incubator for 18h, and obtain the results, as shown in figure 3.
Non-resistant group, both kinds of bacteria are overgrown on the plate;
1.25 μM/mL triclosan concentration, There was no colony growth in the control group, but a few colonies grew in the experimental group. We selected a single colony and transferred it to the liquid, then plasmid was extracted for gel running and enzyme digestion verification, and the target band was 5477 bp, proving that the growing colony was indeed a transpromoter.
To further confirm, triclosan plates with 0.625 μM and 1.25 μM concentrations were re-selected for plasmid raising validation after the 4C plate was retained for 14 days, and the target bands were also obtained, as shown in figure 4 In conclusion, 0.625 μM/mL and 1.25 μM/mL triclosan concentrations can be used as screening conditions for non-antibiotic DH5α engineering bacteria.
 |
 |
 |
 |
 |
 |
Fig.3 A Untransformed DH5α coated in LB without triclosan.
B Transformed DH5α coated in LB without triclosan.
C Untransformed DH5α was coated on LB. D with 0.625 μM/mL triclosan. The transformed DH5α was coated on LB.
E with 0.625 μM/mL triclosan. Untransformed DH5α was coated on LB.
F The transformed
DH5α was coated on LB supplemented with 1.25 μM/mL triclosan.

Fig.4 A the single colony transfer plasmid plasmid obtained by 0.625μm/mL triclosan plate.
B the single
colony transfer plasmid obtained by 1.25 μm/mL triclosan plate. The target plasmid size was 5477 bp.
Nissle 1917: Because there are two kinds of chassis in the project, we also conducted a screening concentration determination experiment in Nissle 1917. We adjusted the concentration of triclosan to 2.5 mmol/mL-10 mmol/mL and diluted the coating board 5 times. Fig.5 lists the growth conditions of untransformed Nissle 1917 on plates with different concentrations and the growth conditions of transformed Nissle 1917 on plates with different concentrations.
As can be seen from the figure, the growth conditions of Nissle 1917(NJB) transformed PJB plasmid transformed by different gradients were better than those of the untransformed control group, indicating that FabV gene had certain stress resistance to triclosan. It provides support for the use of the system as a screening system for non-antibiotics.
At the concentration of 2.5 mmol/mL,the experimental group had obvious bacterial growth and single colony, while the control group almost did not grow on the plate. Therefore, a plate with a concentration of 2.5 mmol/mL was selected for PCR after single colony transfer liquid and plasmid extraction, and the target band size was 1756 bp, as shown in figure 6. The sample band was consistent with the target band. It was proved that the bacteria growing on the experimental plates were NJB engineered bacteria, which proved that the non-antibiotic screening system of triclosan /FabV was also suitable for Nissle 1917.
 |
 |
 |
 |
Fig.5 A The untransformed Nissle 1917 coated on LB without triclosan.
B The transformed Nissle 1917 was coated on LB without triclosan.
C The untransformed Nissle 1917 was coated on LB with 2.5 mmol/mL triclosan.
D The transformed Nissle 1917 was coated on LB with 2.5 mmol/mL triclosan.
 |
 |
 |
 |
Fig.5 E The untransformed Nissle 1917 was coated on LB with 5 mmol/mL triclosan.
F The transformed Nissle 1917 was coated on LB with 5 mmol/mL triclosan.
G The untransformed Nissle 1917 was coated on LB with 10 mmol/mL triclosan.
H The transformed Nissle 1917 was coated on LB with 10 mmol/mL triclosan.

Fig.6 The target band size of PCR amplification was 1756 bp,
and the actual band size was consistent with the target band.
We added heat shock protein, a non-antibiotic screening system, to the construction of each target gene to serve our project. In terms of plasmid and protein level verification of part, we selected DH5α strain (DJSG) and Nissle 1917 strain (NJSG) with PJSG plasmid for experiments. In the experiment of enhancing the stress resistance of protein to bacteria, we selected BL21 strain (BJSG) transformed into PJSG plasmid for the experiment.
The DNA level
We added the HSP gene to the plasmid construction of each of the target genes to express heat shock proteins. On the plasmid level verification, we chose DH5α strain with PJSG plasmid and Nissle 1917 to experiment. Due to the resistance of heat shock protein expression element and triclosan protein expression components on the same plasmid, the results can be seen in figure 1.
As can be seen from the figure 1, the sample band was larger than 5000 bp, which was consistent with our plasmid vector 5939 bp, indicating that our plasmid transformation was successful.
The protein level
We then verified the engineering bacteria at the protein level. The experimental group was DH5α strain with PJSG plasmid, and the control group was DH5α empty vector. As can be seen from figure 7, only DJSG protein was expressed near 14.4 kDa, which was consistent with our target protein band of 16 kDa, indicating that the engineering bacteria successfully expressed HSP protein.

Fig.7 SDS-PAGE was performed for DH5α (DJSG) intracellular protein containing PJSG plasmid.
Untransformed DH5α was used as blank control group. The target protein size was 16 kDa.
We inoculated BL21 strain (BJSG) transformed into PJSG plasmid and BL21 (BPUC) transformed into empty vector pUC18 into 15 tubes of 5 mL LB medium, which were divided into 5 groups with 3 tubes per group. Each group was placed at 37℃ for 5h, and OD value was about 1.0. Then, each group was cultured at 37℃, 42℃, 47℃, 52℃ and 57℃, and under 0.5 mM hydrogen peroxide stress and ethanol stress, respectively. The OD600 of bacterial solution was measured every hour for 8h. The survival rate was calculated by taking the first OD600 as 100%, and the result was shown in figure 8.
It can be seen that the survival rate of BJSG under hydrogen peroxide and ethanol stress is higher than that of the untransformed blank bacteria, indicating that the engineered bacteria have acquired such stress resistance, and this gene has the potential to be used as a screening gene. In addition, hydrogen peroxide and ethanol mimicked two states common in the human gut, excess reactive oxygen species and the drunk gut. This means that HSP can also effectively help engineered bacteria colonize IBD patients with abnormal ros levels.
 |
 |
 |
 |
 |
 |
Fig.8 A Survival rate determined by 0.5 mM hydrogen peroxide stress culture.
B Survival rate determined by
ethanol (10%) stress culture C-F. Survival rate was determined by stress culture at different temperatures.
The DNA level
Two plasmids, PJSG and PET-S, were selected for verification. The PET-S plasmid is an optimization of PJSG at a later stage of the experiment, removing two unnecessary genes, heat shock protein and triclosan resistance gene. We transformed the PJSG plasmid into DH5α and Nissle 1917, and peT-S into BL21(DE3). Among them, the transformation results of PJSG plasmid have been described above, as shown in figure 9. Plasmid extraction was carried out for transformed BL21(DE3) and double enzyme digestion was performed with XhoI and NcoI, as shown in figure 9.

Fig.9 Enzyme digestion of PET-S plasmid extraction.
The protein level
We then carried out protein level verification on the engineered bacteria. As shown in figure 10A, for DH5α, compared with the blank group in lane 1, as indicated by the arrow, SOD (with GST label) protein band of 55.14 kDa could be seen in lane 2 and SOD (with 6x His label) protein band of 29.5 kDa could be seen in lane 3, which were clear and met the expected size.
As shown in figure 10B, for Nissle 1917, compared with the blank group in lane 1, as indicated by the arrow, the SOD (with GST label) protein band of 55.14 kDa could be obviously seen in lane 2, and the SOD (with 6x His label) protein band of 29.5 kDa could be obviously seen in lane 3, with clear bands and sizes meeting expectations.
Since our plasmid PJSG is expressed in constitutive exogenesis, we performed SDS-PAGE on cell culture supernatant to detect its extracellular proteins. Unfortunately, DH5α did not detect any exocrine expression, which may be related to its lack of strong protein expression ability. However, we detected exotic SOD protein in the culture supernatant of transformed Nissle 1917, with the same band size as expected, as shown in figure 10C (red arrow).
 |
 |
Fig.10 A Lane 1 is DH5α intracellular protein without plasmid transformation,
lane 2 is DH5α
intracellular protein transformed into PJSG plasmid, and lane 3 is DH5α intracellular protein.
B transformed into PJSH plasmid. Lane 1 was Nissle 1917 intracellular protein without
plasmid transformation, lane 2 was Nissle 1917 intracellular protein
with plasmid transformation of PJSG.
C Lane 1 was Nissle 1917 extracellular protein without plasmid transformation,
lane 2 was Nissle 1917 extracellular protein with plasmid transformation of PJSG.
For BL21 transformed into PET-S, SDS-PAGE and WB detection were performed. It should be noted that in plasmid design, we did not delete the induction expression system on the original PET-22b (+), but inserted the whole part including promoters, terminators and coding sequences into the polyclonal enzyme restriction site region of PET-22b (+). Therefore, in theory, it can be continuously expressed under the control of constitutive promoter PJ23100 and also support IPTG induced expression. Through the difference of protein expression level between induced and uninduced, it can be proved that this protein is expressed. SDS-PAGE as shown in figure 11 A, the red arrow points to the expressed target protein. Subsequent WB results also showed that the protein was expressed, as shown in figure 10 B.

Fig.11 A Lane PC1 is BSA(1μg).
Lane PC2 is BSA(2μg).Lane NC is cell lysate without induction.
Lane 1 is cell lysate with induction for 16h at 15℃.
Lane 2 is cell lysate with induction for
4h at 37℃.
Lane NC1 is supernatant of cell lysate without induction.
Lane 3 is supernatant
of cell lysate with induction for 16h at 15℃. Lane 4 is supernatant of cell lysate with induction for 4h at 37℃.

B Lane 3 is supernatant of cell lysate
with induction for 16h at 15℃. Lane 4 is
supernatant of cell lysate with induction for 4h at 37℃. Lane 5 Pellet of cell lysate with
induction for 16h at 15℃. Lane 6
Pellet of cell lysate with induction for 4h at 37℃.
We first measured SOD activity of Nissle 1917 cell contents transformed with PJSG plasmid and blank Nissle 1917 cell contents without transformed plasmid as internal reference. Unit enzyme activity was defined as one SOD activity unit (U) when SOD inhibition rate reached 50% in the reaction system. Because the engineered bacterial transfer algebra used for each measurement was different, we treated each measurement as an independent experiment, so we made our own standard protein concentration curve for each batch of measurements. The batch standard curve and enzyme activity are shown in figure 12. SOD activity in Nissle cell contents after transformation was 23.55938 U and 17.91151 U after internal reference was deducted.

Fig.12 A standard curve of protein concentration

Fig.12 B Intracellular superoxide dismutase activity of Nissle 1917 after transformation.
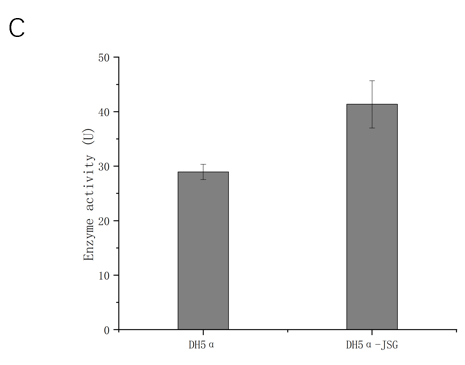
Then we measured SOD activity in the supernatant of Nissle medium with transformed pJSG plasmid and in the blank Nissle medium without transformed plasmid as internal reference to determine the effect of plasmid exosecretion expression. Meanwhile, SOD activity of DH5α cell contents transformed with pJSG plasmid and blank DH5α cell contents not transformed with pJSG plasmid were determined as internal reference. The standard curve and enzyme activity of this batch are shown in figure 13.
After transformation, SOD activity was 3.490339 U in the supernatant of Nissle medium, and 1.475081 U in the supernatant of Nissle medium after deduction of internal reference, indicating low secretion and expression efficiency. It was considered that the culture conditions were not suitable for secretion and expression and the target protein was secreted into the periplasmic space. SOD activity of the transformed DH5α cell contents was 41.35685 U, and 12.40467 U after deducting internal reference. Under the same conditions, the expression efficiency of Nissle 1917 heterologous superoxide dismutase was higher than that of DH5α.

Fig.13 A BSA standard curve
 |
 |
B Superoxide dismutase activity of transformed Nissle 1917 exosecretion.
C Intracellular superoxide dismutase activity of DH5α after transformation.
SOD activity of BL21(DE3) cell contents transformed with PET-S plasmid and blank BL21(DE3) cell contents without transformed plasmid were again used as internal references. At the same time, the activity of SOD enzyme in the supernatant of its culture medium was also determined. The batch standard curve and enzyme activity are shown in figure 14. The intracellular protease activity of BL21(DE3) after transformation was 404.6549 U, and 176.7827 U after deducting internal reference. After transformation, SOD activity in the supernatant of BL21(DE3) medium was 132.1789 U, and after deducting internal reference, SOD activity was 111.7859 U. These results indicated that the plasmid had strong expression ability in BL21(DE3) and could be successfully expressed by exogenesis. Thus, we measured the enzyme activity-time curves as follows, which meet the general enzymological characteristics.

Fig.14 A BSA standard curve.

Fig.14 B Intracellular and extracellular superoxide dismutase activity of transformed BL21(DE3).
 |
 |
C After deducting internal parameters, the change curve of intracellular
SOD activity expressed
by transformed BL21(DE3) with time. D After deducting internal parameters,
the change curve of
SOD enzyme activity expressed in the transformed BL21(DE3) exoskeleton with time.
bile acid metabolism (BSH)
The DNA level
The plasmid PJB was selected for validation, and the transformed plasmid DH5α (DJB) was verified by plasmid running gel and PCR.
As can be seen from figure 15, the sample band was over 5000 bp, basically matching the target band 5477 bp, which proved that our plasmid transformation was successful.

Fig.15 Plasmid was extracted from transformed DH5α and
gel electrophoresis was performed. The target band size was 5477 bp.
In addition to DH5α, PJB was also transferred into Nissle 1917, but the plasmid concentration extracted by Nissle was too low, and no bands were found in the plasmid by gel electrophoresis. We also conducted PCR verification on plasmids of DH5α and Nissle 1917, and DJB was the target fragment. As can be seen from figure 16, after PCR, the sample ran out a band near 2000 bp, and the target fragment was 1876 bp, which was consistent with the target band. This further indicates that our plasmid transformation is successful.

Fig.16 A PCR of plasmid extracted from transformed DH5α.

Fig.16 B PCR was performed on plasmids extracted from transformed Nissle 1917.
The protein level
We then validated the engineered bacteria at the protein level. We first tried to purify the protein using the 6xHis tag attached to BSH protein. We successfully purified the transformed DH5α expressed BSH, but there was no valid data of Nissle 1917, so we could only verify the successful expression by SDS-PAGE, and the results were shown in figure 17. In the purification, BSH was not fully combined, and the presence of hybrid proteins with the same size of BSH resulted in the presence of bands with the same size in the eluent, which was expected. However, due to time constraints, we did not have time to explore the details of elution conditions. Therefore, due to problems in elution gradient, concentration control and sample grafting in the experimental process, there were other miscellaneous proteins in the eluent, but the BSH purified bands were clearly visible, which effectively indicated that the engineered bacteria successfully expressed BSH protein. For Nissle 1917, SDS-PAGE also shows clearly visible bands of expression, as indicated by red arrows.

Fig.17 A SDS-PAGE electrophoresis of affinity purification of transformed
DH5α intracellular protein.

Fig.17 B SDS-PAGE of the transformed Nissle 1917 intracellular protein.
We first for JBSH enzyme activity in the DH5α validation, but we found that in the process of experiment under the condition of 37℃ for the night after the training, engineering bacteria enzyme activity was 0, while the control group had background expression of enzyme activity. When spend the night in 20℃ cooling cultivation, and 37℃ for short periods of time can be measured engineering strains of bile salt water enzyme activity of enzymes, having obvious difference with the control. We hypothesized that the protein formed inclusion body and lost its activity after being cultured at 37℃ for too long. Therefore, crude enzymes were extracted under the condition of overnight culture at 20℃ for enzyme activity measurement.
Bile saline hydrolysate is a combination of bile acid decomposition to produce bile acid and glycine/taurine. We mixed the crude enzyme solution with 0.5 mM sodium glycholate/sodium taurocholate and reacted at 37℃ for 30 minutes and then detected the amino acid content to indicate enzyme activity. BSH enzyme activity was defined as: the amount of amino acid produced by the hydrolysis of conjugated bile saline by crude enzyme in unit time and unit volume, in unit nmol/(min* mL); BSH specific enzyme activity was defined as, the amount of substances produced by the crude enzyme in the total protein in unit time and unit mass to produce amino acids by the hydrolysis of conjugated bile brine, in unit nmol/(min*g).
BSH nmol/(min* mL) : Amino acid concentration (mM) x 1.1/30(min)/0.1(mL) x 1000
Specific BSH activity nmol/(min*g) BSH activity nmol/(min*mL)/total protein content (g/mL)
Compared with DH5α strain, the biliary salinase activity of the engineered strain was increased 5-10 times after transferring PJB plasmid, and the biliary salinase activity of the engineered strain was 267.8 nmol/(min* mL) after subtracting background expression. The activity of sodium taurocholate hydrolase was 155.9 nmol/(min* mL). Subsequently, the JBSH plasmid was transferred into Nissle 1917 for validation. The results showed that the hydrolysis capacity of the engineered strain to the conjugate cholate in Nissle 1917 was improved compared with that in DH5α strain. The enzyme activity of the engineered strain to the glycholate brine was 424.6 nmol min-1 mL-1 after substrating the enzyme activity with the control group. The activity of sodium taurocholate hydrolase was 233.5 nmol min-1 mL-1 as shown in figure 18.

Fig.18 A Standard curve of amino acids.
 |
 |
Fig.18 B Activity of DH5α
bile saline hydrolyase after transformation.
Fig.18 C After transformation,
Nissle 1917 bile saline hydrolyase activity.
In order to more accurately show the difference of enzyme activity between engineering bacteria and common strains, we used BCA method to measure the protein content of crude enzyme used in each experiment process, so as to compare the specific enzyme activity of different strains. As shown in figure 19, after transferring JBSH plasmid, the specific enzyme activity of biliary saline hydrolysate of the engineering strain was significantly improved compared with that of the ordinary strain, achieving the expected effect.

Fig.19 A BCA standard curve.
 |
 |
Fig.19 B Hydrolytic activity of DH5α bile after transformation.
Fig.19 C After transformation, Nissle 1917 bile was enzymatically active in saline solution.
The DNA level
The plasmid PJT was selected for validation and transformed into DH5α and Nissle 1917(NJT). Plasmids were transformed into DH5α for plasmid running gel validation. As can be seen from figure 20, the sample band was about 5000 bp, basically conforming to the target band of 4994 bp, which proved that our plasmid transformation was successful. As the plasmid concentration extracted by Nissle 1917 was too low, PCR validation was carried out on the plasmids in NJT, as shown in figure 20. The target band size was 945 bp, and the actual electrophoresis results met the target band size.
 |
 |
Fig.20 A Plasmid was extracted from transformed DH5α and
gel electrophoresis was performed.
The target band size was 5477 bp.
B PCR was performed on plasmids extracted from transformed Nissle 1917.
The Protein level
We then verified the engineering bacteria at the protein level. Intracellular protein was extracted from the cultured bacteria and purified by affinity with 6xHis tag. The target protein size was 19 kDa. Purification results are shown in figure 21. In the purification, Tes4 protein was not fully combined, and the presence of hybrid proteins with the same size of Tes4 protein led to the existence of bands with the same size in the eluent, which was expected by us. However, due to time constraints, we did not have time to explore the details of elution conditions. Therefore, due to problems in elution gradient, concentration control and sample grafting in the experimental process, there were other hybrid proteins in the eluent, but the purified band of Tes4 protein was clearly visible, which effectively indicated that the engineered bacteria successfully expressed BSH protein. For Nissle 1917, SDS-PAGE also shows clearly visible bands of expression, as shown in red box in figure 21.

Fig.21 A SDS-PAGE of affinity purification of transformed DH5α intracellular protein.

Fig.21 B SDS-PAGE electrophoretic diagram of Nissle 1917 intracellular protein.
Functional representation
We converted the pJTes4 plasmid DH5α and Nissle 1917 cells broken overnight after the training, the supernatant were collected for detection of butyric acid.In order to be more efficient to test whether our engineering bacteria produced butyric acid, the samples were collected for the derivatization of short-chain fatty acids, as figure 22. The benzene ring is introduced, in order to increase its color, which is easier to detect at 248 nm.

Fig.22 Derivatization equation
We diluted the sample 800 times and used Kinetex C18 2.6 μm 100×2.1 mm;
Mobile phase A 0.1% phosphoric acid-water, B 0.1% phosphoric acid-acetonitrile;
Flow rate 0.5 mL/min;
Injection volume 1 μL;
Column temperature 35℃;
The mobile phase gradient was carried out in the following table.
| Time | %A | %B |
|---|---|---|
| 0 | 95 | 5 |
| 1 | 80 | 20 |
| 5.5 | 50 | 50 |
| 5.7 | 60 | 40 |
| 6.5 | 40 | 60 |
| 6.6 | 95 | 5 |
| 7.5 | 95 | 5 |
Table.2 Mobile phase gradient
As shown in the figure 23, we selected butyric acid standard as positive control, LB medium as negative control, WT as wild-type strain Nissle 1917 blank control. Our engineered bacteria samples D (DH5α-JTes4) and NJT(Nissle 1917-JTes4) showed the same retention time as the butyric acid sample. Compared with the negative control and blank control, it can be considered that our engineered bacteria successfully expressed the target protein and produced butyric acid.

Fig.23 Chromatogram of butyric acid
However, the results of wild-type Nissle 1917 chromatogram in the above method showed the shortcomings of this method, which could not completely separate different substances. We hoped to further optimize this method to completely separate substances, but due to time constraints, we failed to optimize the chromatographic conditions, and the chromatogram produced was not ideal. Therefore, we searched for more literature materials to try, and finally we used the following method to separate different short-chain fatty acids, so as to better detect butyric acid.
In the following equation, O-Benzyl Hydroxylamine was replaced with 3-Nitrophenylhydrazine for derivatization, so as to detect the derivatized substance at 355 nm.
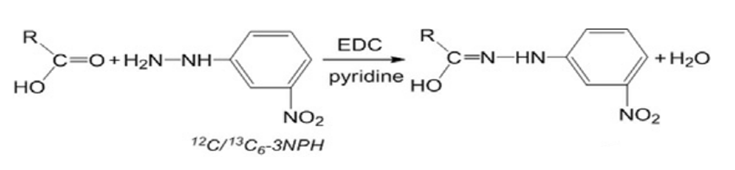
Fig.24 Derivatization reaction equation.
We mixed 0.4 mL of standard solution/sample with 0.2 mL of 200 mM 3-NPH-HCl solution and 0.2 mL of 120 mM EDC-HCl-6% pyridine solution. The mixture was reacted for 45 min at 40℃ and cooled for 1 min after reaction. 14.2 mL water was added to the mixture to obtain 15.0 mL sample solution.
Mobile phase A:water, B:ACN
Flow rate 1.0 mL/min;
Injection volume 20 μL;
Column temperature 25℃;
The mobile phase gradient was carried out in the following table.
| Time | %A | %B |
|---|---|---|
| 0 | 84 | 16 |
| 45 | 63 | 37 |
| 50 | 50 | 50 |
Table.3 Mobile phase gradient
As shown in the figure, we compared the mixed acid (butyric acid + isobutyric acid), butyric acid, Nissle 1917, NJT(Nissle 1917-JTes4) and DJT(DH5α -JTes4). The retention time of butyric acid and butyric acid in the mixed acid is exactly the same, which proves that this chromatographic condition has a good separation effect. At the same time, there are peaks similar to butyric acid in our sample. Although both NJT(Nissle 1917-JTes4) and Nissle 1917 detected only trace amounts of the substance.

Fig.25 Comparison of chromatograms of different samples.
To further confirm the presence of butyric acid in our sample, we mixed DJT(DH5α -JTes4) with butyric acid sample and detected whether their peaks overlapped with each other. The results are as follows.The retention time of DJT(DH5α -JTes4) mixed with butyric acid is the same, and the peak area increases, indicating that there is a certain amount of butyric acid in our sample, but the yield is still low.

Fig.26 Mixed sample comparison.
The DNA level
We selected the plasmid PJL for verification and transformed it into DH5α (DJL) and Nissle 1917(NJL). The plasmid was extracted from the transformed DH5α (DJL) , as shown in figure 25A. The sample band was about 5000 bp and the target band size should be 4677 bp, which was considered to be the open loop conformation of the plasmid. In addition, the plasmid concentration extracted by Nissle was too low, so PCR validation was carried out on the plasmids in DJT and NJT, as shown in figure 27. The target band size was 945 bp, and the actual electrophoresis results met the target band size.

Fig.27 A Plasmid was extracted from transformed DH5α and gel electrophoresis
was performed. The target band size was 4677 bp.

Fig.27 B PCR
was performed on the plasmid extracted from transformed DH5α.

Fig.27 C PCR was performed on the plasmid extracted from transformed Nissle 1917.
The protein level
We validated the engineered bacteria at the protein level. As shown in Figure 28, for DH5α, a 4.5kDa LL37 protein band can be clearly seen in lane 4 compared with the LL37 standard in lane 2 and the control group in lane 5, as indicated by the arrow. The bands are clear and meet the expected size, which confirms the successful expression of our LL37 protein.

Fig.28 SDS-PAGE of LL37 protein from engineered bacteria.
Our DESIGN has introduced that acid-inducible promoter is the endogenous response system of lactic acid bacteria. For E. coli, we need to additionally introduce the gene of the trans-acting factor RcfB to make the acid-inducible promoter express well. Therefore, we constructed a plasmid containing RcfB (pet-RR), and constructed a double plasmid expression system with a plasmid containing an acid-responsive promoter (PYHSG), and transferred it into DH5α. We hope it can be applied to Escherichia coli.
We chose the superoxide dismutase gene to verify whether the promoter can meet the needs of our project. We placed the engineered bacteria(DYHSG-RR) in media with different pH and cultured them to the same concentration, and then tested their intracellular superoxide dismutase activity. We can verify the difference in the activity of the SOD enzyme expressed between the constitutive and acid-inducible expression systems through this experiment and verify the difference in the expression efficiency of the double-plasmid acid-inducible expression system itself under different pH environments.

Fig.29 The transformed DYHSG-RR plasmid, PCR,
restriction gel electrophoresis diagram.
We selected the DYHSG-RR double plasmid system for verification, transformed PUCYH and PET-RR into DH5α, and extracted the plasmid from the plasmid-transformed DYHSG-RR, as shown in figure 29. The sample band is between 5000-7500 bp, which is in line with the purpose. The band size is around 6700 bp. The size of the PCR band is about 1000 bp, and the restriction band is about 2300 bp, both of which are in line with the current band size.

Fig.30 SOD enzyme activity of constitutive promoter and
acid-induced promoter expression system under different pH conditions.
Through comparison, we can find that the expression efficiency of the double-plasmid acid-inducible promoter is higher than that of the constitutive promoter under every pH gradients. The chart also show that the double-plasmid acid-inducible promoter has higher expression efficiency under low pH environmental conditions, and gradually decreases with the increase of pH. This fully demonstrates that the engineered bacteria can successfully perform their role under the acidic intestinal conditions of patients with IBD, but will not start the expression in the neutral intestinal environment of normal people, which perfectly meets the expectations of our project.
The DNA level
The plasmid pet-GluK was selected for verification, and the transformed plasmid DH5α (GluK) was verified by plasmid running gel and PCR. As can be seen from figure 30, the sample band was over 5000 bp, basically in line with the target band of 6540 bp, which proved that our plasmid transformation was successful.
PCR validation was also carried out for plasmids in DH5a (PET-GK), and GluK was the target fragment. As can be seen from the figure 31B, after PCR, the sample ran out a band near 1000 bp, and the target fragment was 904 bp. The sample fragment was consistent with the target fragment, which further indicated that our plasmid transformation was successful.
 |
 |
Fig.31 A Plasmid was extracted from transformed DH5α and
gel electrophoresis was performed.
The target band size was 6540 bp.
B PCR was performed on plasmid extracted from transformed DH5α.
Functional representation
The engineering bacteria transferred into the plasmid were compared with the ordinary strain for experiment. The bacteria were cultured to a plateau stage and then the experiment was started. The bacteria were cultured under different concentrations of glucose. Put them in a 37℃ constant temperature incubator for 12h, and measure them every 0.5h.
Survival rate = this hole OD600/ first measured value * 100%
As shown in the figure 32, compared with the control group, the growth of the bacteria transformed with the plasmids with the glucose-sensitive suicide switch was basically significantly inhibited, and the lower the glucose concentration in the environment, the more significant the inhibition effect was, and the lower the survival rate was reflected in the experiment. The contrast of the line chart shows the difference between the experimental group and the control group. Based on this, we believe that the glucose sensitive kill switch can work normally.

Fig.32 Survival curves of engineering bacteria and control
group under different glucose concentrations.
The ordinate is survival rate
(1.0 is 100% survival rate), and the ordinate is glucose concentration,
which is the concentration gradient of
0%, 0.3125%,
0.625%, 1.25%, 2.5%, 5% and 10% in the system, respectively.
The DNA level
The plasmid PET-Phok was selected for verification, and the transformed plasmid DH5α (phoK) was verified by plasmid running gel and PCR. As can be seen from figure 33 Left, the sample band was over 5000 bp, basically in line with the target band of 7863 bp, which proved that our plasmid transformation was successful.
We also carried out enzyme digestion verification on the plasmid. Marker was 10000 bp. Sample 1 was the target plasmid, and sample 2 was the sample with endonuclease Smal and EcoRl added for enzyme digestion. There was also a smaller band between 5000 bp and 6000 bp, which was consistent with the target band 5239 bp obtained by enzyme digestion, which further indicated that our plasmid transformation was successful.(Figure 33 Right)
 |
 |
Fig.33
Preparations
We need to prepare human myeloid leukemia monocyte THP-1 cell line and RPMI1640 growth medium containing 10% heat-inactivated FBS to cultivate cell at 37℃ ,5% CO2.

Fig.34 Seed solution under microscope 10*20 times.
In addition to preparing THP-1 cells, we also sequenced 16SrRNA gene of our own Nissle 1917 wild-type strain. After the sequencing results returned, Blast comparison was conducted on the NCBI database, it proved that our bacterial strain had extremely high identity with Nissle 1917 complete genome.(Figure 35)

Fig.35 NCBI database comparison results.
In the interview with Dr.Hao Huaijie (HUMAN PRACTICE), we learned that for facultative anaerobe Escherichia coli, the growth rate of bacteria and the way to effectively sterilize bacteria in the end of interaction experiment should be considered before the experiment started.
The former one determined the result of CFU(Colony-Forming Units), and played an important role in the calculation of optimal MOI(Multiplicity Of Infection) value. The latter one, aiming at finding the appropriate antibiotic and concentration to kill the bacteria after the interaction, could prevent the mass death of THP-1 cells after the interaction and ensure that there was still enough cell viability to secrete cytokines.
Therefore, before conducting the formal experiment, we first inoculated the cultured Nissle 1917 wild-type bacterial solution into the liquid medium at a volume ratio of 10%, and the initial OD600 was about 0.1, then we measured the OD value in different culture time points to draw the entire growth curve.

Fig.36 Nissle 1917 growth curve.
It can be inferred from figure 36 that the plateau stage of our bacteria can be reached after 3-4h culture at 37℃, and the OD value at the plateau stage is about 0.6. In all subsequent experiments involving strain culture, we would use the strains that reach the plateau stage after 3-4 hours culture.

Fig.37.Verification of the killing effect of antibiotics on Nissle 1917 A LB medium+10%bacterial solution.
B Cell growth medium+10% bacterial solution. C Cell growth medium+ Penicillin-Streptomycin Solution(100x)
+10%bacterial solution. D Gentamicin 50ug/ml+ Cell growth medium+bacterial solution.
It can be seen from figure 37 that the cell growth medium group and the LB group reached the plateau at about 4h and 2.5h, respectively.
The OD600 of the double antibody group and the gentamicin group has been stable below 0.1, indicating that the double antibody and gentamicin group. It has a significant effect on the killing effect of Nissle 1917. In order to further prove that Nissle 1917 can not survive under double antibodies (100X) and gentamicin (50 μg/mL), further dilution and coating verification is required.

Fig.38 Gentamicin antibacterial verification.
From figure 38, the positive control group showed colony growth, and the negative control group had sterile colonies, which proved that there was no contamination during the experiment, and the result was valid. Gentamicin concentrations of 50 ng/mL and 100 ng/mL had a significant bactericidal effect on Nissle 1917 wide-type, which could be used as a resistance concentration in cell experiments. In subsequent experiments, 100 ng/mL gentamicin was selected as the antibiotic concentration.

Fig.39 calculation formula of CFU(Colony-Forming Unit).
Before formally conducting cell interaction experiments, we first studied the influence on cell viability under different MOIs, we calculated the CFU value according to the above formula (figure 39), and then considered the number of bacteria that need to be added under different MOIs based on the density of cells after seeding in 96-well plate. We chose MOI values from 0.01 to 10 for the experiment, and the cytotoxicity was examined by cell counting kit-8(CCK-8)method.
After the live bacteria were added and interacted with THP-1 cells for up to 2 hours, the supernatant was removed, washed with PBS, and then replaced with a cell growth medium containing 100 ng/mL gentamicin, and then placed in the cell incubator (37℃, 5% CO2 culture) for 22 hours, measure the OD450 value.
As shown in figure 40, the viability of THP-1 cells treated under different MOIs did not vary significantly. Secondly, compared with the control group without added LPS, the viability of THP-1 cells treated with 1 μg/mL LPS was not observed to be significant. It also showed that LPS was not cytotoxic at this concentration. Relatively speaking, the smaller MOI (MOI=0.01) and the larger MOI (MOI=10) had certain cytotoxicity to THP-1 cells. Therefore, in all subsequent experiments, MOI=1 was selected for interaction, and the concentration of LPS was set to 1 μg/mL.

Fig.40 Under different MOI conditions, the cell viability of the groups induced with and without LPS was
determined.
The group without LPS was used as a control, and the added bacteria were all wild-type Nissle 1917.
Formal experiment
Next, we started the formal interaction experiment between bacteria and THP-1 cells. We set up four experimental groups, respectively with Nissle 1917 Tes4, Nissle 1917 SOD, Nissle 1917 BSH, and Nissle 1917 LL-37. In addition, we set up two control groups, the first one with wild-type Nissle 1917 and the other with no bacterial strains.

Fig.41 PMA treated THP-1 cells shown in the microscope(10x40)

Fig.42 Polarized THP-1 macrophages cultured for 24h shown in the microscope(10x40).

Fig.43 THP-1 cells interacted with Nissle 1917 wide-type for 2h and placed for 22h shown in the microscope(10x40) .

Fig.44 In the case of MOI=1, the level of IL-6 cytokines was detected by ELISA. The
negative group was without bacteria, and the control groups were not induced by LPS.

Fig.45 In the case of MOI=1, the level of IL-10 cytokines
was detected by ELISA. The negative group was without
bacteria, and the control groups were not induced by LPS.
The results were shown in figure 44 & figure 45. It could be concluded that when LPS was added for induction, the expression of IL-6 cytokine level in the control group was significantly higher than that without LPS. According to the comparison between the Nissle 1917 wild-type group and the control group, the expression of IL-6 pro-inflammatory factors in the wild-type strain after being inducted by LPS was significantly lower than that of the control group. This reflected that the Nissle 1917 strain itself had a certain anti-inflammatory effect.
At the same time, compared with the control group, the expression of IL-6 pro-inflammatory factors between the four groups of engineered bacteria was reduced to a certain extent, which also showed that the engineered bacteria after modification had a certain anti-inflammatory effect at the cell level. When LPS was added, compared with the negative control, the expression levels of pro-inflammatory factors in the other five experimental groups were higher, but the difference between LPS added and without LPS groups decreased, which to a certain extent indicates that the ability of engineered bacteria inhibit inflammation was stable.
The expression of the anti-inflammatory factor IL-10 was shown in figure 45. The result showed that the engineered strains after modification had nearly the same anti-inflammatory effect as the Nissle 1917 wild-type, which was slightly higher than the control group. This could also prove that Nissle 1917 and the engineered bacteria after modification had a certain anti-inflammatory effect.

