Team:SZU-China/Measurement

Measurement

Detection of SOD enzyme activity by pyrogallol
auto-oxidation method
1. The detection limit of this method is 1.17 U/mL.
2. Definition: The amount of SOD enzyme required to inhibit 50% of the auto-oxidation rate of pyrogallol at 25 ℃ is an enzyme activity unit.
3. Principle: Under alkaline conditions, pyrogallol will undergo auto-oxidation to generate red-orange phenol,
and at the same time, O2-is generated. The auto-oxidation rate of pyrogallol is related to the concentration of O2-. SOD can catalyze the disproportionation reaction of O2- to generate H2O2 and O2,
thereby inhibiting the auto-oxidation of pyrogallol. The inhibition rate of the sample to the auto-oxidation rate of pyrogallol can reflect the quantity of SOD enzyme in the sample.
4. Reagents
4.1 Solution A: pH 8.20, 0.1 mol/L Tris-HCl buffer solution (containing 1 mmol/L Na2EDTA). Weigh 1.2114 g Tris and 37.2 mg Na2EDTA dissolved in 62.4 mL of 0.1 mol/L hydrochloric acid solution, and dilute to 100 mL with distilled water.
4.2 Solution B: 4.5 mmol/L pyrogallol hydrochloric acid solution. Weigh 56.7 mg of pyrogallol (A.R), dissolve in a small amount of 10 mmol/L hydrochloric acid solution, and dilute to 100 mL.
4.3 10 mmol/l hydrochloric acid solution.
4.4 0.200 mg/mL superoxide dismutase.
4.5 Distilled water.
5. Sample preparation Centrifugation is required before the sample is measured, and the supernatant is taken for measurement.
6. Analysis steps
6.1 detection of the auto-oxidation rate of pyrogallol: Add 2.35 mL of A solution, 2.00 mL of distilled water, and 0.15 mL of B solution to a 10 mL colourimetric tube at about 25 ℃. Add solution B and mix immediately and pour into the cuvette,
then respectively measure the initial and 1 min absorbance under the condition of 325nm wavelength. The difference between the two is the auto-oxidation rate of pyrogallol △A325 (min-1). This experiment determines that △A325 (min-1) is 0.060.
6.2 detection of the rate of inhibition of pyrogallol auto-oxidation by sample solution and SOD enzyme solution. According to the above steps,
add a certain amount of sample solution or enzyme solution to make the inhibition rate about 1/2 △A325 (min-1), namely △A'325 ( min-1) is 0.030.
| Test Solution | Blank | Sample Solution | SOD Solution |
|---|---|---|---|
| A solution /mL | 2.35 | 2.35 | 2.35 |
| Distilled water /mL | 2.00 | 1.80 | 1.80 |
| Sample solution or SOD solution /μL | 200 | 200 | |
| B solution /mL | 0.15 | 0.15 | 0.15 |
Tab. 1 Sample addition table for SOD activity detection.
7.Result

Formula.1 SOD enzyme activity calculation formula based on pyrogallol autoxidation method
In the formula: U/mL——SOD enzyme activity unit
△A325——The auto-oxidation rate of pyrogallol
△A’325——The sample solution or SOD enzyme solution inhibits the auto-oxidation rate of pyrogallol
V——The volume of the added enzyme solution or sample solution, in milliliters (mL)
D——The dilution factor of enzyme solution or sample solution
4.5——The total volume of the reaction solution, in milliliter (mL).
The calculation result retains three significant figures.
8.Accuracy
The absolute difference between two independent detection results obtained under repeatability
conditions shall not exceed 10% of the arithmetic mean.
In the process of using the pyrogallol auto-oxidation method to measure SOD enzyme activity, we encountered many problems. One is that the test method has poor sensitivity and requires high-concentration protein samples for detection. Furthermore, the most challenging problem is that the test method requires high reaction specificity, that is, to ensure that only one enzyme is related to the detected effect. Nevertheless, we cannot guarantee that the SOD enzyme has a high purity during the SOD enzyme purification process. The protein solution is an enzyme system composed of multiple components, which will bring interference factors to the test of SOD activity. Even after repeated experiments, we still cannot detect SOD enzyme activity. So we improved our detection method and changed to use the WST-1 method-based kit from Nanjing Jiancheng Institute of Biological Engineering to detect the SOD enzyme activity of engineering bacteria.
Detection of SOD enzyme activity
by WST-1 method
The SOD activity detection kit (WST method) of Nanjing Jiancheng Company is a colour-changing reaction based on WST-1. WST-1 can react with the superoxide anion catalyzed by xanthine oxidase to generate water-soluble formazan dye. This reaction step can be inhibited by SOD. The enzyme activity of SOD can be calculated by colourimetric analysis of the WST-1 product, as shown in figure 1.
When the SOD inhibition rate reaches 50% in this reaction system, the corresponding enzyme quantity is one SOD activity unit (U). The SOD inhibition rate is calculated by the corresponding formula, as shown in formula.2, and then the SOD activity (U/mL) can be further deduced.

Fig. 1 The principle diagram of SOD enzyme activity detection based on xanthine oxidase coupling reaction system and WST-1. XO:xanthine oxidase.
The absorbance of WST-1 itself is very low, and the reaction product is a stable water-soluble product, which improve the sensitivity and specificity of SOD detection, and is suitable for high-throughput screening research. At the same time, when the WST method measures the activity of the SOD enzyme, the maximum inhibition percentage reaches 100%, and it can not be interfered with by some common interference factors so that the detection effect is significantly improved.
| Component | A001-3-1: 48T | Save | |
|---|---|---|---|
| Reagent One | Buffer | 15 mL x1 | Store at 2~8°C for 6 months |
| Reagent Two | Substrate stock solution | 0.07 mL x1 | Store at 2~8℃for 6 months |
| Reagent Three | Enzyme stock solution | 0.15 mL x1 | Store for 6 months below -20 ℃ |
| Reagent Four | Enzyme Diluent | 2 mL x1 | Store at 2~8 ℃ for 6 months |
Tab. 2 The composition of the reagent kit for the detection of superoxide dismutase (SOD).
Preparation of substrate application solution: Substrate stock solution/ Buffer solution is mixed in a volume ratio of 1:200 to form a substrate application solution.
Preparation of enzyme working solution: Enzyme stock solution/ Enzyme diluent is mixed in a volume ratio of 1:10 to make the enzyme working solution.
Detection of SOD enzyme activity
in cultured cells
The cells in suspension culture can be collected directly by centrifugation
(4000 r/min, centrifugation for 10 minutes, discard the supernatant and leave the precipitated cells).
Sample Choose to use repeated freezing and thawing method to break the cells:
add a certain amount of PBS buffer to the EP tube (depending on the amount of bacteria, usually 0.3~0.5 mL for 106 cells) to entirely suspend the cells by pipetting.
Put it directly in liquid nitrogen for 3~5s, immediately transfer it to -20 ℃ refrigerator (20~30s), then take out the water bath to thaw at 37 ℃,
and then repeat the previous 3 times after thawing.
(Be careful not to take it out of the liquid nitrogen and place it directly in a water bath 37 ℃ to thaw so that the EP tube will easily burst
and cause sample loss, so you must use freezing for gradient thawing).
We use biosharp company's BCA protein concentration determination kit to detect protein concentration.
microplate detection operation table
| Control group | Control blank group | Experiment group | Experiment blank group | |
|---|---|---|---|---|
| Sample to be tested (μL) | - | - | 20 | 20 |
| Distilled water (μL) | 20 | 20 | - | - |
| Enzyme working solution (μL) | 20 | - | 20 | - |
| Enzyme Diluent (μL) | - | 20 | - | 20 |
| Substrate application solution (μL) | 200 | 200 | 200 | 200 |
Tab. 3 Superoxide dismutase (SOD) enzyme activity microplate detection operation table.
Mix well, incubate at 37 ℃ for 20 minutes, read on the microplate reader at 450 nm.
1. Definition:
2. Calculation formula in cell sample:

Formula.2 SOD inhibition rate

Formula.3 SOD enzyme activity calculation formula based on WST-1 method
SOD enzyme activity detection results
We first measured SOD activity of Nissle 1917 cell contents transformed with PJSG plasmid and blank Nissle 1917 cell contents without transformed plasmid as internal reference. Unit enzyme activity was defined as one SOD activity unit (U) when SOD inhibition rate reached 50% in the reaction system. Because the engineered bacterial transfer algebra used for each measurement was different, we treated each measurement as an independent experiment, so we made our own standard protein concentration curve for each batch of measurements. The batch standard curve and enzyme activity are shown in figure 2. SOD activity in Nissle 1917 cell contents after transformation was 23.55938 U and 17.91151 U after internal reference was deducted.


Fig. 2 SOD enzyme activity in different chassis bacteria strains and different position detection results.
A. Standard curve of protein concentration.
B. Intracellular superoxide dismutase activity of Nissle 1917 after transformation.
Then we used the SOD enzyme activity of the supernate of the blank Nissle 1917 cells without transforming the plasmid as an internal reference to detect the SOD enzyme activity of the supernate of the Nissle 1917 cells transformed with the PJSG plasmid. Meanwhile, we used the SOD enzyme activity of the contents of the blank DH5α cells without transforming the plasmid as an internal reference to detect the SOD enzyme activity of the supernate of the DH5α cells transformed with the PJSG plasmid. The standard curve and enzyme activity of this batch are shown in figure 3. After transformation, SOD activity was 3.490339 U in the supernatant of Nissle 1917 medium, and 1.475081 U in the supernatant of Nissle medium after deduction of internal reference, indicating low secretion and expression efficiency. It was considered that the culture conditions were not suitable for exocrine expression of the target protein into Periplasmic clearance. SOD activity of the transformed DH5α cell contents was 41.35685 U, and 12.40467 U after deducting internal reference. Under the same conditions, the expression efficiency of Nissle 1917 heterologous superoxide dismutase was higher than that of DH5α.


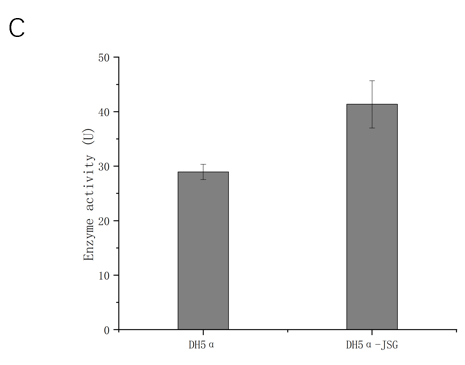
Fig. 3 SOD enzyme activity in different chassis bacteria strains and different position detection results.
A. BSA standard curve.
B. Extracellular superoxide dismutase activity of Nissle 1917 after transformation.
C. Intracellular superoxide dismutase activity of DH5α after transformation.
We used the SOD enzyme activity of the supernate of the blank BL21(DE3) cells without transforming the plasmid as an internal reference to detect the SOD enzyme activity of the supernate of the BL21(DE3) cells transformed with the pET-S plasmid. At the same time, the activity of SOD enzyme in the supernatant of its culture medium was also detected. The batch standard curve and enzyme activity are shown in figure 4. The intracellular protease activity of BL21(DE3) after transformation was 404.6549 U, and 176.7827 U after deducting internal reference. After transformation, SOD activity in the supernatant of BL21(DE3) medium was 132.1789 U, and after deducting internal reference, SOD activity was 111.7859 U. These results indicated that the plasmid had strong expression ability in BL21(DE3) and could successfully achieve exocrine expression. Thus, we measured the enzyme activity-time curves as follows, which meet the general enzymological characteristics.
 |
 |

|
|
Fig.4 Different chassis bacteria strains and different position of SOD enzyme activity detection results.
A.BSA standard curve
B. Intracellular and extracellular superoxide dismutase activity of transformed BL21(DE3)
C. After deduction of internal control, the actual Time-enzyme activity curve of the intracellular SOD in BL21(DE3) after transformation
D. After deduction of internal control, the actual Time-enzyme activity curve of the exocrine SOD in BL21(DE3) after transformation

Fig.5 Mechanism diagram of bile salt hydrolysis enzyme hydrolysis of bile acids
Bile salt hydrolase can break down bile acids to produce bile acids and glycine/taurine. We mixed the crude enzyme solution with 0.5mM sodium glycholate/sodium taurocholate at 37 ℃ for 30 minutes and detected the amino acid content to indicate enzyme activity.
Sample pretreatment
The cells in suspension culture can be collected directly by centrifugation (4000 r/min, centrifugation for 10 minutes, discard the supernatant and leave the precipitated cells).
Sample Choose to use repeated freezing and thawing method to break the cells:
add a certain quantity of PBS buffer to the EP tube (depending on the quantity of bacteria, usually 0.3~0.5 mL for 106 cells) to entirely suspend the cells by pipetting.
Put it directly in liquid nitrogen for 3~5 s, immediately transfer it to -20 ℃ refrigerator (20~30s), then take out the water bath to thaw at 37°C, and then repeat the previous 3 times after thawing.
(Be careful not to take it out of the liquid nitrogen and place it directly in a water bath 37 ℃ to thaw so that the EP tube will easily burst and cause sample loss, so you must use freezing for gradient thawing).
We use biosharp company's BCA protein concentration determination kit to detect protein concentration.
The detection of BSH enzyme activity
Take different concentrations of glycine working solution to measure its absorbance at 570 nm, and draw a standard curve with the concentration of glycine as the abscissa and the absorbance as the ordinate.
| Concentration / mM | 0 | 0.1 | 0.2 | 0.3 | 0.4 | 0.5 |
|---|---|---|---|---|---|---|
| 0.5mM glycine / μL | 0 | 150 | 300 | 450 | 600 | 750 |
| double distilled water/μL | 750 | 600 | 450 | 300 | 150 | 0 |
Tab. 4 Glycine standard curve drawing table.
1. Take three 0.1 mL of the broken bacterial supernatants, and add the following reagents to each:
1 mL 5 mM sodium glycocholate
1 mL 5 mM sodium taurocholate
1 mL of PB buffer (pH=6.8)
After mixing, incubate at 37 constant temperature for 30 min
2. The reaction solution was taken and the amino acid content was determined by ninhydrin colorimetry
3. League Amino Acid (AA) Detection Kit (Ninhydrin Copper Colorimetry)

Formula.4 BSH enzyme activity

Formula 5 BSH specific value enzyme activity
BSH enzyme activity nmol /(min*mL), Amino acid concentration (mM)x 1.1/30(min)/0.1(mL) x 1000 BSH specific value enzyme activity nmol /(min*g) , BSH enzyme activity nmol /(min*mL)/total protein content (g/mL);
BSH enzyme activity is defined as the quantity of the substance that generates amino acids by hydrolysis of bound bile salt by crude enzyme per unit time and unit volume, unit nmol/(min*mL);
BSH specific enzyme activity is defined as unit time, unit mass. The crude enzyme in the total protein hydrolyzes the bound bile salt to generate amino acids in nmol/(min*g).
BSH enzyme activity detection results
We first verify the enzyme activity of JBSH in DH5α, but we found that in the process of the experiment under the condition of 37 ℃ for culture overnight, engineering bacteria enzyme activity was none, while the control group had expression of enzyme activity. However, both cultivating in 20 ℃ overnight and 37 ℃ for short periods of time can be measured BSH emzyme activity, having obvious difference with the control groups. We hypothesized that the protein formed an inclusion body and lost its activity after being cultured at 37℃ for too long. Therefore, the culture conditions of the engineered bacteria were changed to overnight culture at 20°C.
Compared with DH5α strain, the biliary salinase activity of the engineered strain was increased 5-10 times after transferring PJB plasmid, and the biliary salinase activity of the engineered strain was 267.8 nmol/(min* mL) after subtracting background expression. The activity of sodium taurocholate hydrolase was 155.9 nmol/(min* mL). Subsequently, the JBSH plasmid was transferred into Nissle 1917 for validation. The results showed that the hydrolysis capacity of the engineered strain to the conjugate cholate in Nissle 1917 was improved compared with that in DH5α strain. The enzyme activity of the engineered strain to the glycolate brine was 424.6 nmol/(min*mL) after substrating the enzyme activity with the control group. The activity of sodium taurocholate hydrolase was 233.5 nmol/(min*mL) as shown in figure 6.


Fig. 6 BSH enzyme activity in different chassis bacteria strains detection results.
A. Standard curve of amino acids
B. Activity of DH5α bile saline hydrolyase after transformation
C. After transformation, Nissle 1917 bile saline hydrolyase activity
In order to more accurately show the difference of enzyme activity between engineering bacteria and common strains, we used BCA method to measure the protein content of crude enzymes used in each experiment process, so as to compare the specific enzyme activity of different strains. As shown in figure 7, after transferring JBSH plasmid, the specific enzyme activity of biliary saline hydrolysate of the engineering strain was significantly improved compared with that of the ordinary strain, achieving the expected effect.


Fig. 7 BSH specific value enzyme activity in different chassis bacteria strains detection results.
A. BCA standard curve
B. Hydrolytic activity of DH5α bile after transformation
C. After transformation, Nissle 1917 bile was enzymatically active in saline solution
Sample pretreatment
The cells in suspension culture can be collected directly by centrifugation
(4000 r/min, centrifugation for 10 minutes, discard the supernatant and leave the precipitated cells).
Sample Choose to use repeated freezing and thawing method to break the cells: add a certain quantity of PBS buffer to the EP tube
(depending on the number of bacteria, usually 0.3~0.5 mL for 106 cells) to entirely suspend the cells by pipetting.
Put it directly in liquid nitrogen for 3~5s, immediately transfer it to -20 ℃ refrigerator (20~30s), then take out the water bath to thaw at 37 ℃, and then repeat the previous 3 times after thawing.
(Be careful not to take it out of the liquid nitrogen and place it directly in a water bath 37 ℃ to thaw so that the EP tube will easily burst and cause sample loss, so you must use freezing for gradient thawing).
3.Prepare 100 mg C/L of different short-chain fatty acid samples (acetic acid, propionic acid, butyric acid, isobutyric acid, valeric acid, isovaleric acid).
| Group | Name |
|---|---|
| 1 | Mixed acid |
| 2 | LB |
| 3 | LB+Butyric acid |
| 4 | Butyric acid |
| 5 | WT(Nissle 1917) |
| 6 | Nissle 1917-JTes4 |
| 7 | DH5α-JTes4 |
Tab. 5 Different groups of cultured cells
Detection of butyric acid by high
performance liquid chromatography
Use of high performance liquid chromatography
1. Preparations before using the instrument
(1) Processing of sample and mobile phase
The prepared solution needs to be filtered with a 0.45 μm disposable filter membrane. For pure organic phase or a certain proportion of organic phase, use organic filter membrane, and for water phase or buffer salt, use water filter membrane.
Water, methanol, can be used after filtration, the water needs to be re-filtered or replaced with freshwater if stored for more than one day.
The mobile phase containing stabilizer needs to be specially treated or use a chromatographically pure mobile phase.
(2) Replace the cleaning fluid in the cleaning bottle in the pump head,
Different mobile phases need different cleaning solutions. If the mobile phase is a methanol-water system, 50% methanol can be used. If the mobile phase contains electrolytes, 95% deionized water or even high-purity water is usually used.
If the instrument is used frequently, it is recommended to replace it twice a week. If the instrument is rarely used, it must be replaced before each use.
(3) Replace the lotion in the needle washing bottle in the tray, the lotion is generally, 50% methanol.
2. Eliminate bubbles in the pump
The pump must be turned off when opening and closing the exhaust valve. The specific operations are as follows,
(1) When the pump closed, open the exhaust valve.
(2) Select the channel to discharge bubbles and turn on the pump.
(3) Press the "Purge" key at the bottom right of the front panel of the pump, the instrument will automatically and quickly clean the remaining bubbles in the pump at a rate of 6.0 mL/min, and it will stop automatically in 5 minutes.
If you want to stop manually, press the "Purge" key again to stop the cleaning.
(4) Change to other channels to discharge air bubbles.
Note, only one channel can be used to discharge air bubbles when using the quick cleaning valve.
Several channels must not be discharged proportionally at the same time.
The rapid switching of the proportional valve may easily cause damage.
(5) When there are no bubbles in the flow path, turn off the pump and close the exhaust valve.
Note, The exhaust valve cannot be over-tightened or over-tightened. If it is over-tightened, the mobile phase will easily
flow into the pump head from the cleaning valve and cause an alarm.
3. Set the temperature of the column thermostat Press and hold the "+" or "-" key on the column oven until the number starts to flash to set the temperature.
4. System preparation
(1) Flush the flow path with methanol or acetonitrile for about 20 minutes before analyzing the sample,
balance and activate the chromatographic column, and drive away impurities and water in the pipeline.
(2) If the mobile phase is a mixture of the organic phase and water phase,
after the first step is completed, adjust the ratio of the valve according to the needs of analyzing the sample,
and then flush the flow path for about 20 minutes. After the baseline becomes flat, the sample can be injected.
(3) If the flow phase contains buffer salt solutions,
organic/inorganic acids or other electrolytes, after step 1 is completed, rinse the
flow path with 95% deionized water for about 20 minutes, and then adjust the proportional valve according to the needs of the analysis sample After flushing the flow path for about 20 minutes,
the sample can be injected after the baseline becomes flat.
5. Wash the needle
Before making a sample, press the "wash" button on the panel of the autosampler to wash the needle and remove the remaining air bubbles in the needle. If the bubbles in the needle are still not clear,
press the "wash" key again until the bubbles are cleared.
6. Sample injection
(1) Establishment of program files
The pump's flow rate, the ratio of each channel, the autosampler's injection volume, the temperature of the column oven, the detector's wavelength,
and the time required to measure each sample must be specified in the program file.
(2) Establishment of method documents
After sample injection, the software will automatically collect chromatograms,
and a method file is needed to process these spectra, such as integration, qualitative, quantitative.
(3) Establishment of the sample sequence
standard samples there are, samples there are,
volumes are required to be fed, must be specified in the sequence file.
(4) Sampling
(5) Data processing and report printing
SCFA derivatization experiment
1. 0.54 mL of HCl (12.1 M), 0.86 mL of pyridine and 8.6 mL of water, ensure the pH is at 5.0.
2. 1 M EDC (0.096 g) and 1 M O-BHA (0.080 g) were separately dissolved in 50 μL pyridine-HCl solution,
and centrifuged at 23 ℃ and 1000 rpm for 10 min.[1]

Fig. 8 Mechanism diagram of the reaction of SCFA and O-BHA.
3. After centrifugation, add 250 μL H2O and mix well.
4. Add 2 mL of ethyl acetate solution for extraction, mix well, and centrifuge at 23 ℃ and 1000 rpm for 5 min.
5. After the extraction is completed, use a disposable syringe to suck up the lower layer of solution and avoid sucking up
the upper layer of organic solvents.
6. Take out the solution and dilute it 800 times with mobile phase (95% A-5% B), draw 1 mL and put it into a sample bottle.
7. Chromatographic conditions,
Column, Kinetex C18 2.6 μm 100×2.1mm
Mobile phase, A:0.1% phosphoric acid-water, B:0.1% phosphoric acid-acetonitrile
Flow rate, 0.5 mL/min
Injection volume, 1 μL
Column temperature, 35 ℃
Mobile phase gradient
| Time | %A | %B |
|---|---|---|
| 0 | 95 | 5 |
| 1 | 80 | 20 |
| 5.5 | 50 | 50 |
| 5.7 | 40 | 60 |
| 6.5 | 40 | 60 |
| 6.6 | 95 | 5 |
| 7.5 | 95 | 5 |
Tab. 6 Mobile phase gradient.
Chromatographic results
As shown in the figure 9, we selected butyric acid standard as positive control, LB medium as negative control, WT as wild-type strain Nissle 1917 blank control. Our engineered bacteria samples D (DH5α -JTes4) and NJT(Nissle 1917-JTes4) showed the same retention time as the butyric acid sample. Compared with the negative control and blank control, it can be considered that our engineered bacteria successfully expressed the target protein and generated butyric acid.

Fig. 9 High-performance liquid chromatogram of butyric acid.
Optimization of derivatization methods
However, the results of wild-type Nissle 1917 the chromatogram in the above method showed the shortcomings of this method, which could not completely separate different substances. We hoped to further optimize this method to completely separate substances, but due to time constraints, we failed to optimize the chromatographic conditions, and the chromatogram produced was not ideal. Therefore, we searched for more literature materials to try, and finally we used the following method to separate different short-chain fatty acids, so as to better detect butyric acid.
In the following equation, o-benzyl hydroxylamine was replaced with 3-nitrophenylhydrazine for derivatization, so as to detect the derivatized substance at 355 nm.[2]
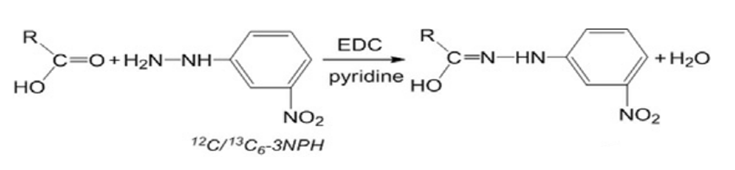
Fig. 10 Derivatization reaction equation.
We mixed 0.4 mL of standard solution/sample with 0.2 mL of 200 mM 3-NPH-HCl solution and 0.2 mL of 120 mM EDC-HCl-6% pyridine solution. The mixture was reacted for 45 min at 40 ℃ and cooled for 1 min after the reaction. 14.2 mL water was added to the mixture to obtain 15.0 mL sample solution
Mobile phase, A:water, B:ACN
Flow rate, 1.0 mL/min
Injection volume, 20 μL
Column temperature, 25℃
The mobile phase gradient was carried out in the following table.
| Time | %A | %B |
|---|---|---|
| 0 | 84 | 16 |
| 30 | 63 | 37 |
| 45 | 63 | 37 |
| 50 | 50 | 50 |
Tab. 7 Mobile phase gradient.
As shown in the figure 11, we compared the mixed acid (butyric acid + isobutyric acid) 、 butyric acid 、Nissle 1917、NJT(Nissle 1917-JTes4) and DJT(DH5α -JTes4). The retention time of butyric acid and butyric acid in the mixed acid is exactly the same, which proves that this chromatographic condition has a good separation effect. At the same time, there are peaks similar to butyric acid in our sample.

Fig. 11 Comparison of chromatograms of different samples.
To further confirm the presence of butyric acid in our sample, we mixed DJT(DH5α-JTes4) with the butyric acid sample and detected whether their peaks overlapped with each other. The results are as follows.The retention time of DJT(DH5α-JTes4) mixed with butyric acid is the same, and the peak area increases, indicating that there is a certain amount of butyric acid in our sample, but the yield is still low.

Fig. 12 Mixed sample comparison.
[1] Jaochico A , Sangaraju D , Shahidi-Latham S K . A rapid derivatization based LC–MS/MS method for quantitation of short chain fatty acids in human plasma and urine[J]. Bioanalysis, 2019, 11(8):741-753.
[2]Simultaneous determination of short‐chain fatty acids in human feces by HPLC with ultraviolet detection following chemical derivatization and solid‐phase extraction segmental elution[J]. Journal of Separation Science, 2019, 42(15):2500-2509.

