Team:SZU-China/Model

Basic Models

In order to better guide our experiment, we successfully built several models. At the beginning of the project, we used ordinary differential equations to make an expression model to predict SOD, BSH and LL-37’s experimental expression based on the constitutive promoter used in the experimental project. For the resistance of the transferred HSP gene to different conditions, we also used the logistic model to predict the growth curve of the bacteria. Then, we reflected the efficiency of SOD to remove ROS in the modelling part and showed that the result was satisfied with the Michaelis-Menten equations.
Introduction
As we are in the process of seeking a possible treatment of IBD, intestinal flora imbalance is a very significant cause. If we can successfully make engineered bacteria express in the intestine through genetic modification, it will help improve the intestinal environment of patients with IBD symptoms. In the following, we built a gene expression model, which consists of two parts: transcription and translation. Genes are transcribed to get mRNAs, and then mRNAs are translated to get proteins. After a specific time, those products will degrade by specific enzymes.
Assumption
(1) At first,we assume that the overall transcription rate is only determined by the copies of the plasmids carrying the target gene fragment in E.coli and the strength of the promoter.
(2) Once the degradation process starts, the translation of the mRNA will stop and the protein will become ineffective. With similar molecular weight sizes, we assume that proteins’ degradation rates are the same, as are the mRNAs.
(3) The concentration of mRNAs and proteins studied in the model are zero at the beginning.
Variables
In the beginning, we can find all the variables from Table.1
| Variable | Biochemical species | Units |
|---|---|---|
| mRNASOD | The number of SOD's mRNA | Molecules |
| SOD | The number of SOD | Molecules |
| mRNABSH | The number of BSH's mRNA | Molecules |
| BSH | The number of BSH | Molecules |
| mRNALL-37 | The number of LL-37's mRNA | Molecules |
| LL-37 | The number of LL-37 | Molecules |
Table.1 Variables, Biochemical species and Units in the Expression model.
Paramaters
As we mentioned,there are several important constant parameters in the expression model.Among them, the average number of copies of pUCJ plasmid in E. coli cells was 600[1].The size of mRNASOD was 753bp, with the size of mRNABSH and mRNALL−37 were 972bp and 114bp.And the SOD protein sizes was 251aa[2]. Also, the BSH protein sizes was 324aa, the LL-37 protein size was 38aa.The J23100 polymerase transcription speed is 0.0219 nt/s[3]. According to our literature research the translation rate is 17.1 amino acids/second, the average degration rate is 0.0028 molecules per second of mRNA in E.coli (Selinger et al.2003). Similar to this, we get the parameter values can be obtained from the Table.2:
| Paramater | Description | Units |
|---|---|---|
| cSOD | The transcription rate of SOD | min-1 |
| pSOD | The translation rate of SOD | min-1 |
| dSOD | The degradation rate of SOD | min-1 |
| dm1 | The degradation rate of SOD's mRNA | min-1 |
| cBSH | The transcription rate of BSH | min-1 |
| pBSH | The translation rate of BSH | min-1 |
| dBSH | The degradation rate of BSH | min-1 |
| dm2 | The degradation rate of BSH's mRNA | min-1 |
| cLL-37 | The transcription rate of LL-37 | min-1 |
| pLL-37 | The translation rate of LL-37 | min-1 |
| dLL-37 | The degradation rate of LL-37 | min-1 |
| dm3 | The degradationrate of LL-37's mRNA | min-1 |
Table.2 Parameter and values in the Express.
Cellular Equations
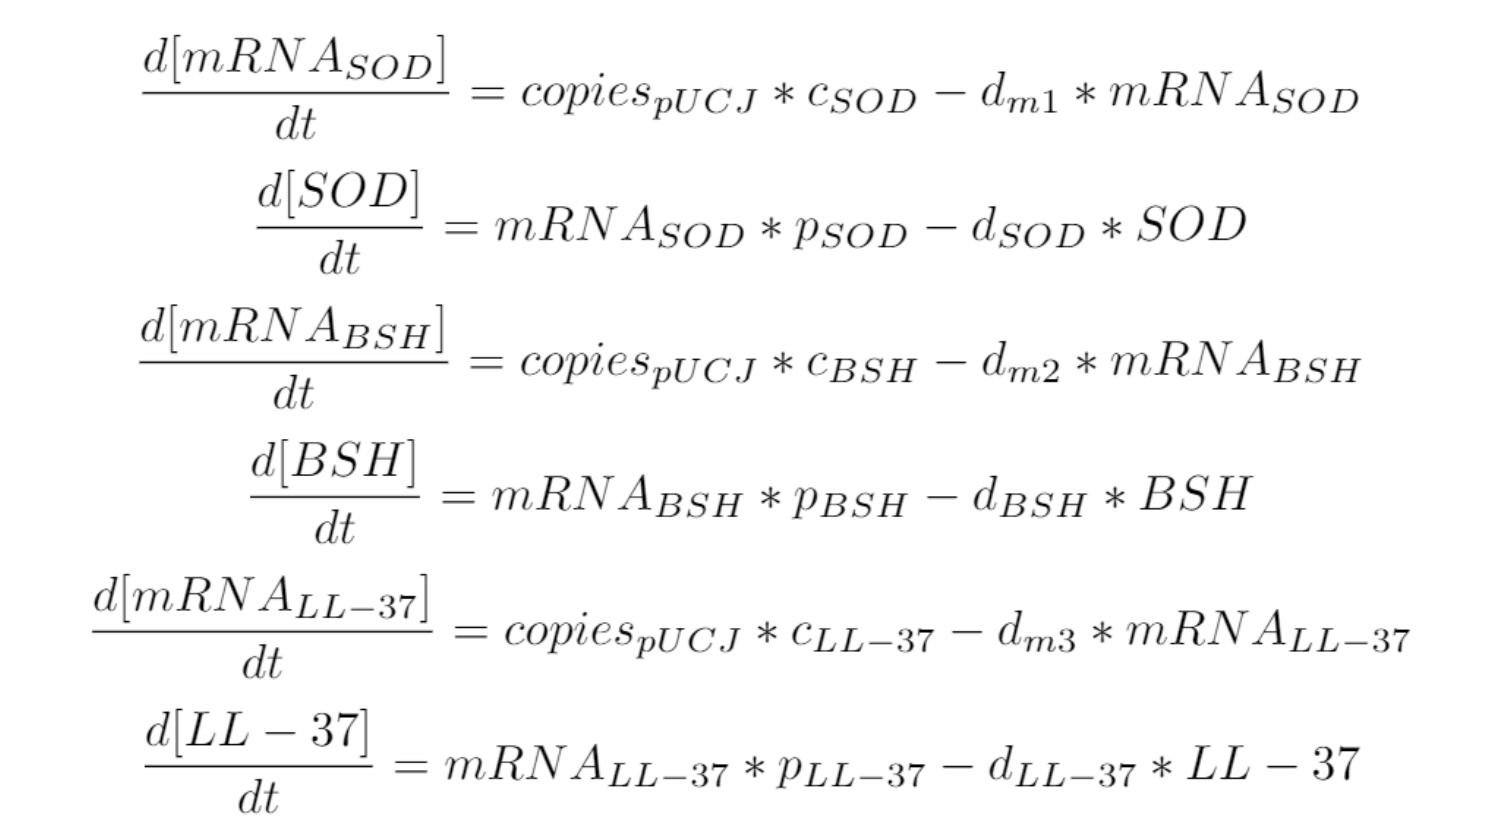
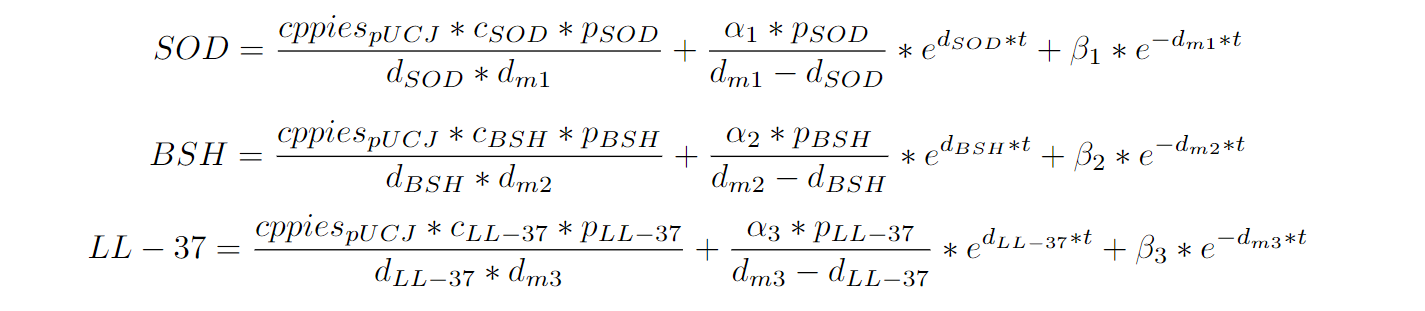
Next, we try to solve these two ordinary differential equations in matlab, and we get, where α and β are integral constants:
Expression Model:ODE model
We can obtain the following prediction image figure.1 in matlab.
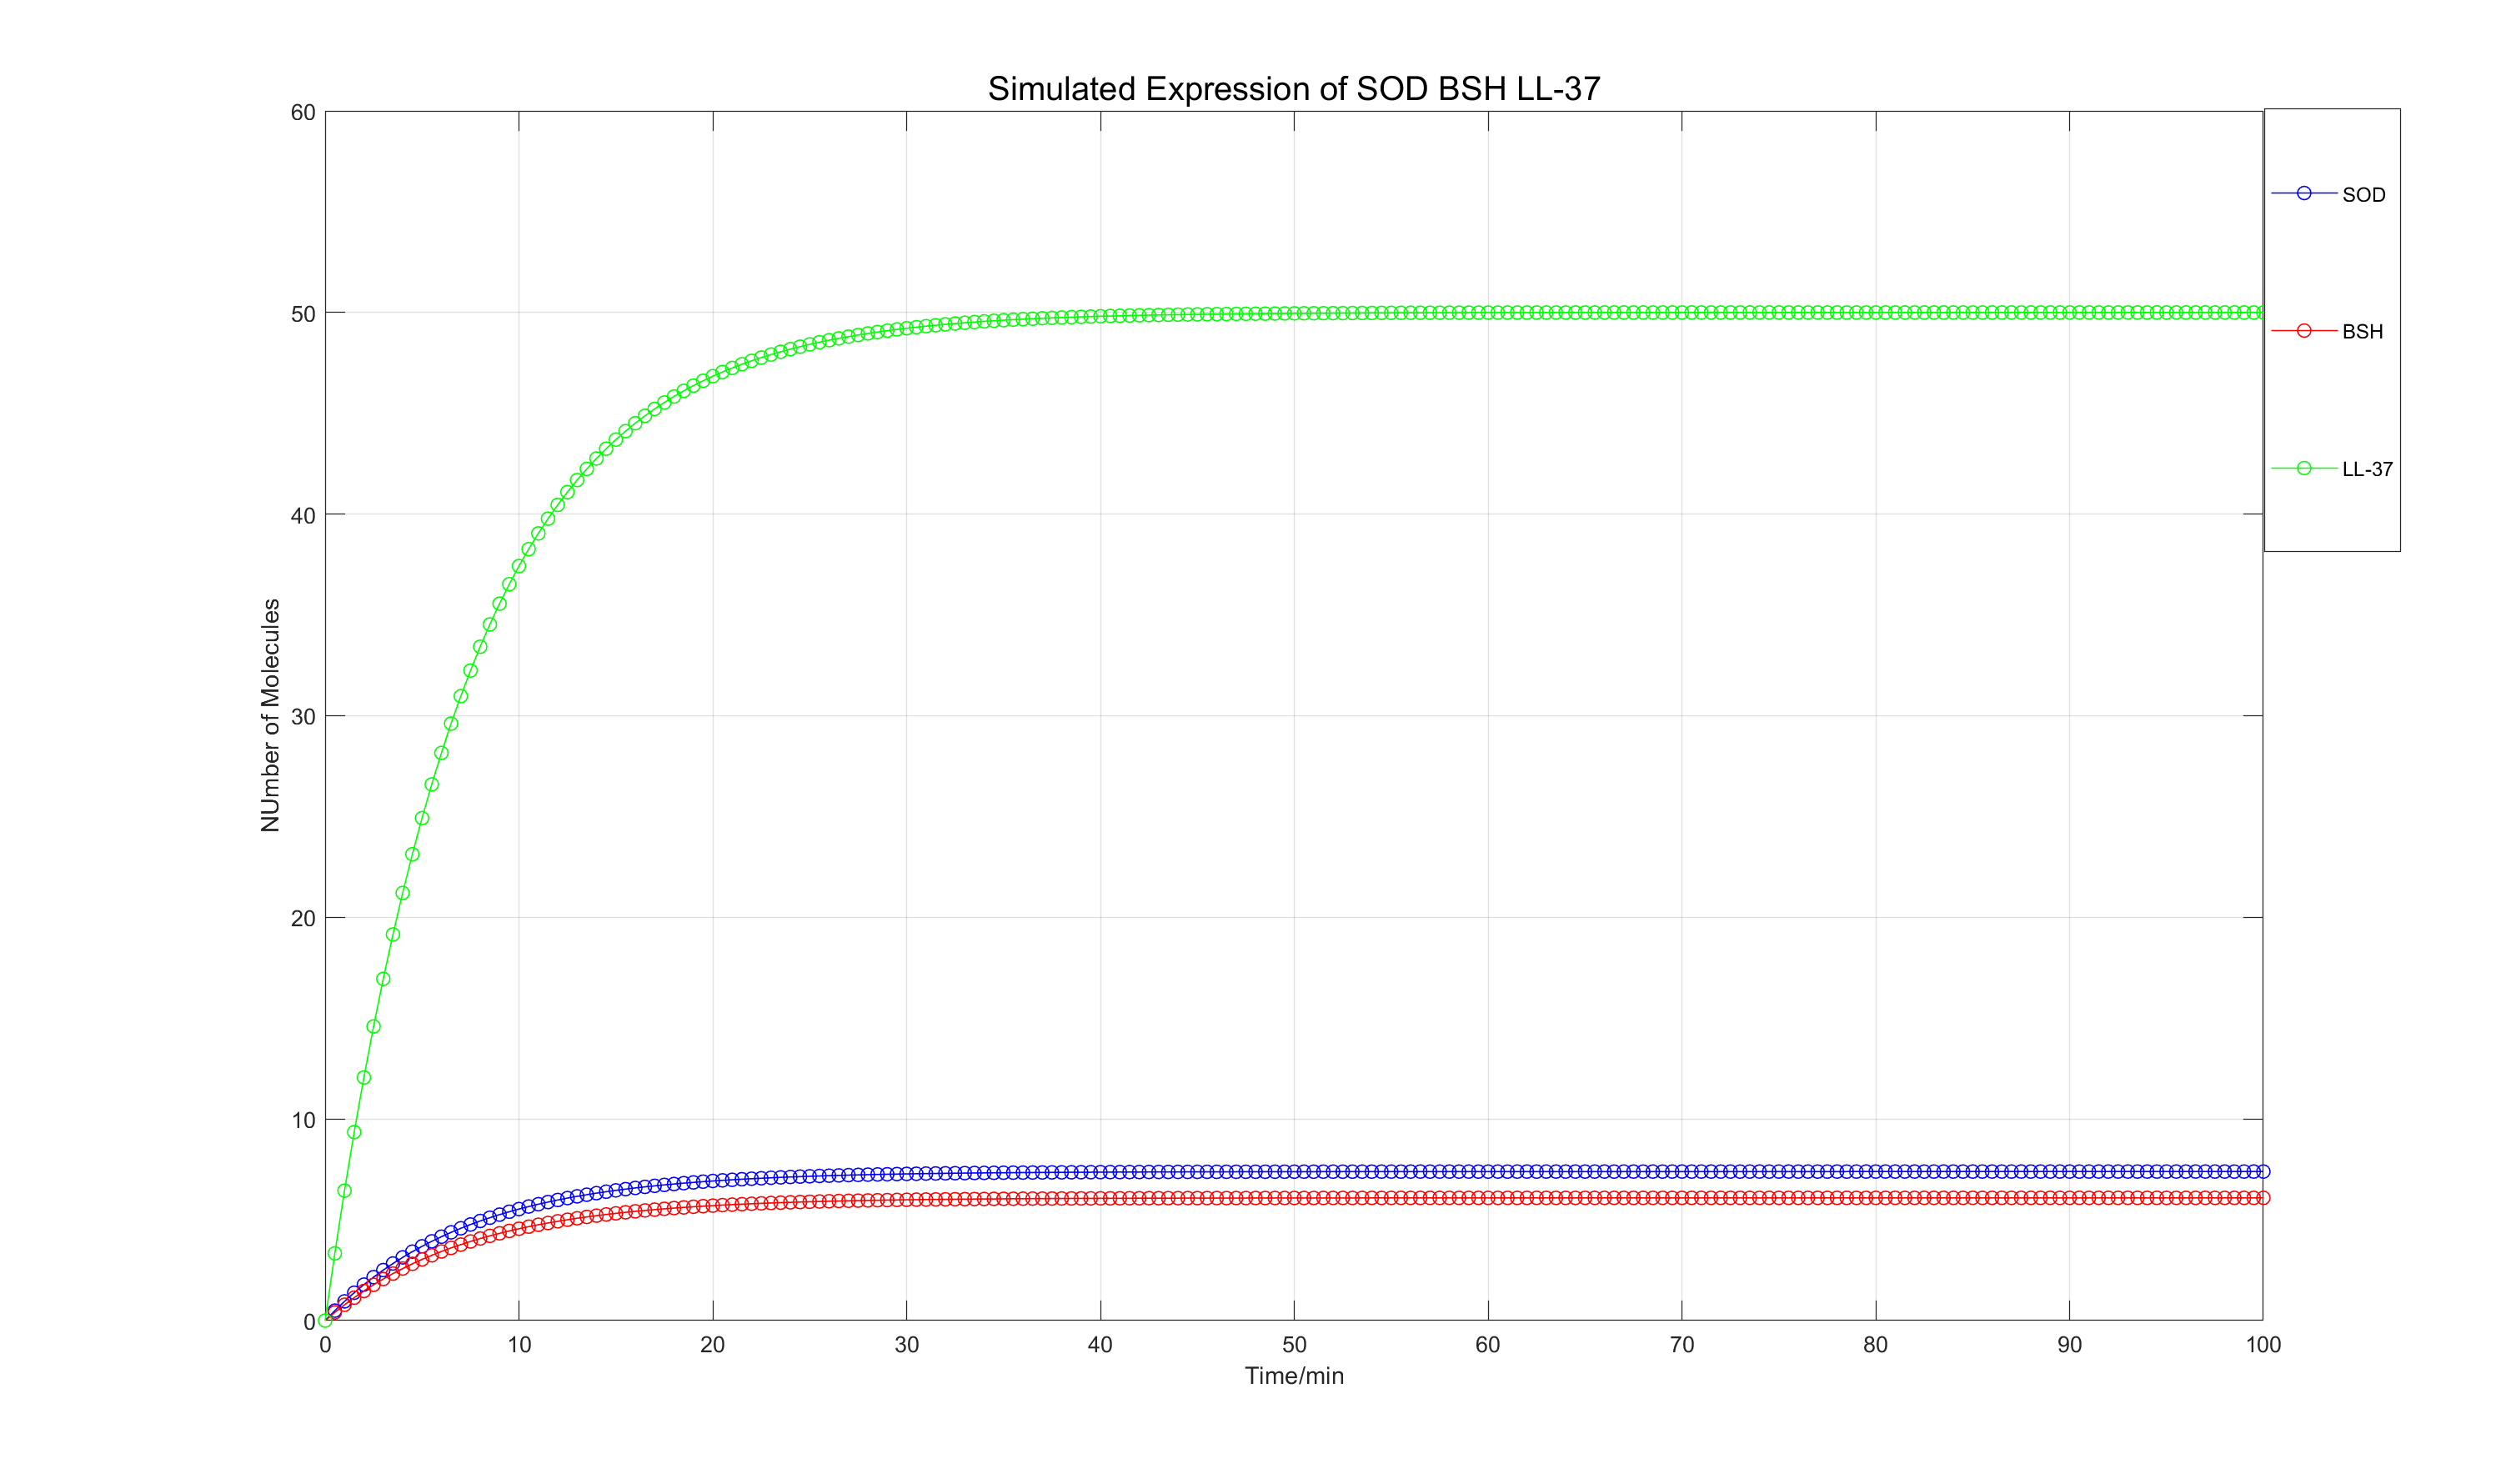
Fig.1 Expression Model:ODE model
In this result, we can find the time for the protein to reach its peak is about 50min.Using the modelresult, in the experiment, we made it express for a certain period of time, and it has reached the levelof expression we expect to achieve.
Introduction
Literature studies have shown that only overexpression of heterologous SOD by engineered bacteria can significantly reduce the peroxidation in the inflamed colon of IBD model mice[4]. In our experiment, we hope to use a heterologous exocrine expression system to express superoxide dismutase.Therefore, we built this clearing ROS Model with the Michaelis-Menten equation, an enzyme kinetic model to show the relationship between the enzymatic reaction ratev, the substrate concentration [S], and theenzyme concentration [E].
Basic Model
Enzymatic reactions generally obey the following equation:
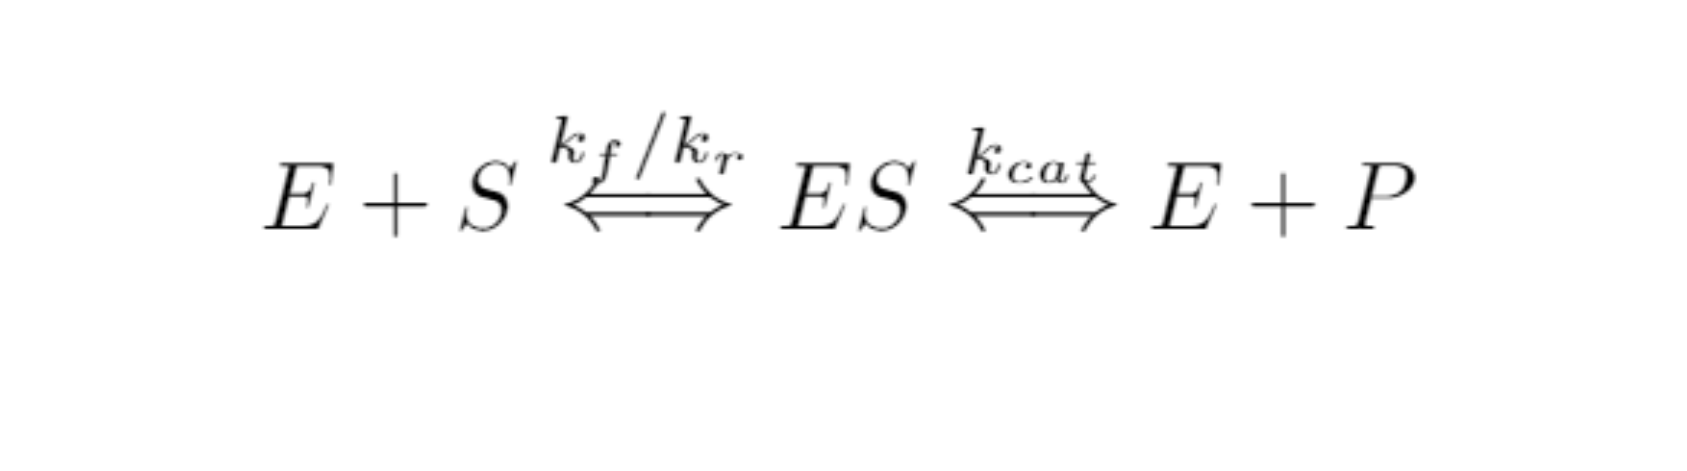
The removal of ROS by SOD certainly conforms to this equation, where the concentration of enzyme is, of course, the concentration of SOD, and the concentration of substrate is the concentration of ROS. However, it is difficult to measure the enzyme activity of SOD during the experiment directly. After using the kit developed by Njjcbio, our students in the experimental group can obtain the SOD inhibition rate by measuring the indirect substance, thereby measuring the enzyme activity. The principle equation is as follows:
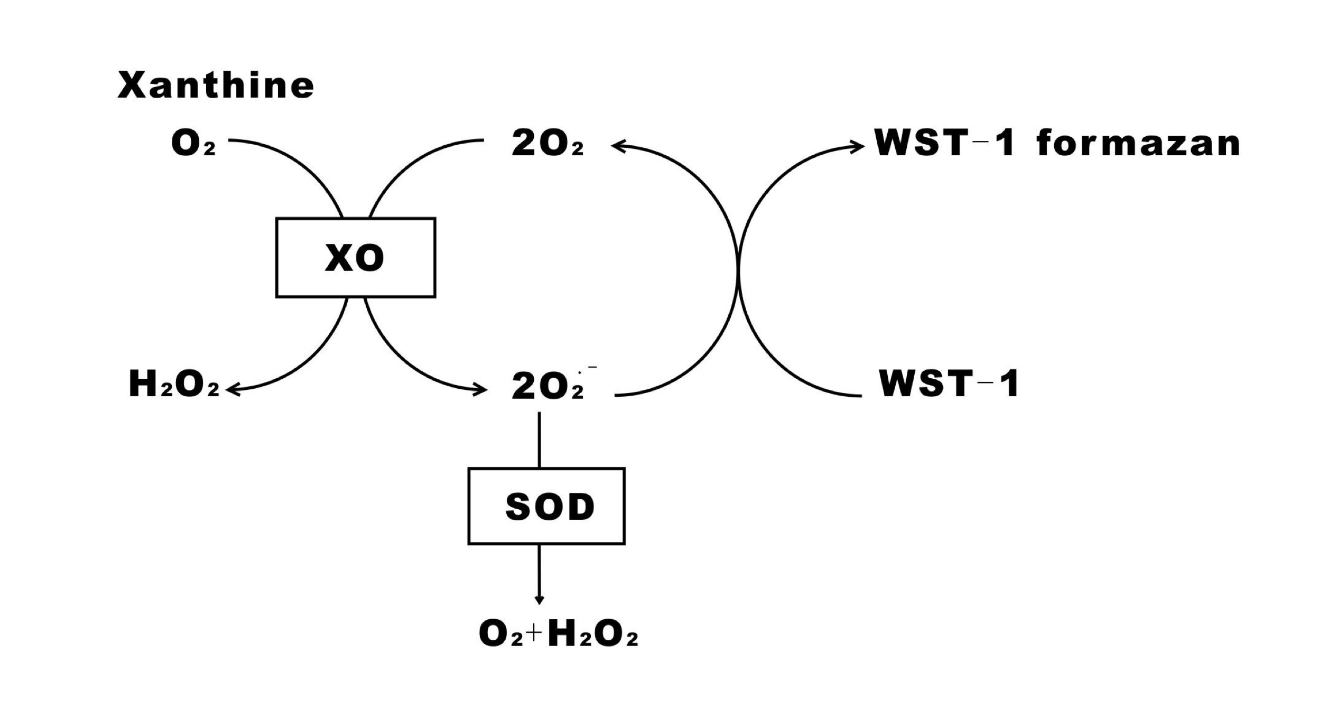
Fig.2 Clearing ROS:Enzyme-driven dynamics model.
Meanwhile, when processing the absorbance data of the experimental data, we use the Beer-Lambert law[6] to convert the absorbance to the substrate concentration according to the standard concentration of 100μg/mL.
Parameters
The following figure is the parameters of this model:
| Parameter | Representative |
|---|---|
| E | Enzyme Concentration |
| S | Substrate Concentration |
| ES | Enzyme-Substrate Complex |
| P | Product |
| Km | Michaelis Constant |
| kf | Forward Rate |
| kr | Reverse Rate |
| kcat | Catalytic Rate |
Table.3 Parameters for Enzyme-driven Dynamics Model.
Cellular Equations
We can obtain the following equations:
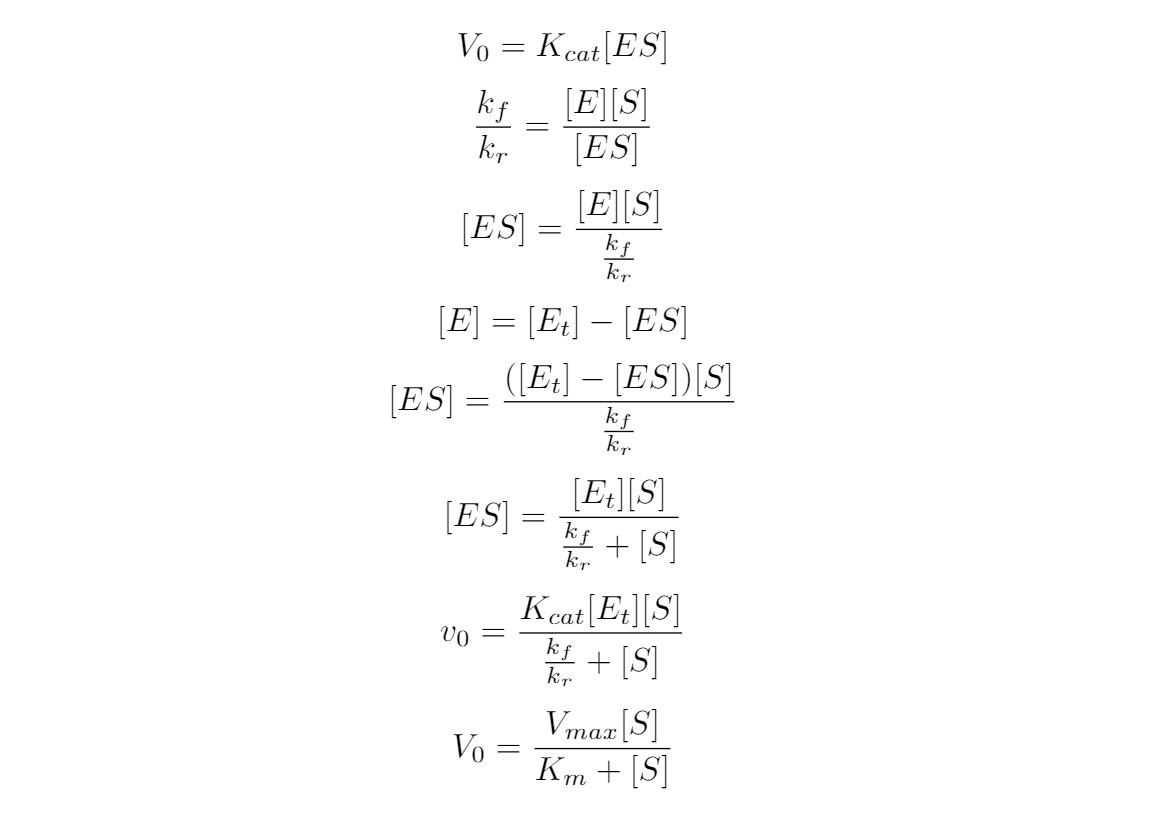
Clearing ROS:Enzyme-driven dynamics model
After obtaining the experimental data, we use the software Matlab2018 to perform a nonlinear fitting analysis on the data to obtain the substrate concentration and reaction rate curve, and it is easy to fit the value of the Michaelis constant.
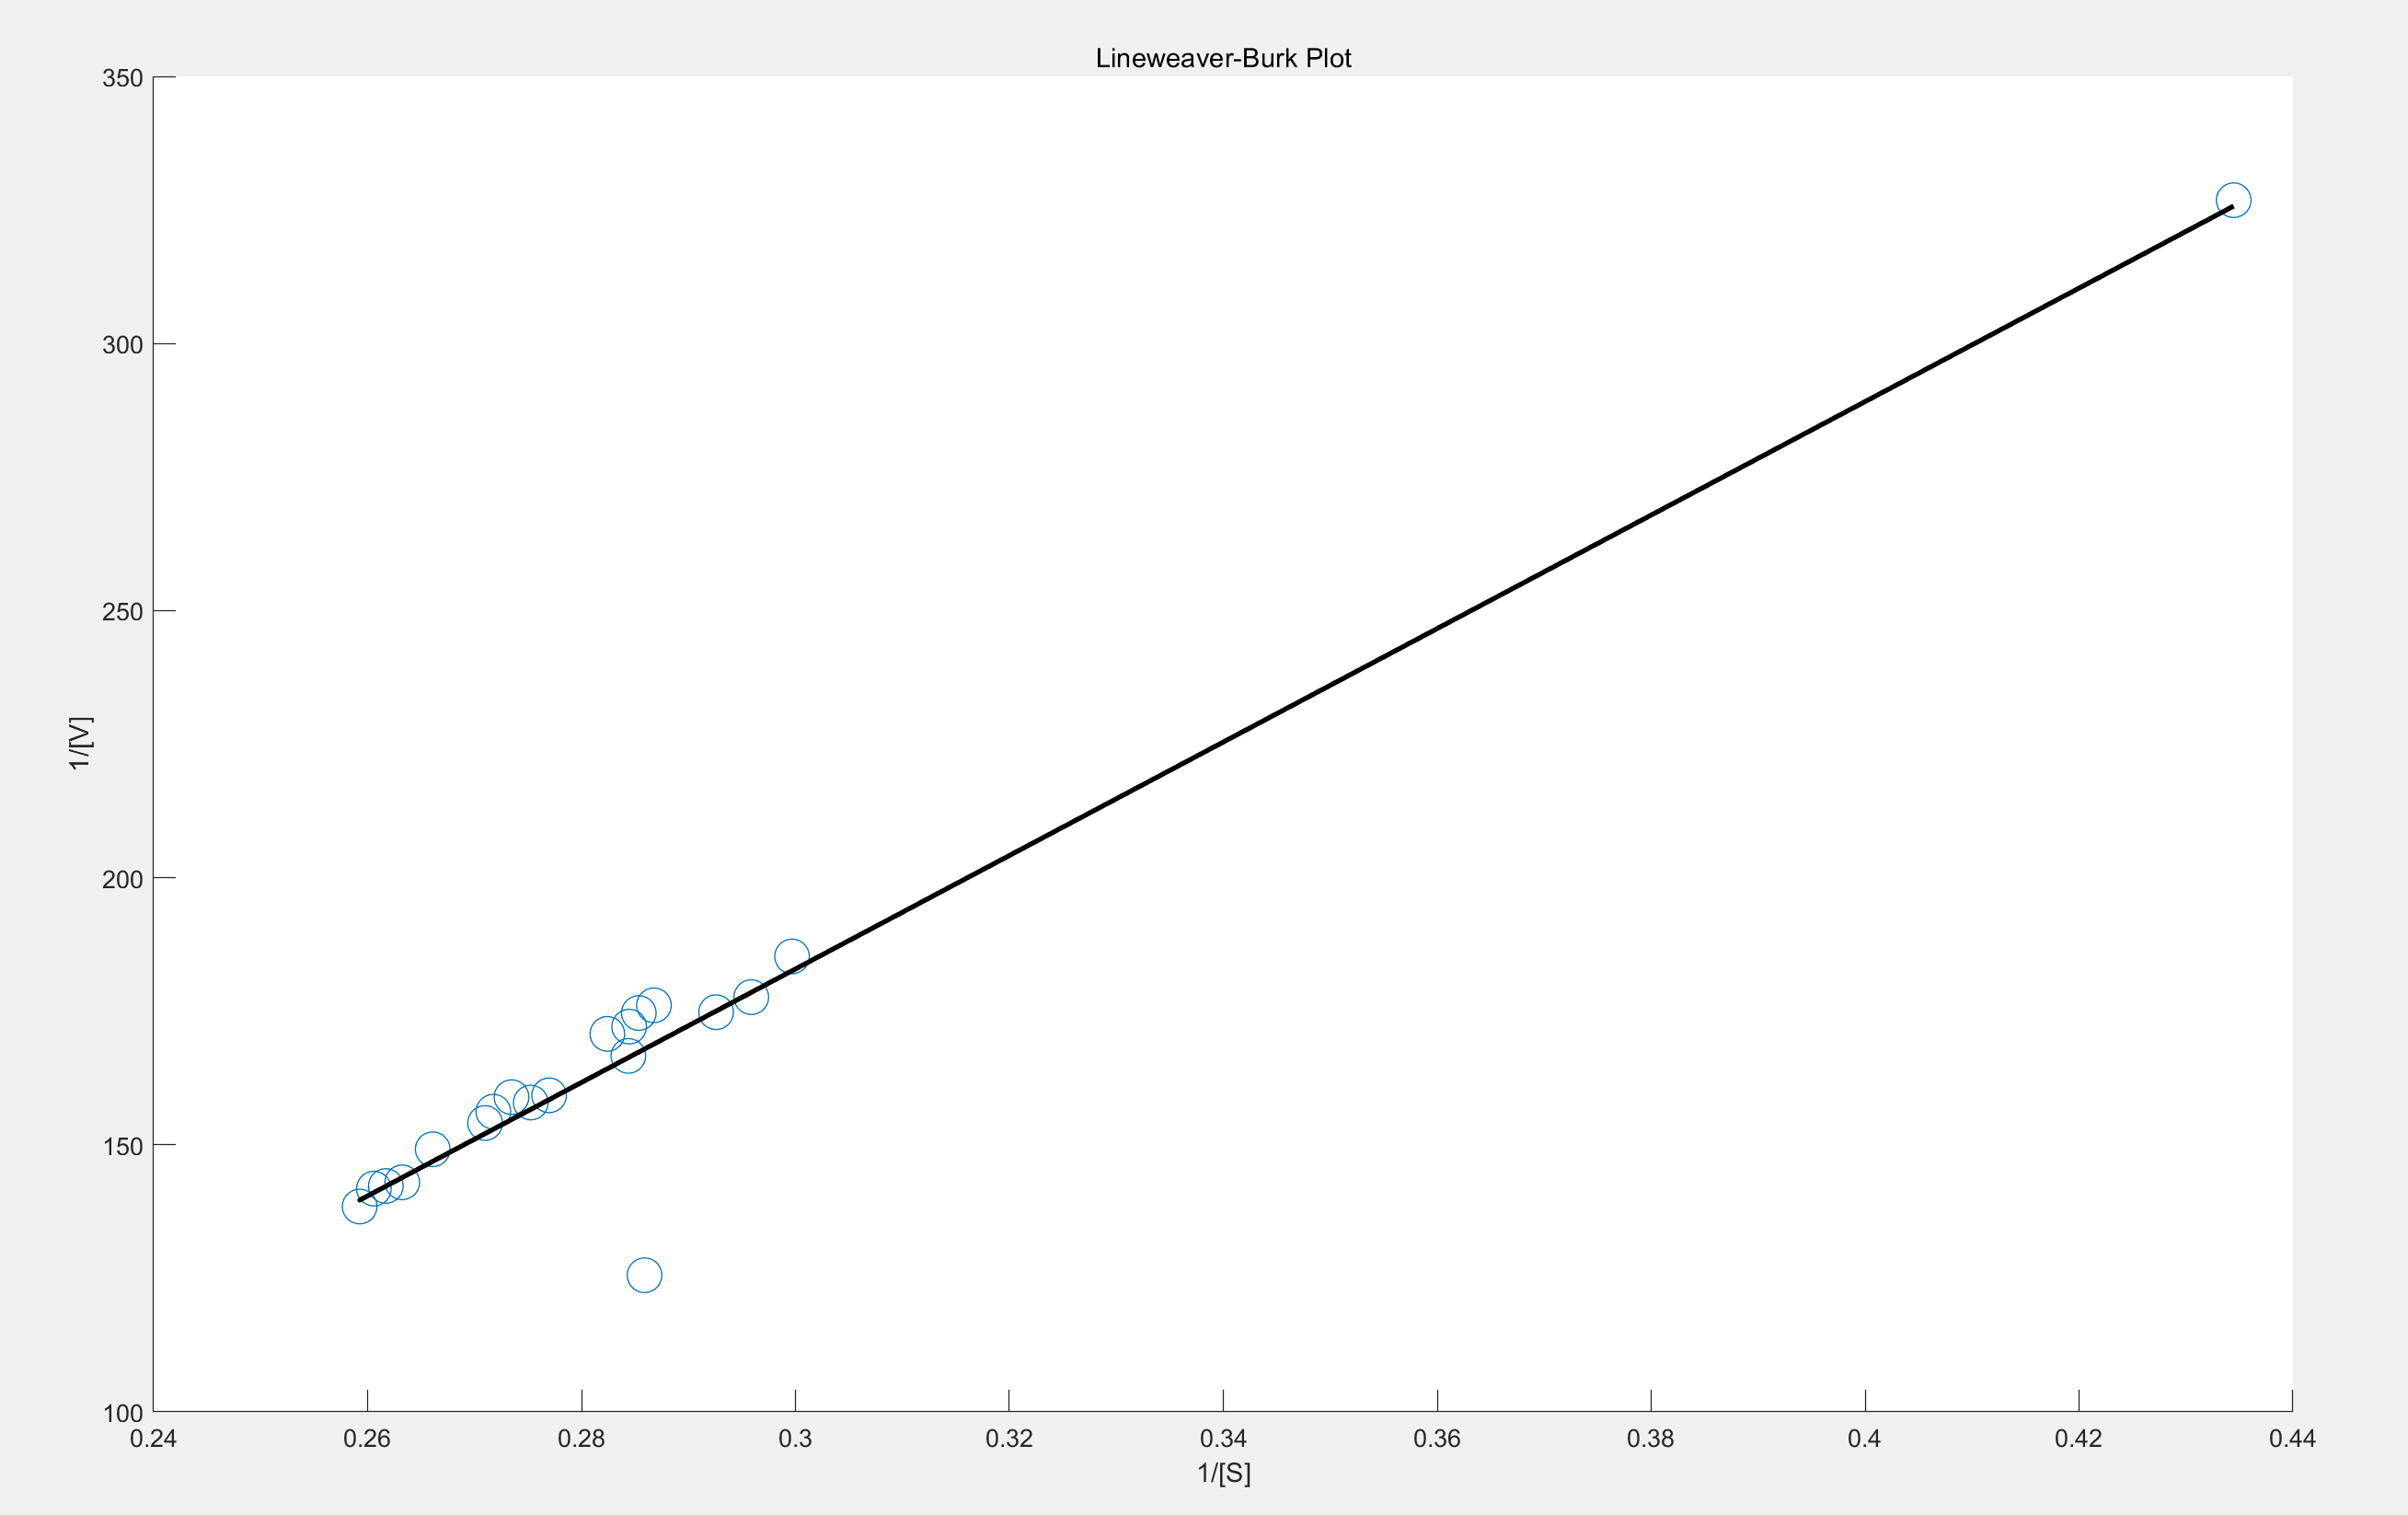
Fig.3 Clearing ROS: fitting result.
This enzymatic reaction also follows the law of the Michaelis-Mente equation. First, it is a first-order reaction, and the reaction rate increases approximately linearly with the increase in substrate concentration. Then there is a mixed-stage reaction, which tends to be gentle, and finally, a zero-order reaction is carried out, and the reaction rate no longer rises with the increase of the substrate concentration. From the figure, we plot 1/[V] vs 1/[S] to get a straight line, the intercept of the line on the Y axis is 1/Vmax, and the intercept on the X axis is the absolute value of 1/Km.
Introduction
We have processed lots of work in resistance tests of HSP gene screening which include different temperature and specific environments. In order to explore whether the engineering bacteria with HSP gene have better resistance after transforming plasmids. During this part, we can show under extreme conditions, the survival rates have great difference. We bulit the basic logistic model to describe and prescribe the population of the engineering bacteria between experiment group and control group.
When the growth environment of escherichia coli is changed, the population number change remains continuous. It satisfies the differential equation model.
Assumption
(1) Assuming that when the growth value of the bacteria is at a plateau, there is no change in other growth conditions except for the changed stress conditions.
(2) We set up three sets of experiments by adding three different stresses, temperature, ethanol, and hydrogen peroxide.
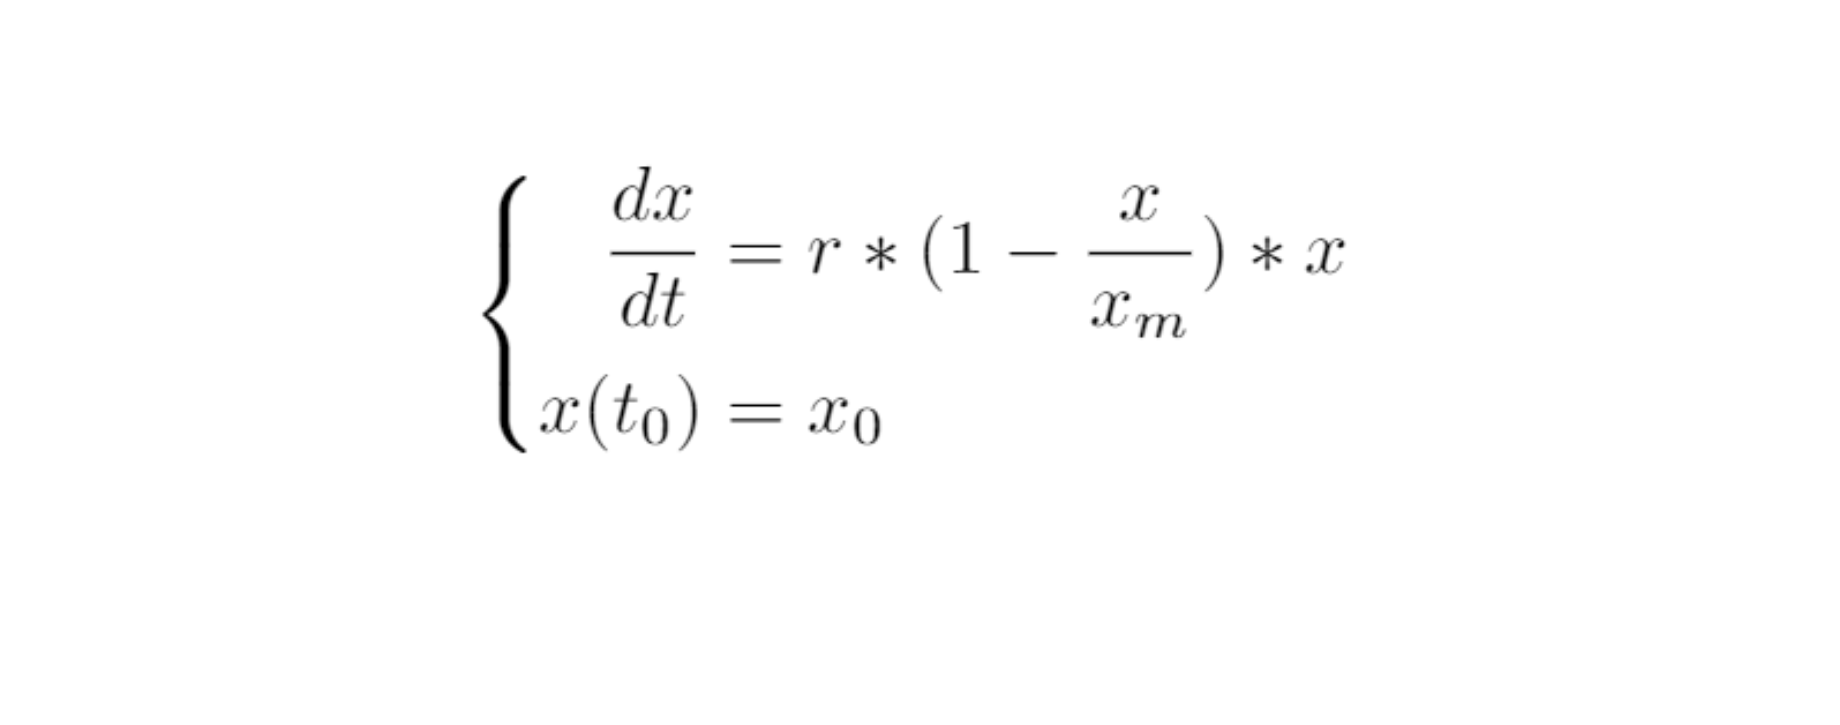
(3) When the x(t) is the population number in year t, we assume the population growth rate r(x) is a linear function of x:

(4) Assuming the maximum population number is Xm in a limited environment:

Then we can get:
Varaibles
The following table is the variable of this model:
| Variables | Description | Units |
|---|---|---|
| T | The growth time of bacteria | hour |
| X | The OD600 value of bacteria | / |
| BJSG | Engineered bacteria carrying the HSP gene | / |
| BPUCB | Engineered bacteria without the HSP gene | / |
Table.4 The variables of logistic model.
Parameters
The following table is the paramaters fitted by nonlinear least square estimation:
| Variables | Description | Units |
|---|---|---|
| r | Hourly growth rate of bacteria | OD600 value/hours |
| Xm | The maximum number of bacteria that the environment can hold | OD600 value |
Table.5 The parameters of logistic model.
Cellular Equations
We obtained the following equation:
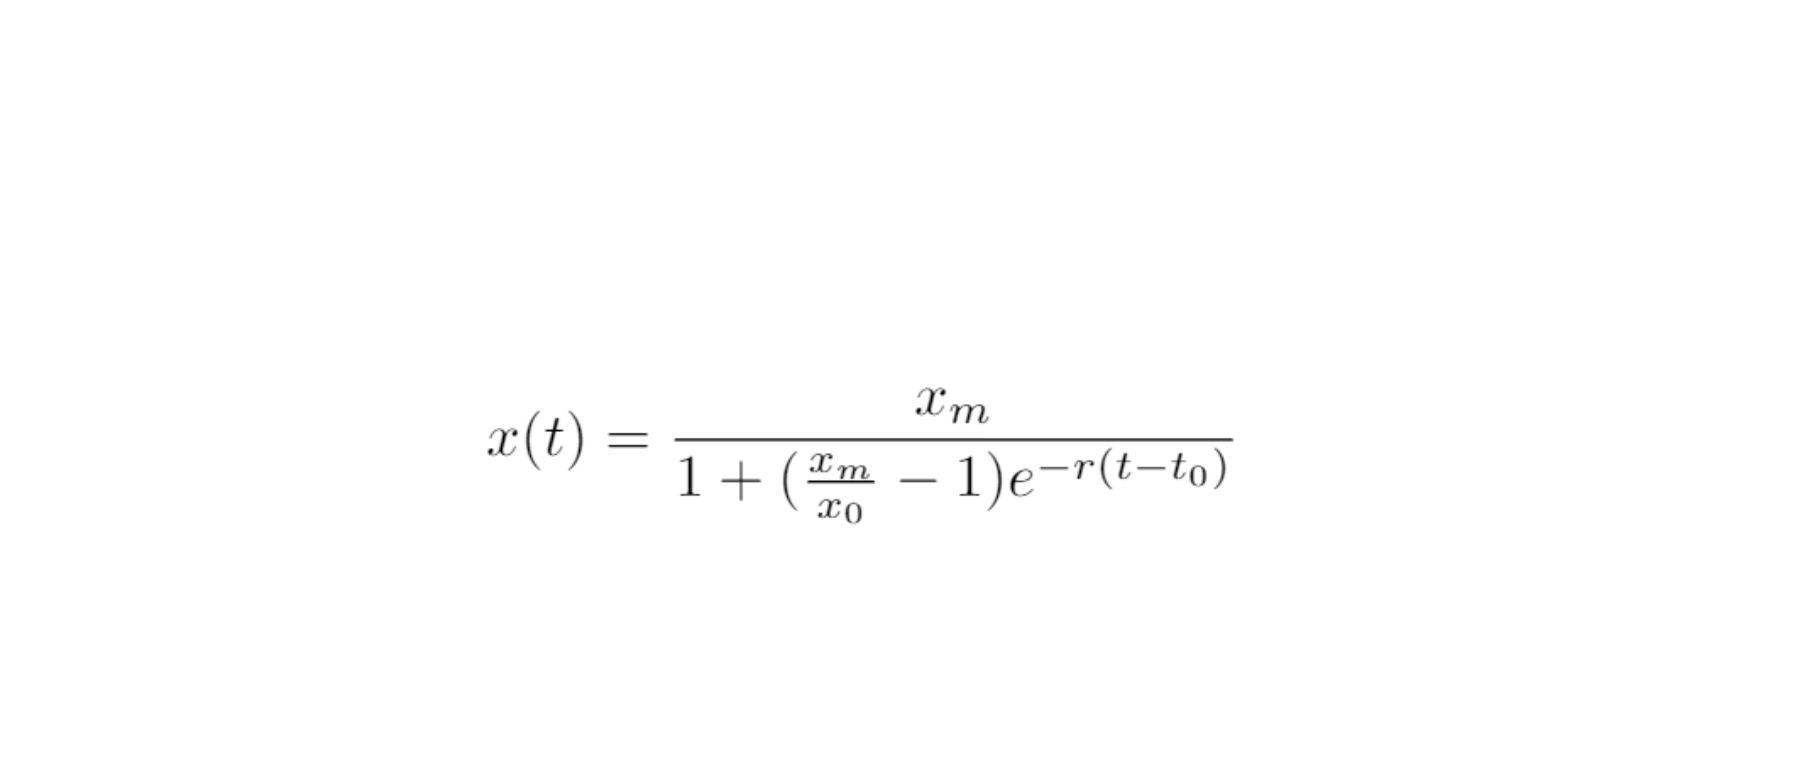
Logistic Model: Equation
After obtaining the experimental data, we use the software Matlab2018 to perform a nonlinear fitting analysis on the data to obtain the growth curve of bacteria:
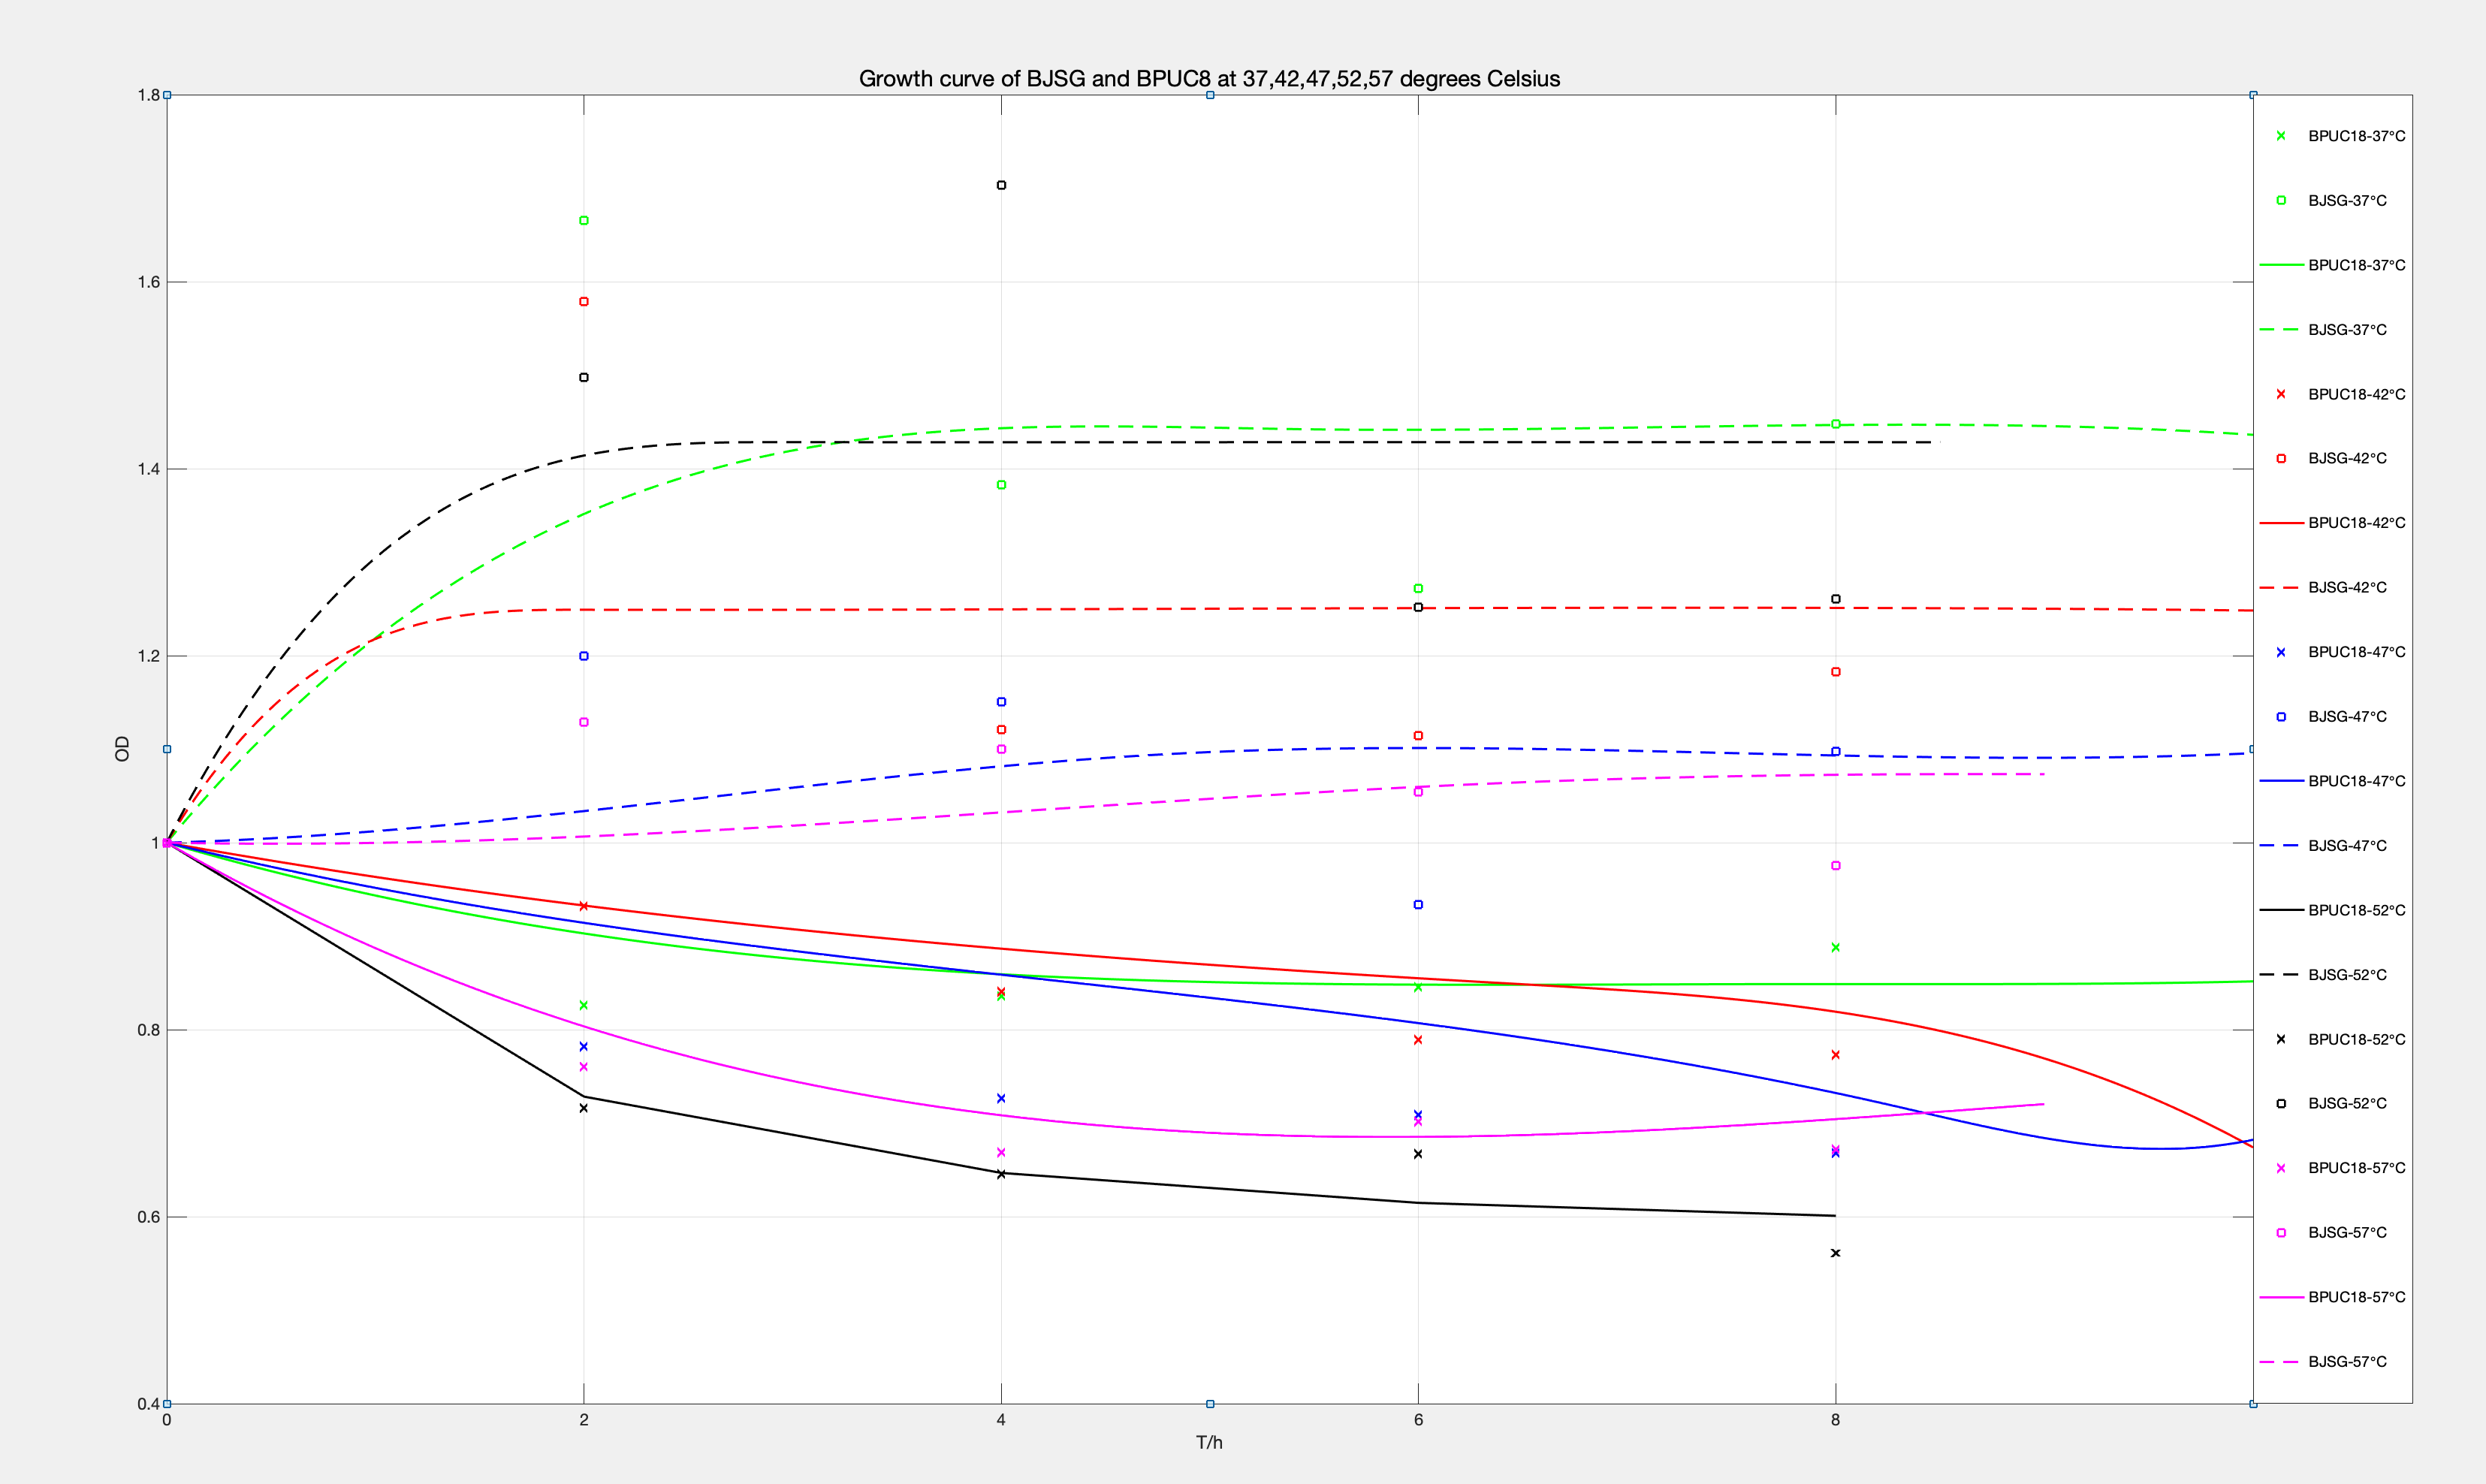
Fig.4 Logistic Model: Growth cruve of BJSG and BPUCB at 37,42,45,47,52 C。
The graph reflecting different temperatures demonstrates two parts, the dotted line part is the engineered bacteria that successfully expressed the HSP gene, while the solid line part is the control group. The modeling results also reflect that engineered bacteria with HSP genes have better resistance to stress than ordinary bacteria in terms of temperature.
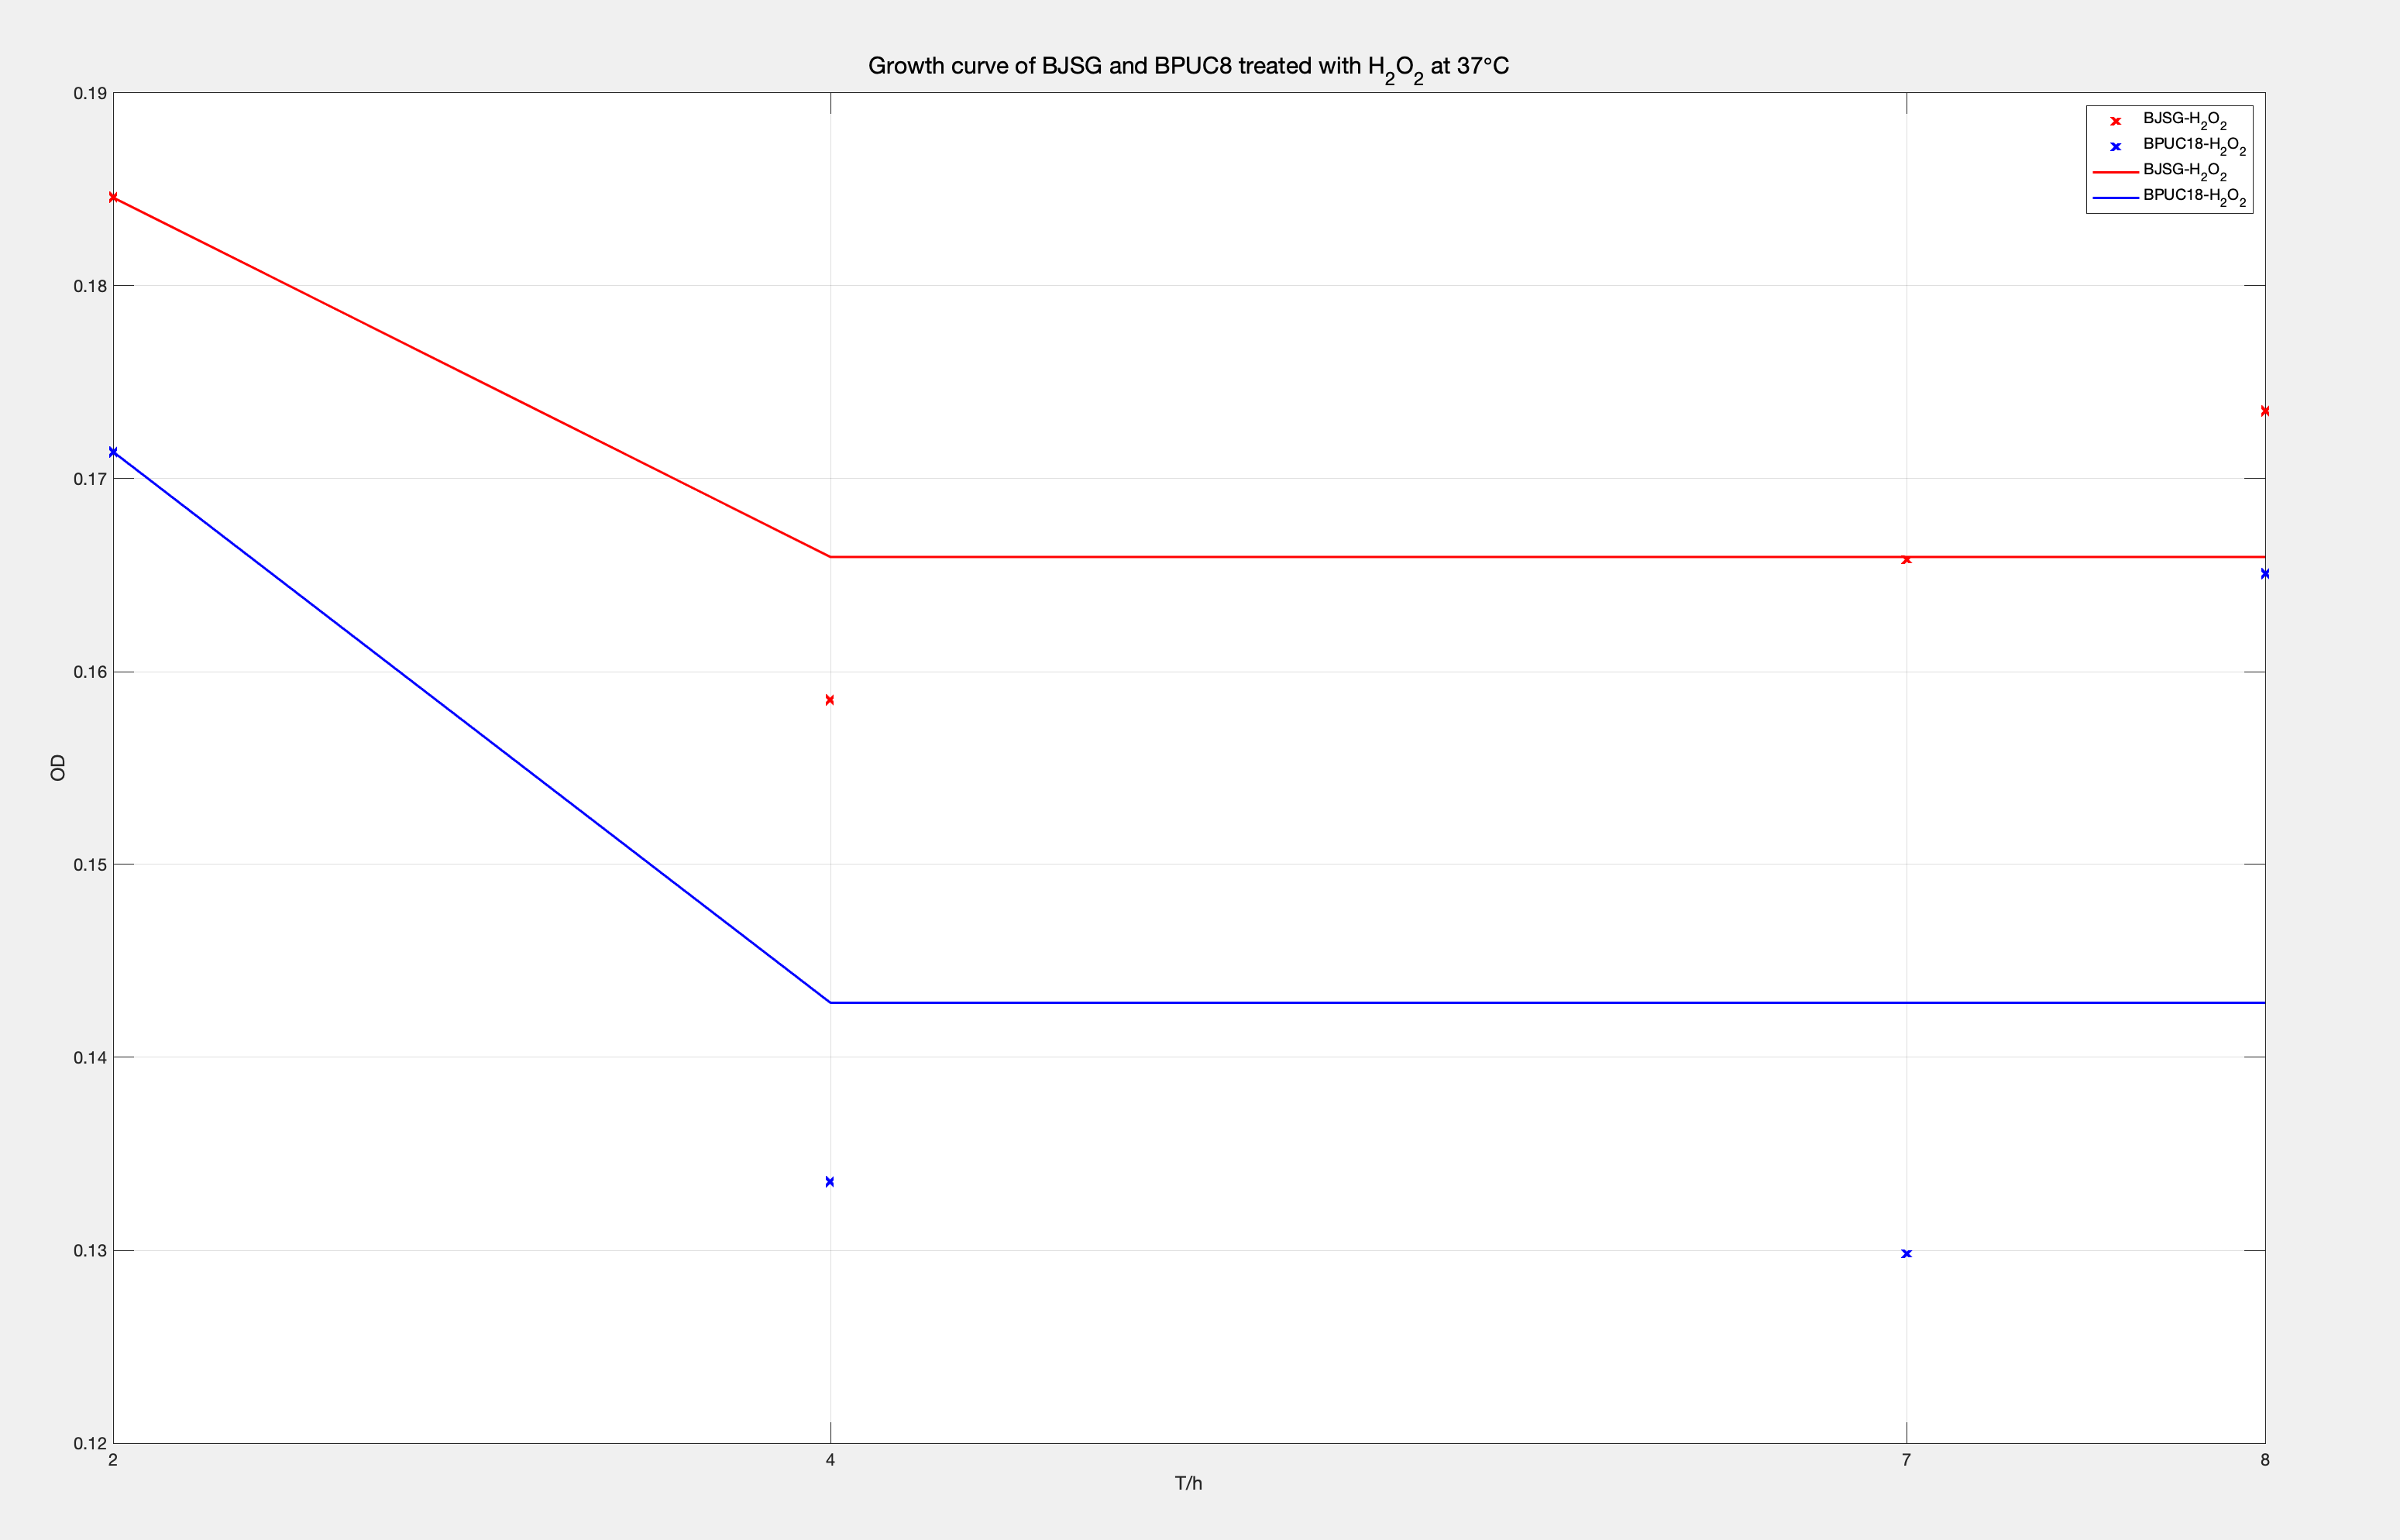
Fig.5 Logistic Model: Growth cruve of BJSG and BPUCB treated with H2O2at 37 C。
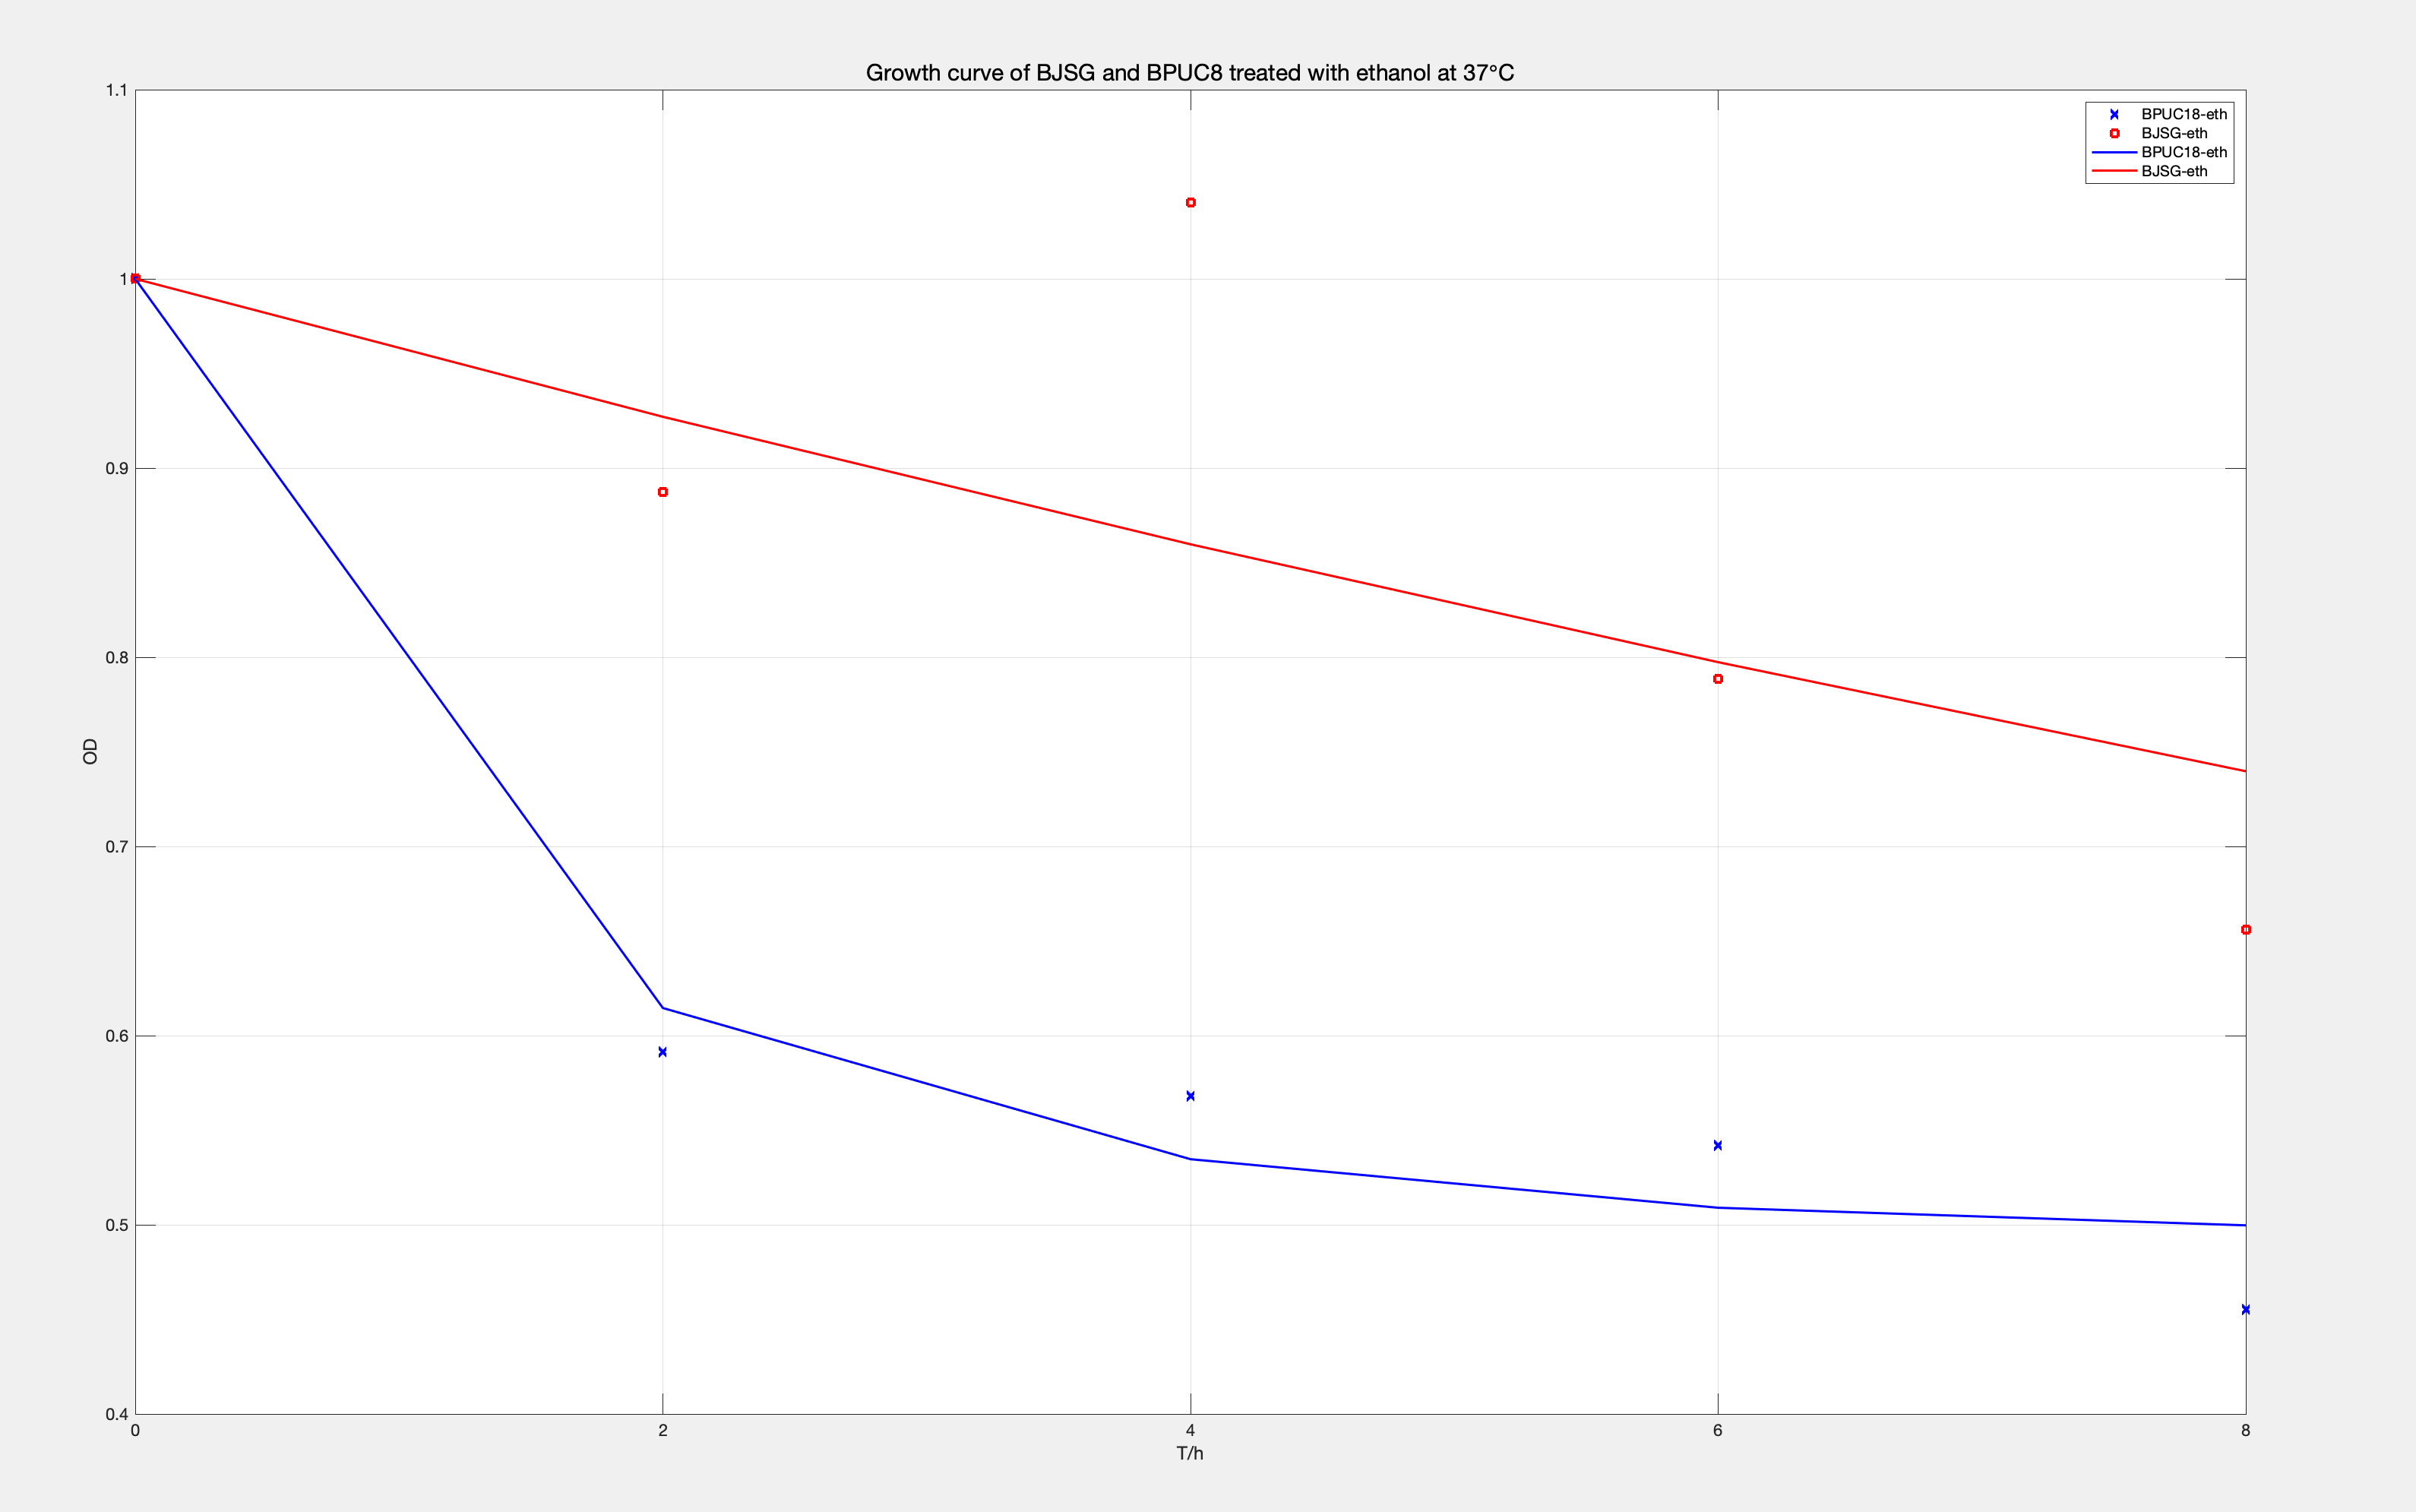
Fig.6 Logistic Model: Growth cruve of BJSG and BPUCB treated with ethanol at 37 C。
Similarly, we can see that the BJSG engineered bacteria carrying the HSP gene have a better growth curve under the conditions of H2O2 and ethanol with better stress resistance than ordinary bacteria.