Team:NTHU Taiwan/Model
Overview

In our project, we try to plant a genetically modified pine tree to stop the spreading of B. xylophilus. Due to Taiwan’s laws, we can’t modify a complete pine tree in the laboratory, therefore we use the callus of Pinus armandii in replacement. To examine whether our genetically modified pine tree can resist nematode or not, we build a model to compute it. The model of B. xylophilus is devised and constructed by us, we take many papers as references to make it close to the real situation.
Hypotheses
To calculate the consumption and population size of nematodes, we came up with some hypotheses:
- Energy source for growing is come from the consumption
- Energy expenditure is neglectable except growing before nematode is mature
- Digestion rate is proportional to the surface area of intestinal tract
- Ingestion rate is much larger than digestion rate, nematodes only ingest after they finish the digestion of the nutrient inside the intestinal tract
- The consumption rate depends on which is smaller between ingestion rate and digestion rate
- After the nematode is mature, it stops growing and the energy from the consumption turn into the reproducing energy
- Before nematode hatching, consumption rate is zero; after nematode mature, consumption rate is a constant
- Relation between the concentration of mRNA and the concentration of RISC has two different kinds: linear and nonlinear
- The ingestion rate is proportional to root of the concentration of mRNA
- At beginning, all nematodes are mature, and the population size is set to 1
- If the population size decrease under 0.01, we claim that all nematodes are dead in this pine tree
- Pine trees would be dead if the total consumption is larger than 40.86
There is a detailed introduction of the design of the model in engineering page. We also explain how we got these hypotheses there.
Linear model
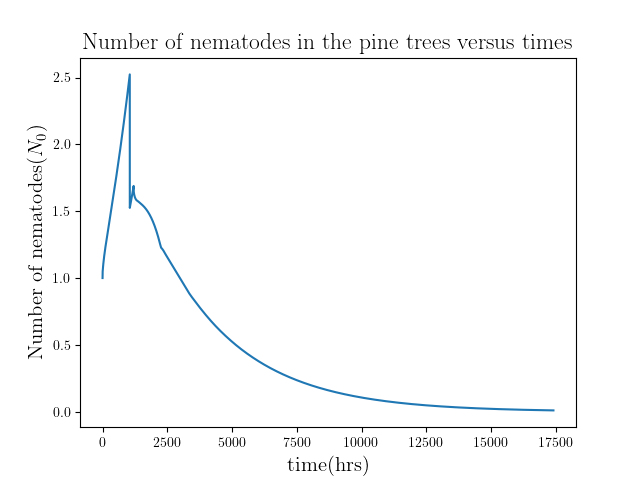
We simulate the linear model of [mRNA] first. We choose initial ingestion rate equals to 1 and change the toxicity
(a)
(b)

(c)

(d)
(e)
(f)
(g)
(h)
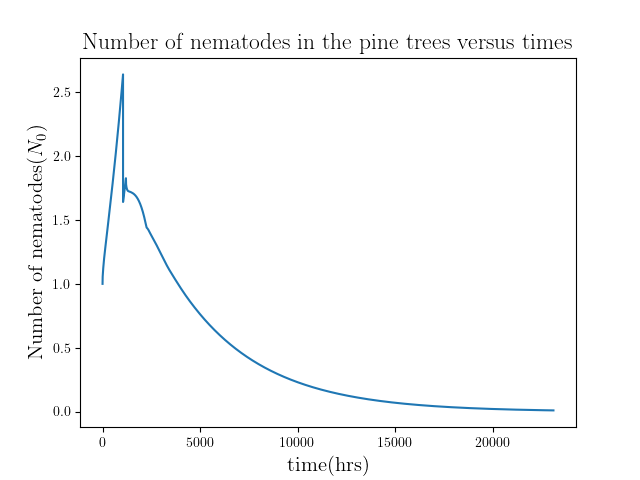
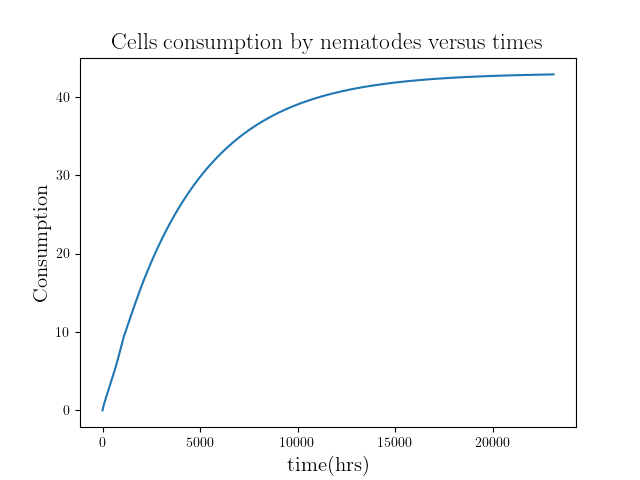
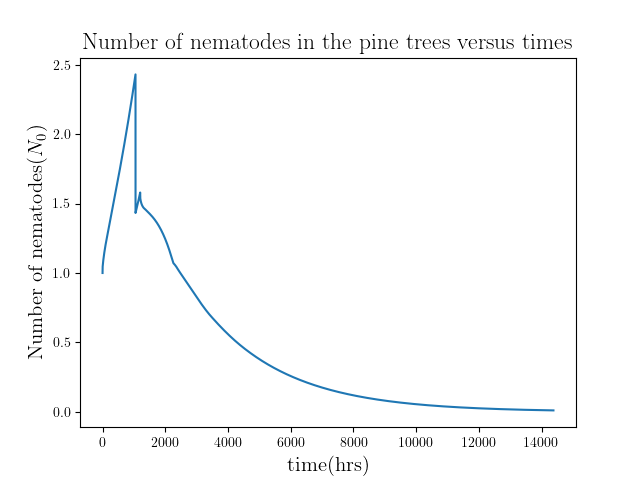
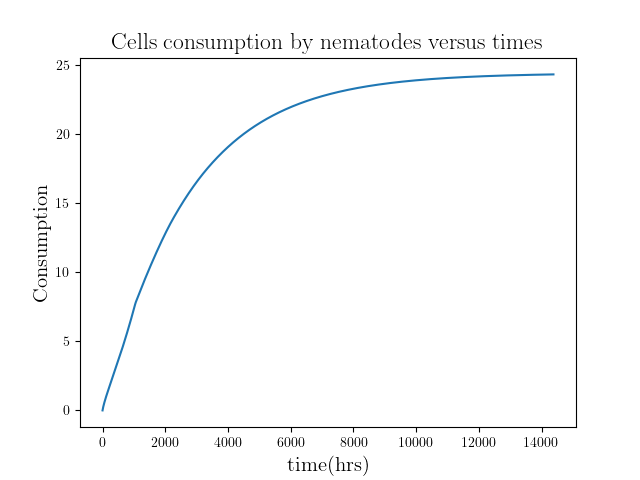
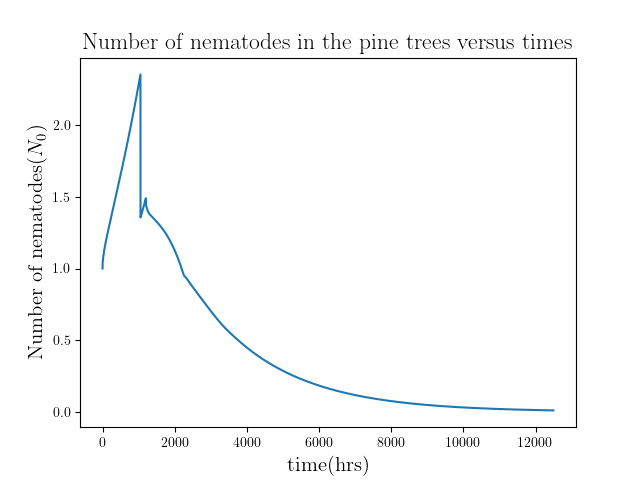
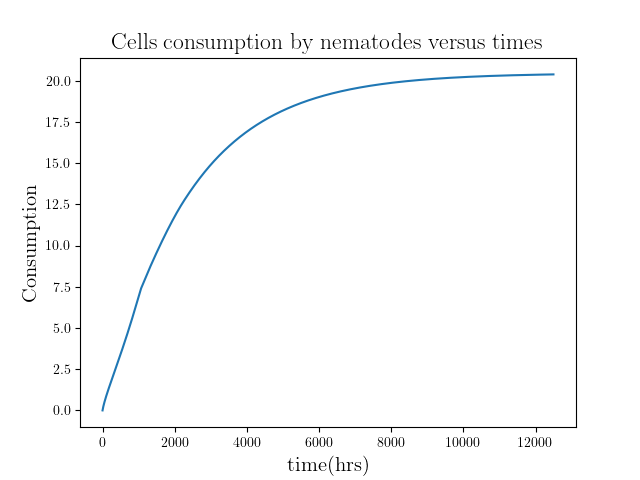
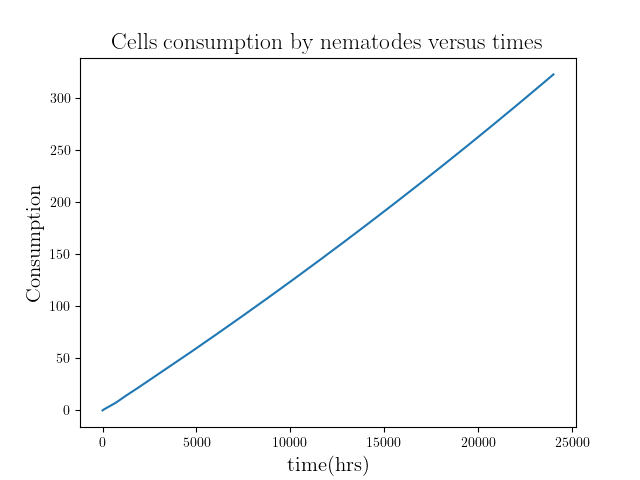
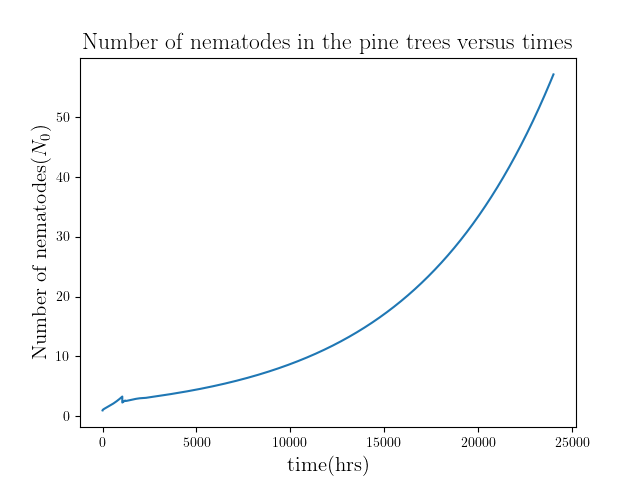
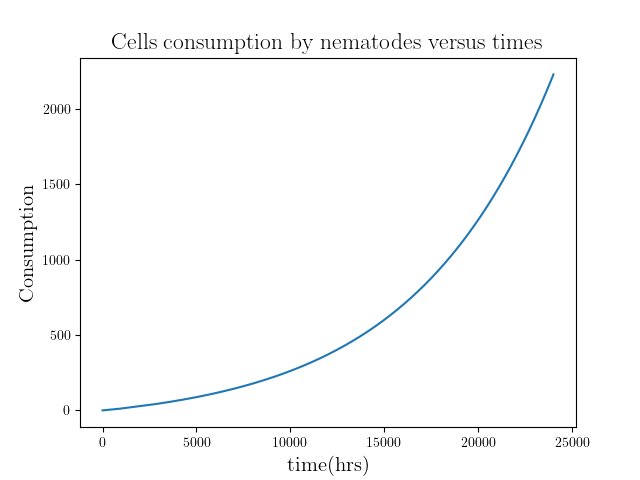
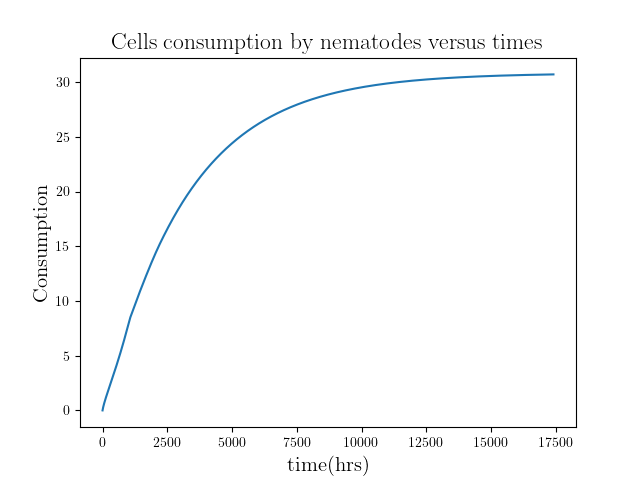
Figure 1: Evolution of population size of nematodes in unmodified pine trees and the accumulation of total consumption for toxicity = 6000(a), (b), 7000(c), (d), 8000(e), (f), 9000(g), (f)
The total consumption is 42.85, 30.71, 24.34, 20.39 respectively. Then we compute more results with different toxicity and plot the total consumption versus toxicity.
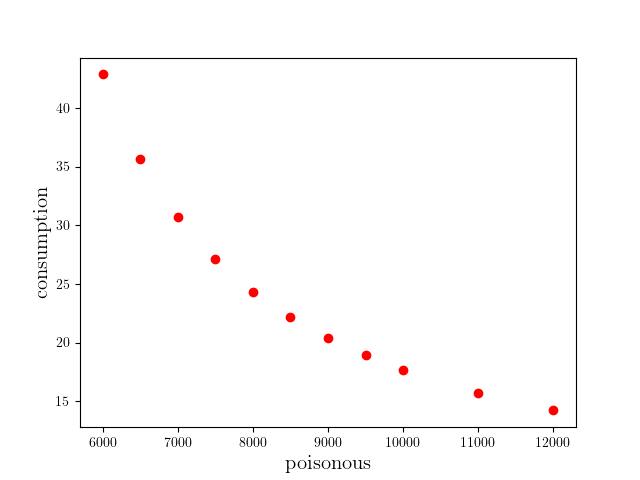
Figure 2: Total consumption versus toxicity
We found that the data seems to have a regulation, so we fitting it with a rational function:
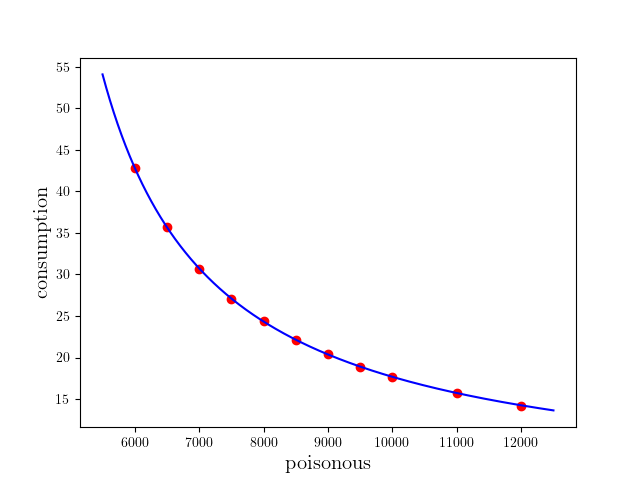
Figure 3: Total consumption versus toxicity, fitting result C(P)=(3.54P+74991.97)/(P-3752.68), R^2=0.999995
By this result, we should find that the consumption is converged if P>3752.68 and it is diverged if P<3752.68. And we should obtain the accumulation of total consumption is an oblique line. We try to compute the results where toxicity is 3752.68 and lower.

(a)
(b)
Figure 4: Evolution of population size of nematodes in unmodified pine trees and the accumulation of total consumption for toxicity = 3752.68
(a)
(b)
Figure 5: Evolution of population size of nematodes in unmodified pine trees and the accumulation of total consumption for toxicity = 3000
As mentioned before, the consumption is diverged when P<3752.68. And the plot for P=3752.68 is close to an oblique line too.
Then we choose the toxicity equals to 7000 and change the initial ingestion rate:

Figure 6: Total consumption versus initial ingestion rate
We fitting it with a same function:
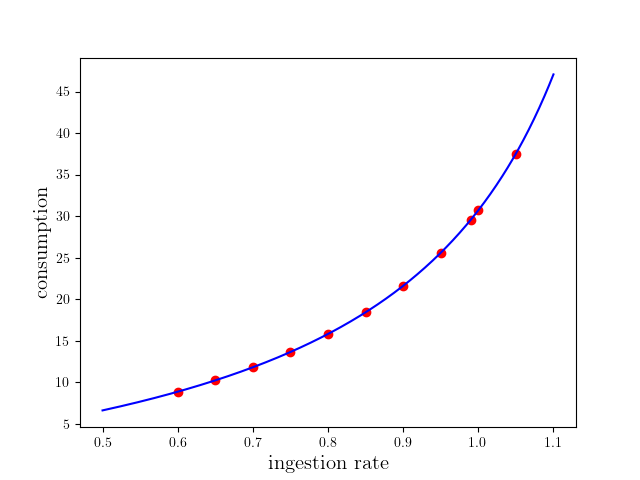
Figure 7: Total consumption versus ingestion rate, fitting result C(I)=(-10.26I-0.51)/(I-1.35) , R^2=1.000000
Then, we plot the points that total consumption equals to the max consumption 40.86, which can be saw as the critical point that the pine tree will die due to nematodes.
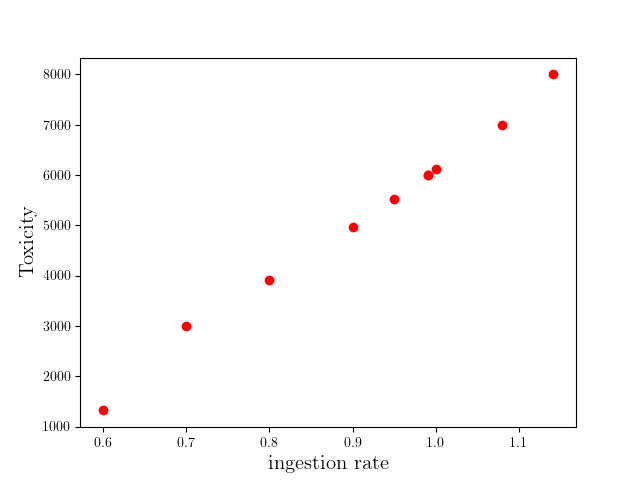
Figure 8: The points that total consumption equals to the max consumption, toxicity versus ingestion rate
If we could measure the ingestion rate of nematodes, we could use this figure to determine how toxicity our modified pine trees needed to immune to nematodes.
Nonlinear model

(a)

(b)
(c)
(d)
(e)
(f)
(g)

(h)
Figure 9: Evolution of population size of nematodes in unmodified pine trees and the accumulation of total consumption for toxicity = 6000(a), (b), 7000(c), (d), 8000(e), (f), 9000(g), (f)
The total consumption is 42.85, 30.71, 24.34, 20.39 respectively. Compares to the result from linear mode, they almost have the same consumption. Because the linear mode is much reasonable, plus they have similar result, we won’t do further discussion of this mode.
Outlook
The biggest problem of our model is that we have two controllable variables in this model. To solve this problem, we design experiments to measure the data of nematodes.
First, we separate nematodes into several identical ethnic groups. We feed different groups with different quantities of modified callus where the quantities are small enough for nematodes can finish them in a short time (roughly 2 hours). We do qPCR to nematodes and get the relative concentration of mRNA. By doing so, we can plot the relation between concentration of mRNA and the consumption. Therefore, we can check which is more coincide to the experiment’s data between linear and highly nonlinear model. And we can get the values of toxicity of the pine trees.
To getting the ingestion rate of nematodes, we design two different experiments.
The first one, we put nematodes on the modified callus for a long time (roughly one day). And do qPCR to check the concentration of mRNA. By repeating it with different length of time, we can have the relation between mRNA and time. Combining this with the relation between concentration of mRNA and the consumption, we can get the relation between consumption and time. Comparing to the theory, we can have the ingestion rate.
The second one, we put nematodes on the modified callus for a very long time (roughly one month). We can success the nematodes to make sure that they can survive on this callus. Then, we measure the biggest size and compared to the theory to figure out the ingestion rate.