Team:NMU China/Model

Overview
In view of the using envision in our Proposed Implementation, we verified the function of Toggle Macrophage. However, in the process of human practice, there are still two problems to be solved urgently.
1. Dr. Du proposed that if we induce macrophages to commit suicide or add drugs to accurately induce their apoptosis, we need to constantly detect the condition and timely inject monocytes, which will make the treatment complicated and greatly increase the cost.
2. Dr. Dong proposed that the primary concern for clinicians when using a drug is its dose. Cell therapy focuses on the number of engineered cells, so we should first tell the clinician the appropriate amount of macrophage.
1. How do CARγ macrophages, CARMERTK macrophages and virus affect IL-6 concentration respectively? (Effects of Toggle Macrophage and virus on IL-6)
2. Can macrophages be added only once to oscillate il-6 concentration within a certain range? (Results analysis)
3. When only the serum il-6 concentration of the patient is known, can we tell the clinically acceptable dose [A,B] (number of engineered cells)? (Application example)
Notation
| Notation | Meaning | Unit |
|---|---|---|
| u | High value of IL-6 concentration oscillation | ng/ml |
| l | Low value of IL-6 concentration oscillation | ng/ml |
| m | Stable value of IL-6 | ng/ml |
| n | Number of macrophages | 1e7 |
| I | IL-6 concentration in tissue fluid | ng/ml |
| p | IL-6 concentration in blood samples | ng/ml |
| t | Blood test time | min |
| T | Half-life of IL-6 | min |
| cv | Viral load | copies/ml |
| cr | Fluorescent protein intensity of CARγ | |
| ct | Fluorescent protein intensity of CARMERTK | |
| Dt | Change in IL-6 concentration caused by MERTK per unit of intensity | ng/ml |
| Dr | Change in IL-6 concentration caused by CARγ per unit of intensity | ng/ml |
| Dv | Change in IL-6 concentration caused by virus | ng/ml |
The relationship between IL-6 concentration and CARγ and CARMERTK expression intensity
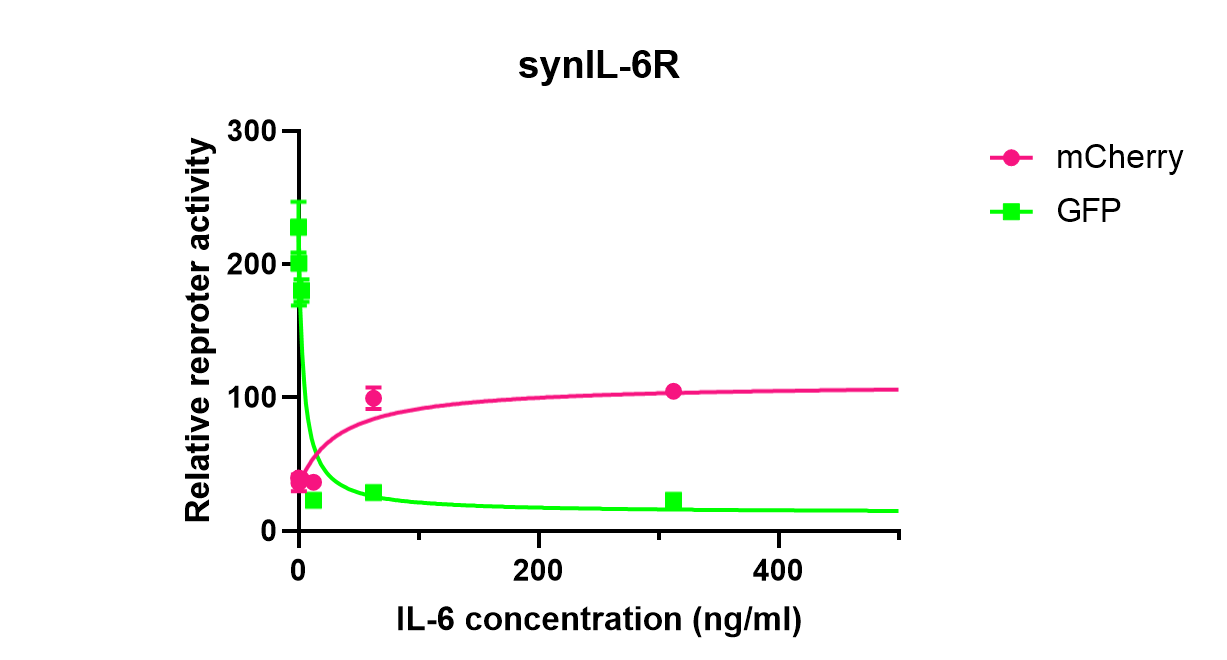
As stated in Proof of Concept, when only IL-6 exists in the environment, we obtained the fluorescence intensity of GFP (representing the expression intensity of CARγ) and mCherry (representing the expression intensity of CARMERTK) at different initial IL-6 concentrations (0.10, 0.50, 2.50,12.50,62.50,213.50,1562.50 ng/ mL) by in vitro experiments, and the curve fitting was performed. (more details in Proof of Concept )
| IL-6 | mCherry | GFP | ||||
|---|---|---|---|---|---|---|
| 0.10 | 37.73 | 38.93 | 41.90 | 206.01 | 242.30 | 234.82 |
| 0.50 | 36.48 | 29.16 | 41.86 | 218.14 | 219.80 | 163.64 |
| 2.50 | 41.33 | 37.54 | 38.07 | 184.15 | 186.24 | 170.26 |
| 12.50 | 34.27 | 34.80 | 40.08 | 25.02 | 21.80 | 21.85 |
| 62.50 | 93.86 | 108.58 | 95.67 | 27.21 | 30.54 | 27.86 |
| 312.50 | 104.68 | 104.24 | 105.32 | 21.65 | 24.74 | 21.99 |
| 1562.50 | 104.67 | 104.41 | 98.22 | 24.71 | 24.56 | 22.55 |
(The fluorescence intensity of GFP and mCherry at different initial IL-6 concentrations)
(Curve fitting)
According to the experimental data, segmented cubic Hermite interpolation was used, and then the CFtool toolbox of MATLAB was used for fitting. The fitting results are as follows:
Expressions of initial IL-6 concentration and CARγ expression intensity after Elmet interpolation were used:

(Fitting image of initial IL-6 concentration and CARMERTK expression intensity after Elmet interpolation were used)
Expressions of initial IL-6 concentration and CARMERTK expression intensity after Elmet interpolation were used:


(Fitting image of initial IL-6 concentration and CARMERTK expression intensity after Elmet interpolation were used)
IL-6 concentration in tissue fluid
As Toggle Macrophage mainly acts in infected tissue, its function is mainly regulated by IL-6 in the tissue. In clinical practice, IL-6 concentration is usually measured in serum, so the relationship between serum IL-6 concentration and tissue fluid IL-6 concentration needs to be established. Studies have shown that the concentration of IL-6 in tissue fluid is about 100 times that in plasma (Henning et al., 2002). As the blood test time cannot be ignored, IL-6 attenuation should also be considered. IL-6 half-life T=10min (Georg Endler, et al., 2004). We assumed that the blood sampling time is about 1h, and the IL-6 concentration in serum can be measured clinically and the IL-6 concentration in tissue fluid can be inferred as follows:

According to formula (1), the serum levels of IL-6 corresponding to clinical stages Asymptomatic and MILD 6.3 pg /mL (1.1 -- 24.4), Moderate 7.5pg /mL (2.2-17.8) and Severe and critical 94.4pg /mL (31.9 -- 565.6)) obtained in (Ji-Soo Kwon, et al., 2020) were converted to tissue concentration, and the results were as follows:
1. Asymptomatic and mild:40.32ng/ml
2. Moderate:48ng/ml
3. Severe and critical:604.16ng/ml
Effects of Toggle Macrophage and virus on IL-6
When infectious components induce a rapid immune response via WT and TKO microglias, mRNA expression encoding the pro-inflammatory cytokine IL-6 peaks within 4-8 h. For the same stimulus, from the initial expression to the peak expression, the ratio of IL-6 mRNA to MERTK knockout microglia was more stable than that of normal microglia, with the mean value of 0.63193. That is, IL-6 mRNA in normal microglia was 0.63193 times that in MERTK knockout microglia. (Ji, et al.,2003)
Since microglia are immune response cells residing in the brain, their developmental origin is similar to that of peripheral macrophages. (Ji, et al.,2003) We assumed that there is no significant difference in the effect of MERTK macrophage on microglia and peripheral macrophages, then CARMERTK macrophage could reduce IL-6 by 0.3681 times.
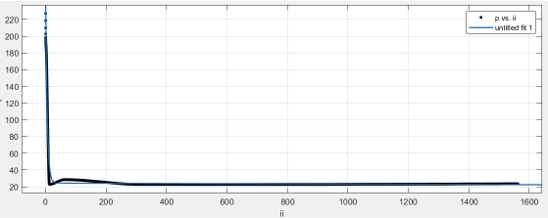
In another article (Wei et al.,2003), the influence of CARγ on IL-6 changed significantly over time, and MATLAB was used to fit its equation over time:

IL-6 are significantly altered by viral load exceeding 50,000 copies/ml. However the increase in viral copy number (>500,000/ml) did not alter the expression proportionately, suggesting a threshold effect. (Karolina Duskova , et al. ,2013) Based on the data in this paper, we can fit the expression of the influence of the virus on IL-6 with different viral load (3). Since there is no definite relationship between the virus and IL-6concentration, viral load V is set as a randomly generated disturbance term.
IL-6 varies with CARMERTK macrophage、CARγ macrophage and virus
According to the known conditions, we can find the expression of CARMERTK macrophage, CARγ macrophage and virus when the initial il-6 concentration is i0:

Due to the time required for phenotypic transformation of macrophages, it is necessary to use cyclic algorithm to calculate and observe IL-6 concentration: CARγ expression intensity cr0 and CARMERTK expression intensity ct0 at t0 are substituted into Formula (6) to obtain the value i1 of IL-6 concentration at t1. And then i1 is substituted into Formula (1) and (2) respectively to obtain the expression intensity cr1 and ct1 of CARγ and CARMERTK at t1. Cr1 and ct1 are substituted into Formula (6) to obtain the value i2 of IL-6 concentration at t2. And then i2 is substituted into Formula (1) and (2) respectively to obtain the expression intensity of CARγ and CARMERTK, cr2 and ct2 at t2. And so on. As shown in the flow chart.

We quantified the possible number of these macrophages into a series of discrete values with intervals of 0.0001. MATLAB was used to figure out how many macrophages n are needed to make IL-6 concentration oscillate between [L, U] for a given initial value of IL-6 concentration i0.
The influence of various factors on IL-6 concentration was examined
The influence coefficients of CARγ on IL-6, Dr =0.3, 0.8, 1.2, respectively, and the changes of IL-6 concentration.

Fig. 1
When the initial IL-6 concentration was 50ng/ml and Dr =0.05, n=0.0001, 0.0005, 0.0010, 0.0015, 0.0020, 0.0400 were used to draw the image of IL-6 concentration changing over time, as shown in Figure 1. It can be seen that the image curves all tend to be near 2.723ng/ml, and within this range, the greater the n, the shorter the time to reach the stable value for the first time.
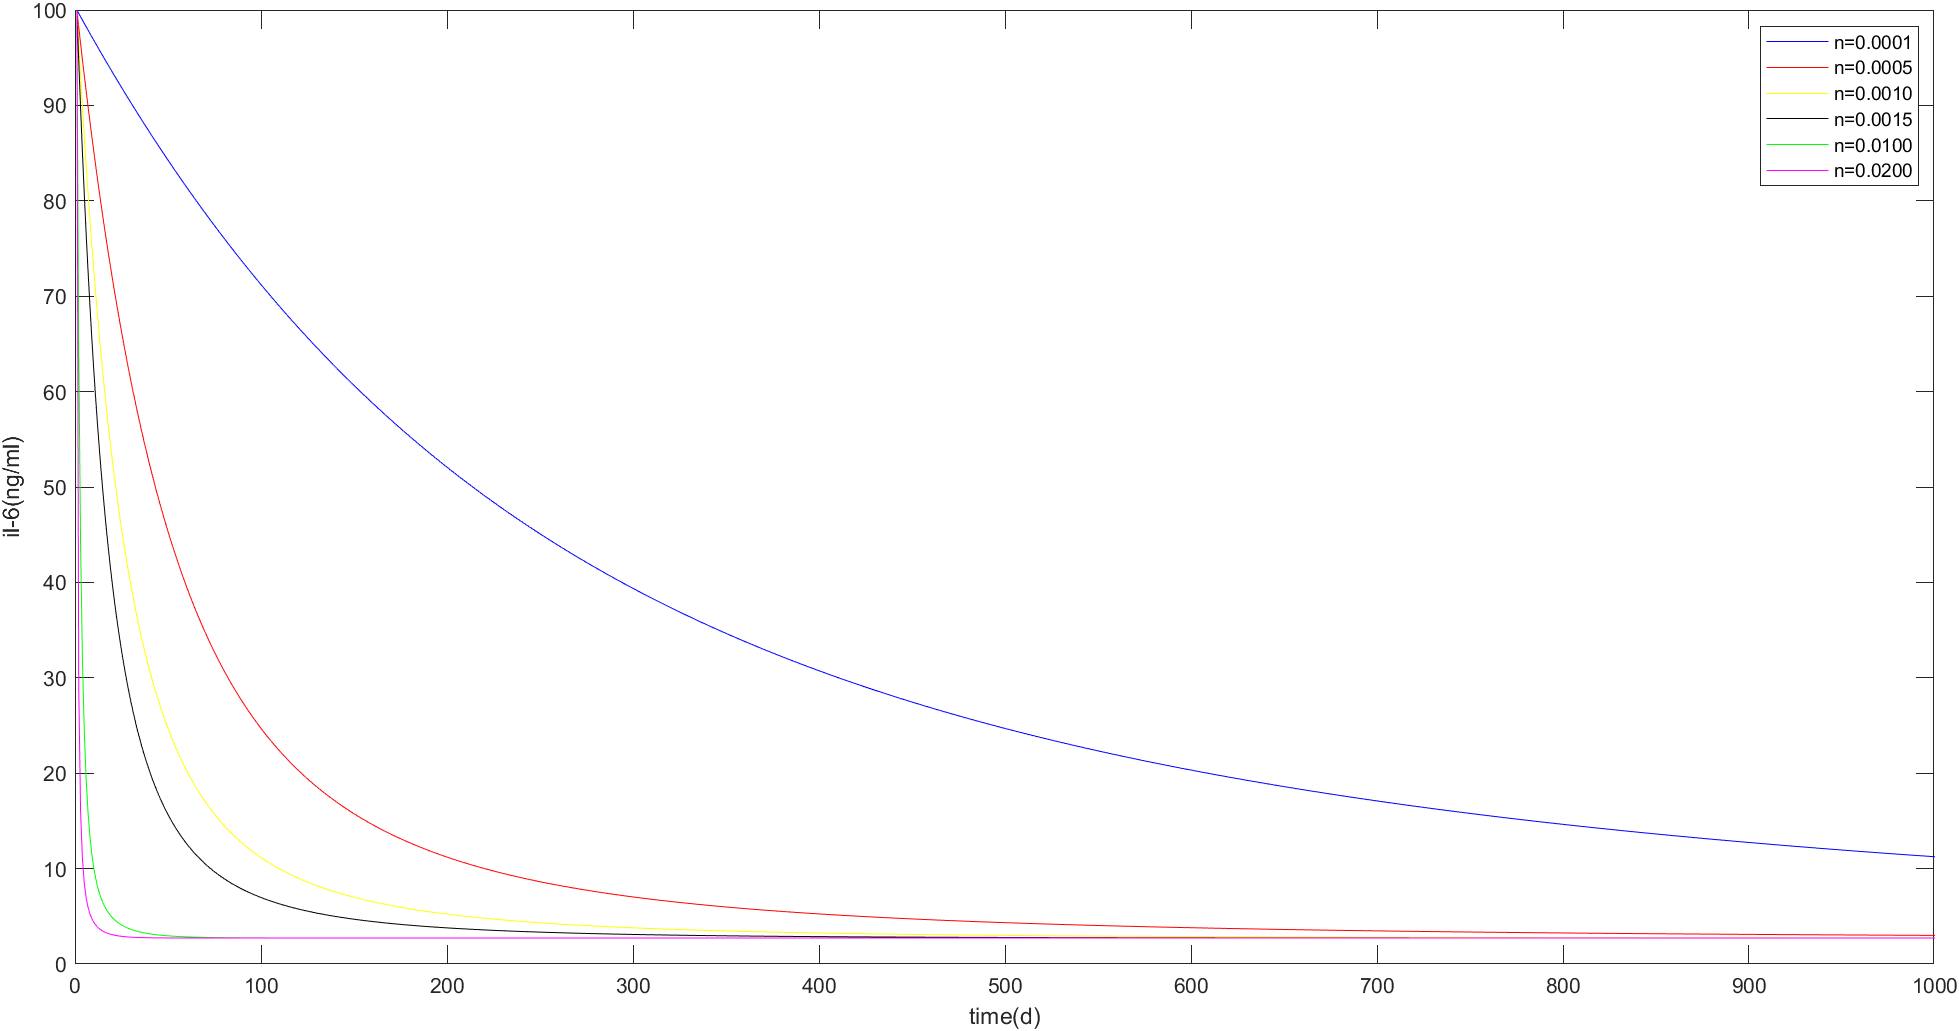
Fig. 2
When the initial IL-6 concentration was 100 ng/ml and Dr =0.05, n=0.0001, 0.0005, 0.0010, 0.0015, 0.0100, 0.0200 were used to draw the image of IL-6 concentration changing over time, as shown in Figure 2.
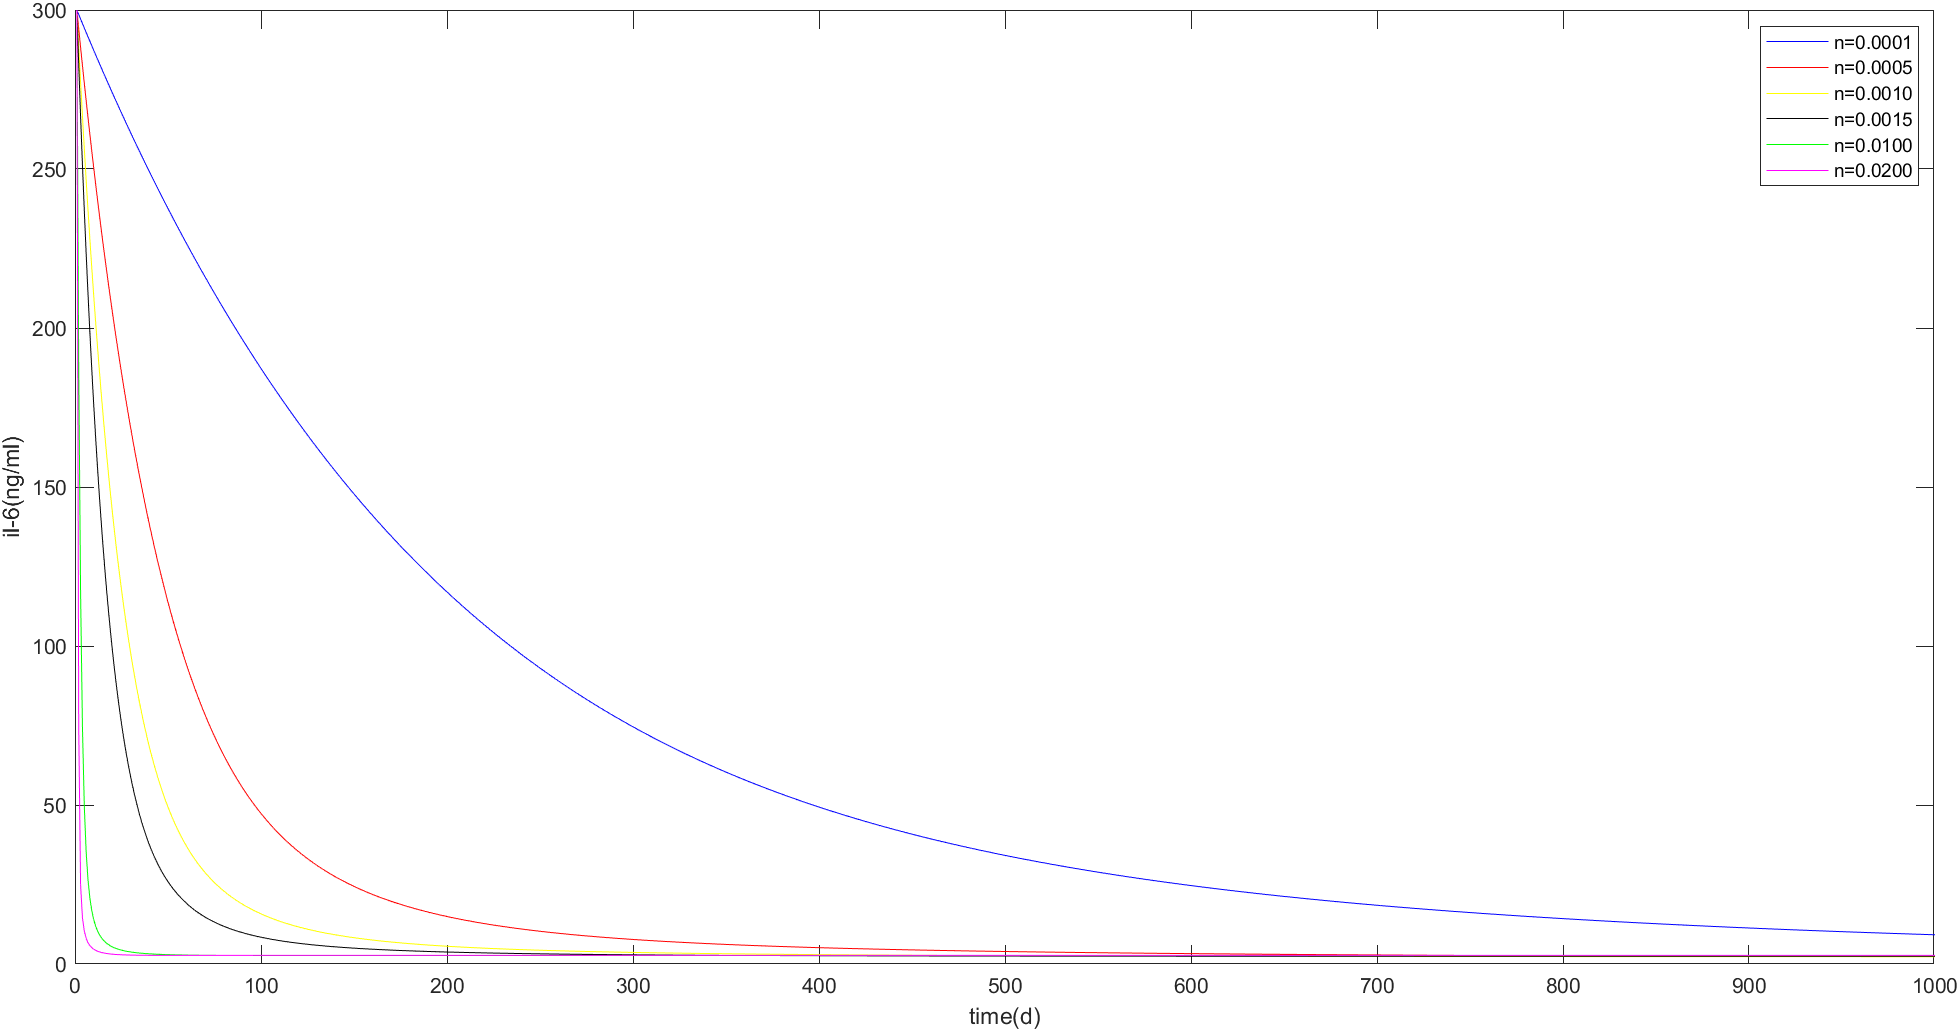
Fig. 3
When the initial IL-6 concentration is 300 ng/ml and Dr =0.05, n=0.0001, 0.0005, 0.0010, 0.0015, 0.0100, 0.0200 are taken to draw the image of il-6 concentration changing over time, as shown in Figure 3.
Therefore, it can be preliminarily concluded that when the influence coefficient of CARγ on IL-6 Dr is 0.05, no matter what the initial concentration of IL-6 is, it eventually tends to a stable value of 2.723ng/mL. Then we changed the Dr value to see if the other Dr values had the same effect.
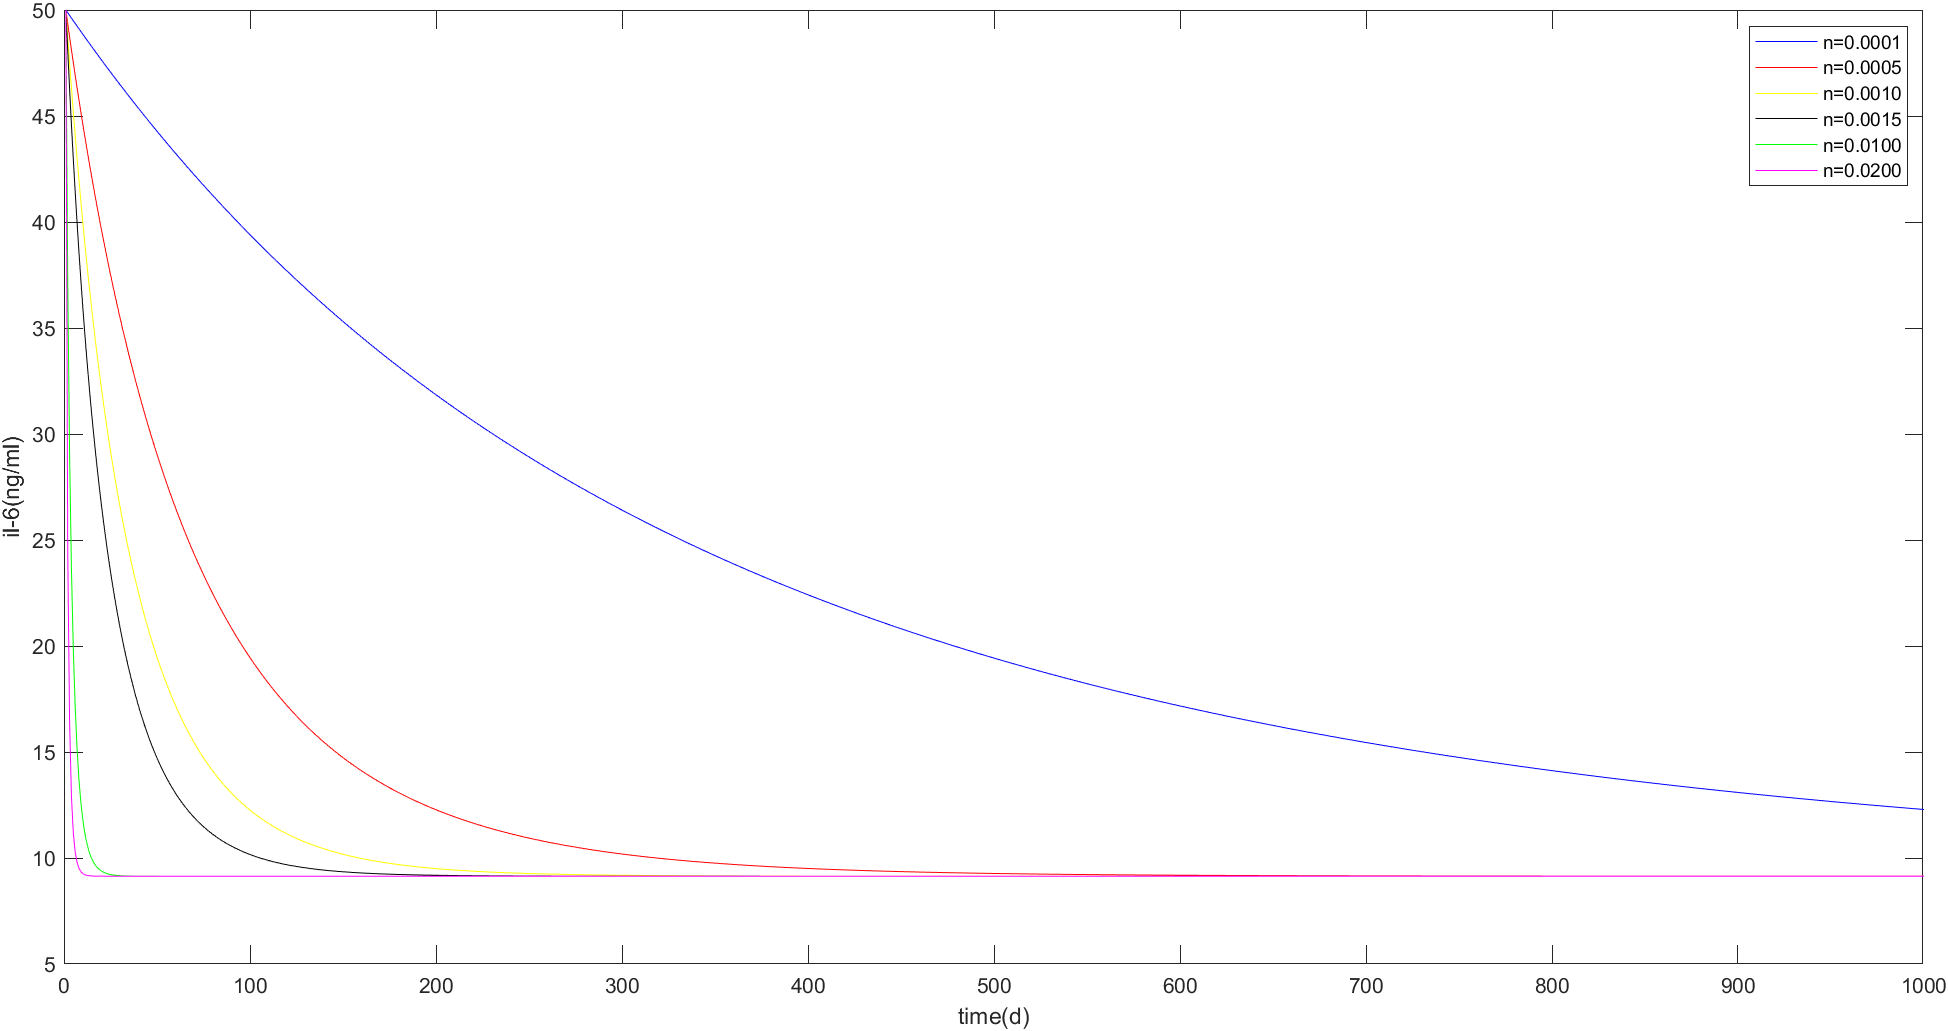
Fig. 4
When the initial IL-6 concentration was 50 ng/ml and Dr =0.2, n=0.0001, 0.0005, 0.0010, 0.0015, 0.0100, 0.0200 are taken to draw the image of IL-6 concentration changing over time, as shown in Figure 4. It can be seen that the image curves all tend to 9.1418ng/ mL, and the larger n is in this range, the shorter the time for IL-6 concentration to reach the stable value for the first time.
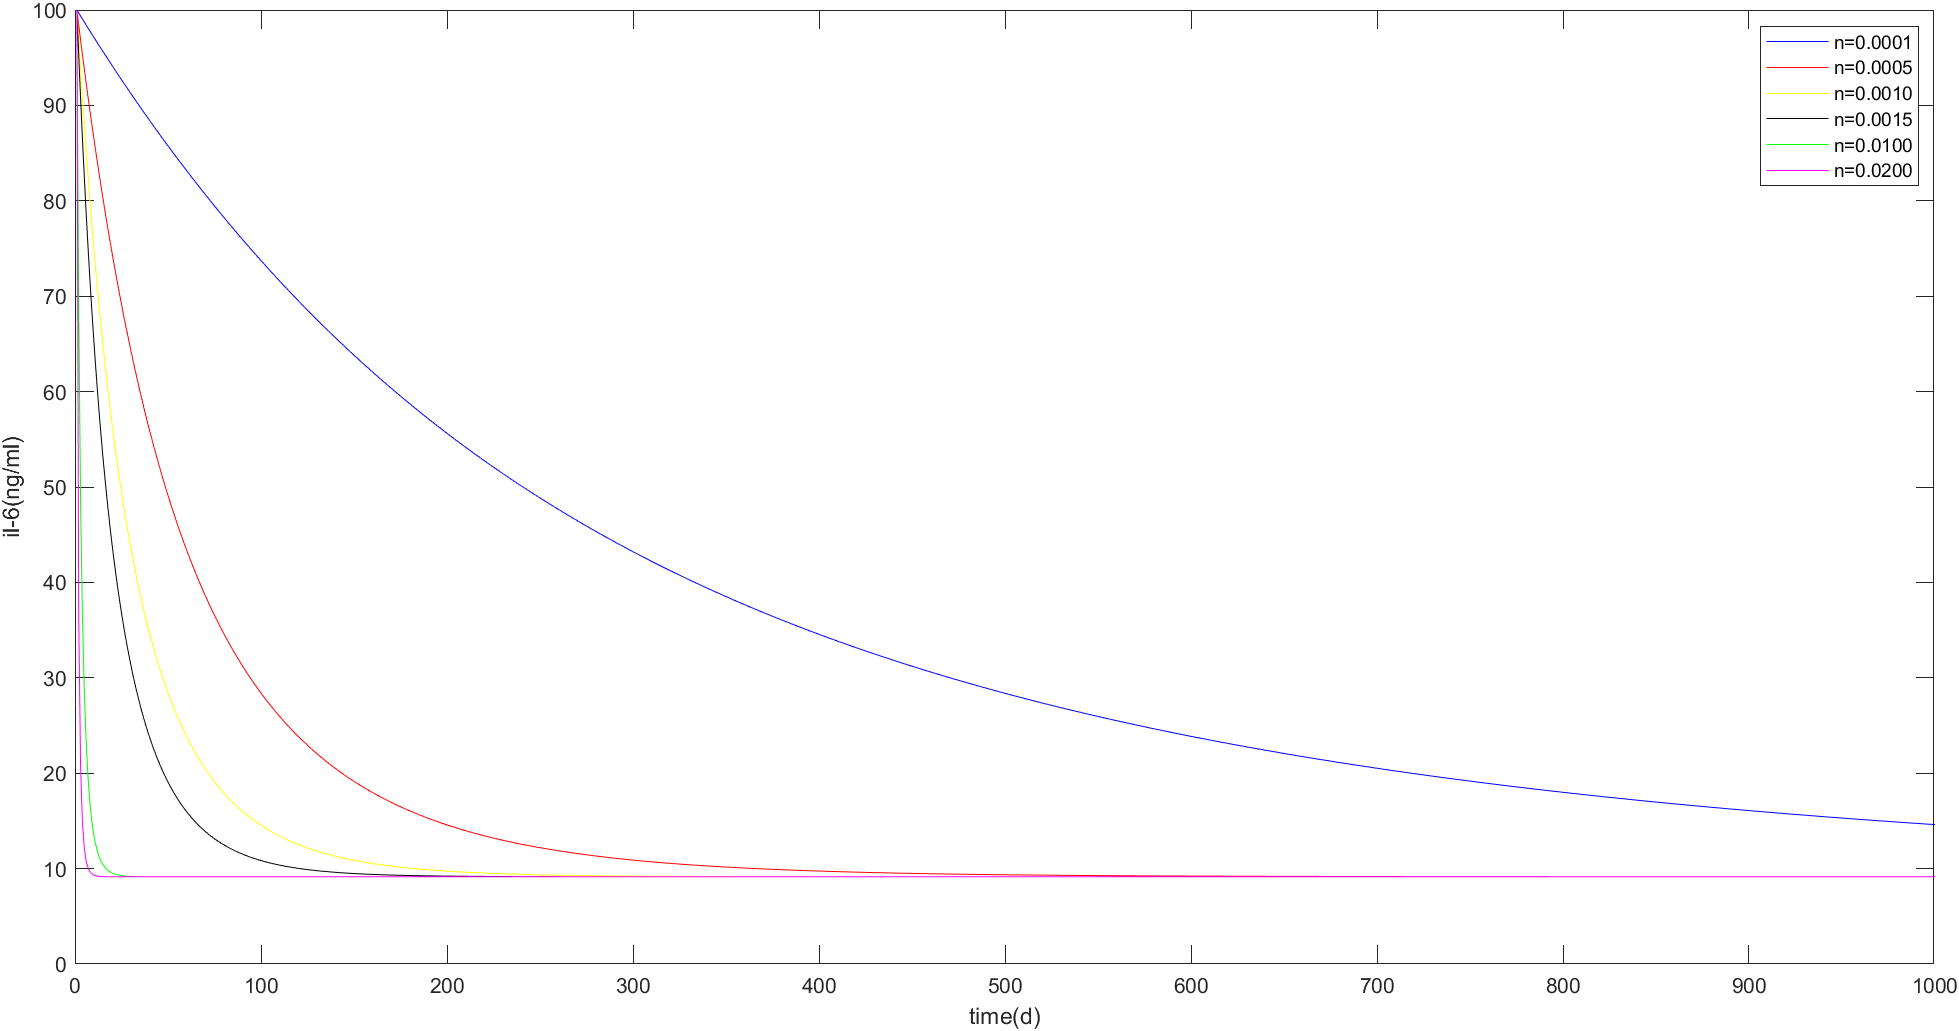
Fig. 5
When the initial IL-6 concentration was 100 ng/ml and Dr =0.2, n=0.0001, 0.0005, 0.0010, 0.0020, 0.0100 are taken to draw the image of IL-6 concentration changing over time, as shown in Figure 5.

Fig. 6
When the initial IL-6 concentration was 300 ng/ml and Dr =0.2, n=0.0001, 0.0005, 0.0010, 0.0100, 0. 020 are taken to draw the image of IL-6 concentration changing over time, as shown in Figure 6.
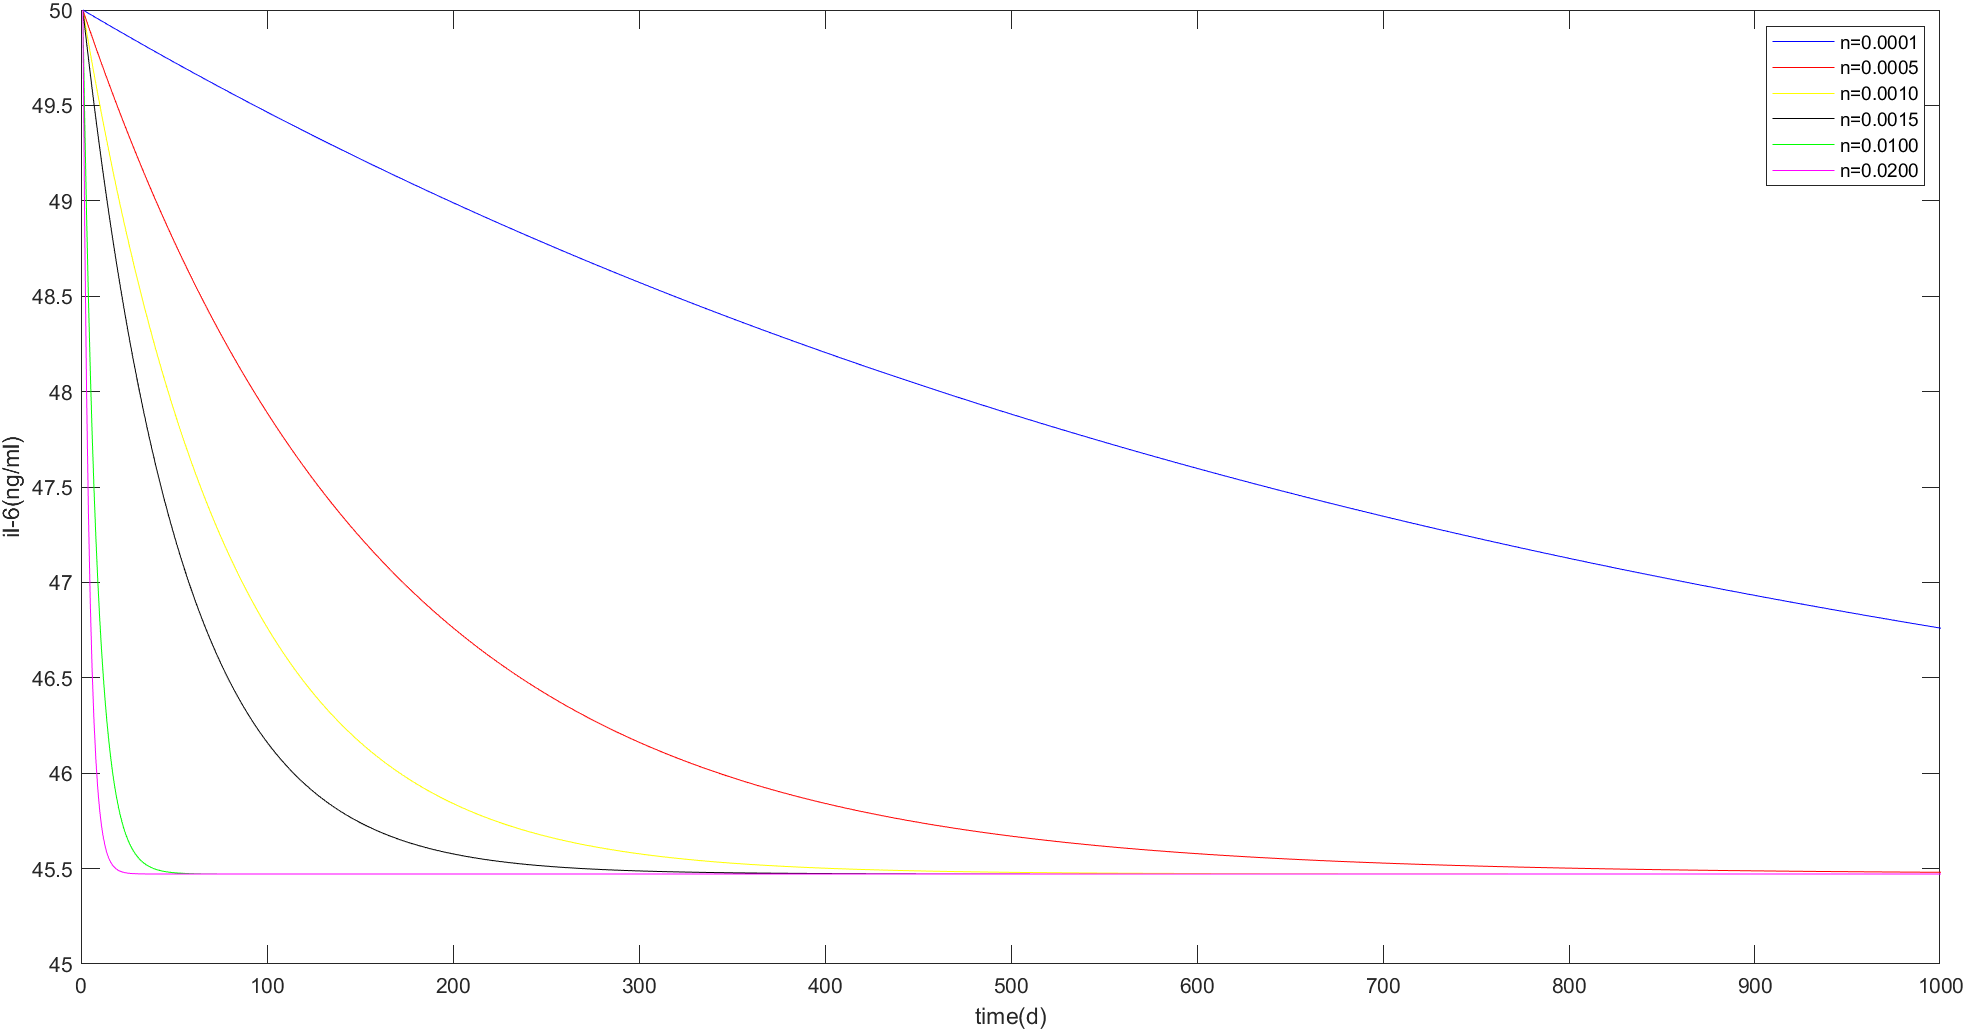
Fig. 7
When Dr =0.8, take n=0.0001, 0.0005, 0.0010, 0.0020, 0.0100, 0.0400 to draw the image of IL-6 concentration changing over time, as shown in Fig. 7. It can be seen that the larger n is in this range, the larger the stable value of IL-6 concentration is, and the shorter the time to reach the stable value for the first time.

Fig. 8
Based on the above images and MATLAB calculation results, we can draw a preliminary conclusion: When the influence coefficient of CARγ on IL-6 Dr is constant, there is a certain range of macrophage number N, which makes il-6 concentration tend to a stable value. The larger the Dr Value is, the larger the stable value is, and the feasible N value varies with the initial IL-6 concentration and Dr Value.
Formula (2) was substituted into Formula (4). When the initial IL-6 concentration was 25ng/ mL and n <0.0503, IL-6 concentration tended to a stable value, and the image of IL-6 concentration changing over time within this range was made, as shown in Figure 9:
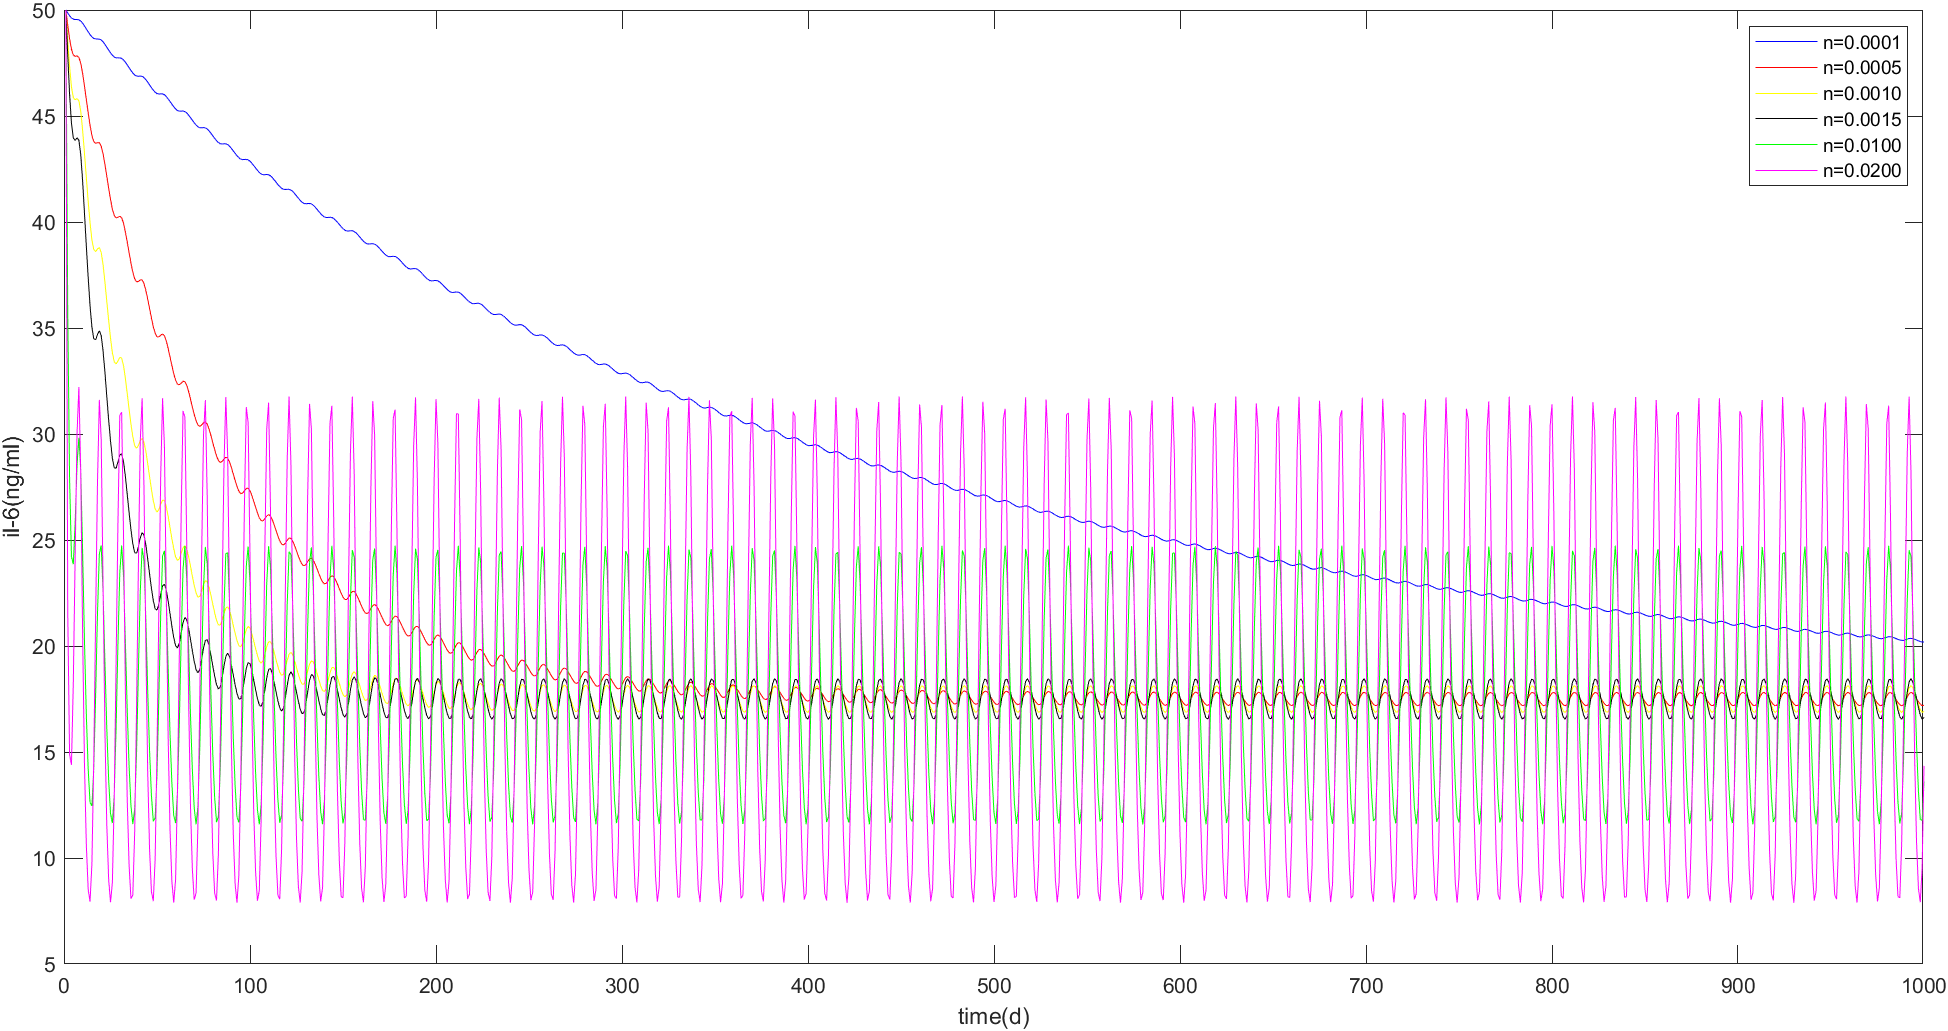
Fig. 9
As can be seen from the MATLAB calculation results and images, when n <0.0503, the concentration of IL-6 in each group finally oscillated up and down around 17.5ng/mL. In this range, the larger n is, the greater the oscillation amplitude is. When n=0.0001, IL-6 concentration oscillates up and down near the stable value with the smallest amplitude in the figure. However, this group also takes the longest time to reach the stable value for the first time: about 1000h. In order to obtain the optimal n value, it is necessary to balance the time when the initial value reaches the stable value and the amplitude of up and down oscillation. Finally, the optimal number of macrophages n=0.0067 is obtained when the initial IL-6 concentration is 50ng/ mL.
Viral load of SARS-COV-2 can be 1k copies/ml when the inflammation is severe.(Andreas et.al,. 2021 )Therefore, we used MATLAB to randomly generate viral load of 0~1000 copies/ml every 5 days.
Set a series of initial IL-6 concentrations: 50ng/ml, 75ng/ml, 100ng/ml, 200ng/ml,400ng/ml, and observe the results.
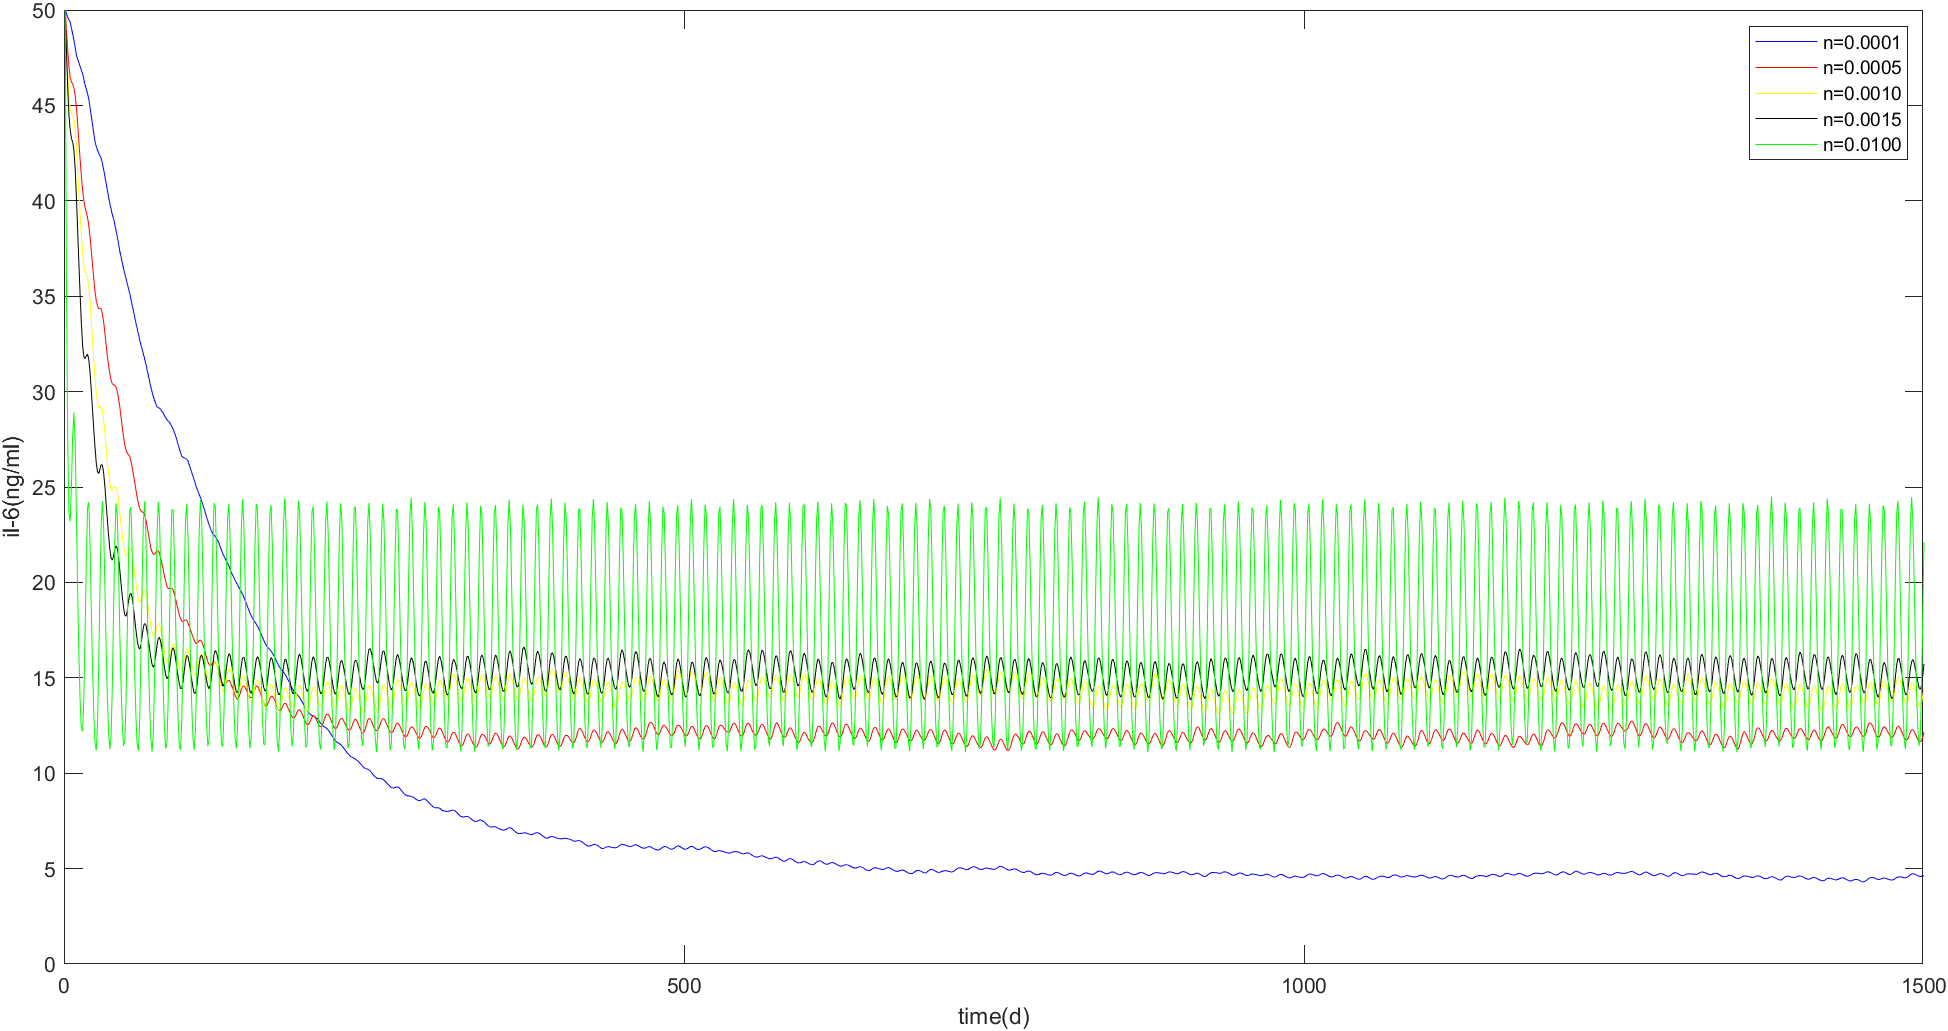
Fig. 10
When the initial IL-6 concentration is 50ng/ml, as shown in Figure 10:
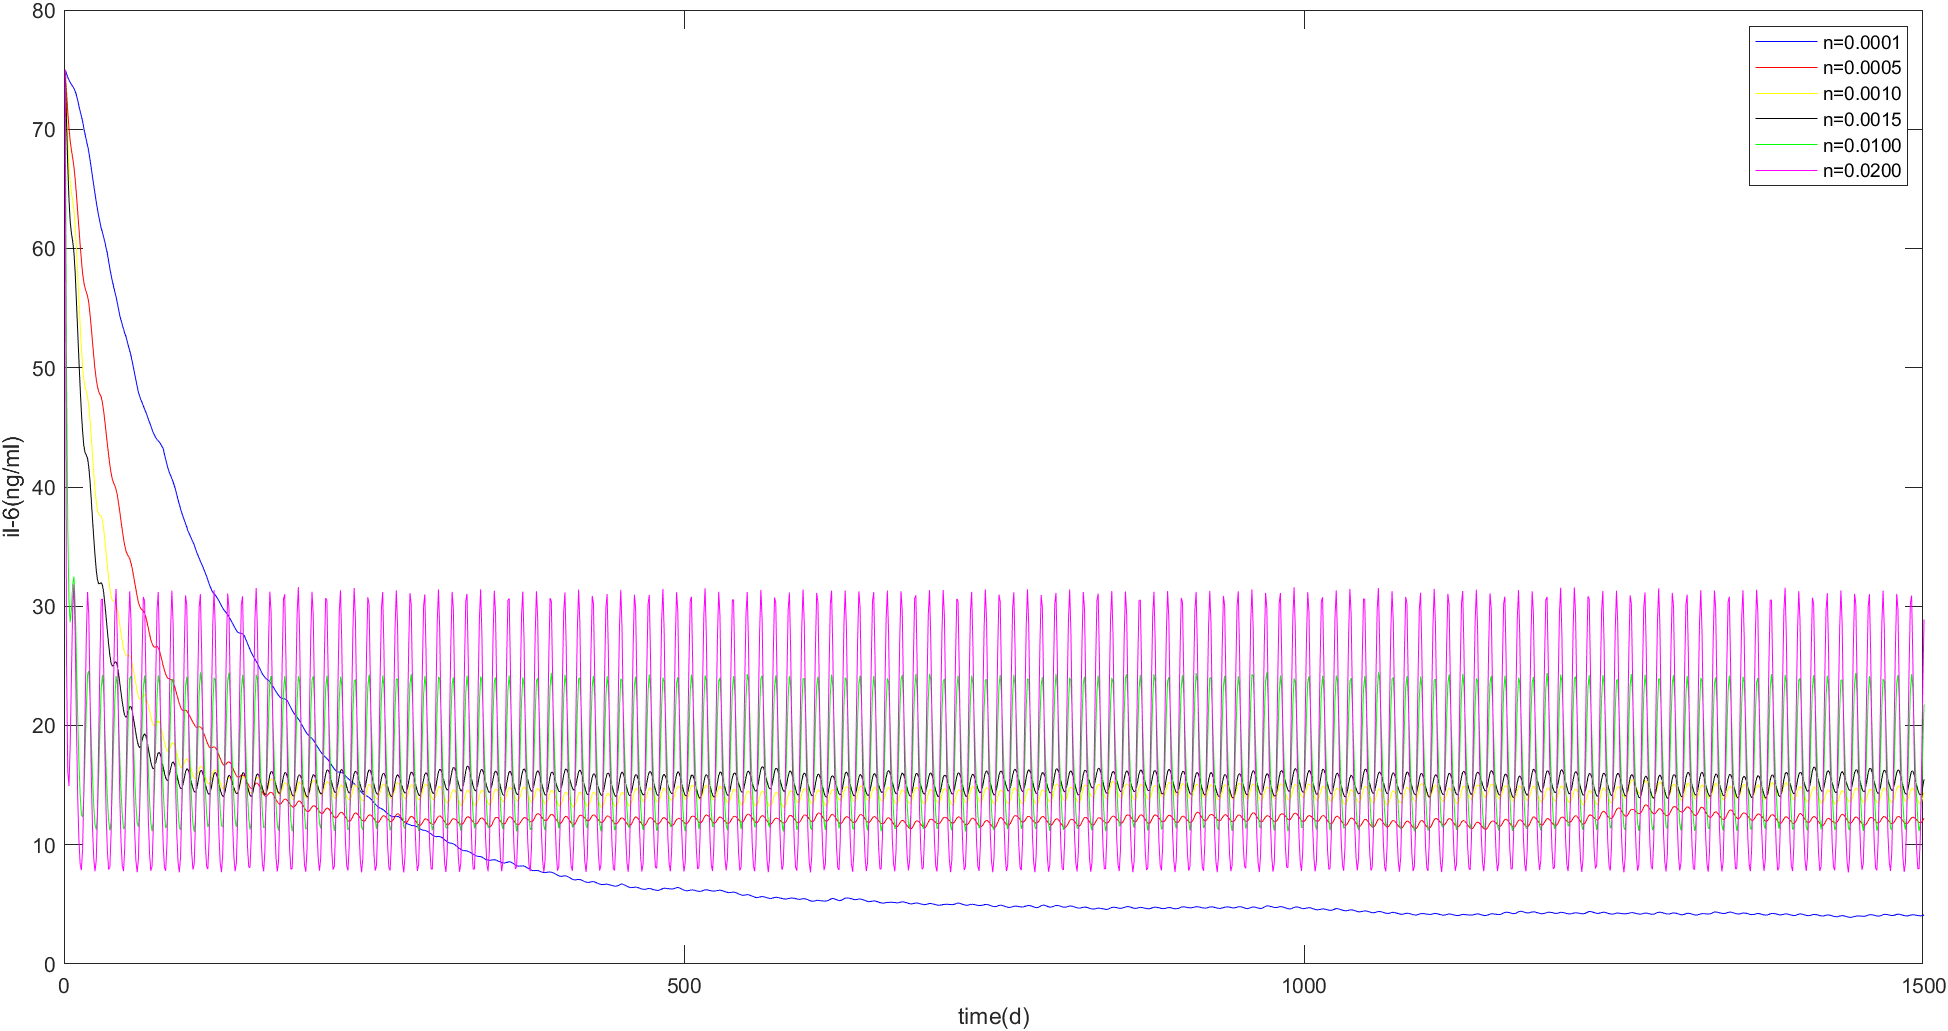
Fig. 11
When the initial IL-6 concentration is 75ng/ml, as shown in Figure 11, the changes of the stable values of each curve corresponding to different n values are consistent with Figure 10, and the stable values of the same N value do not change.
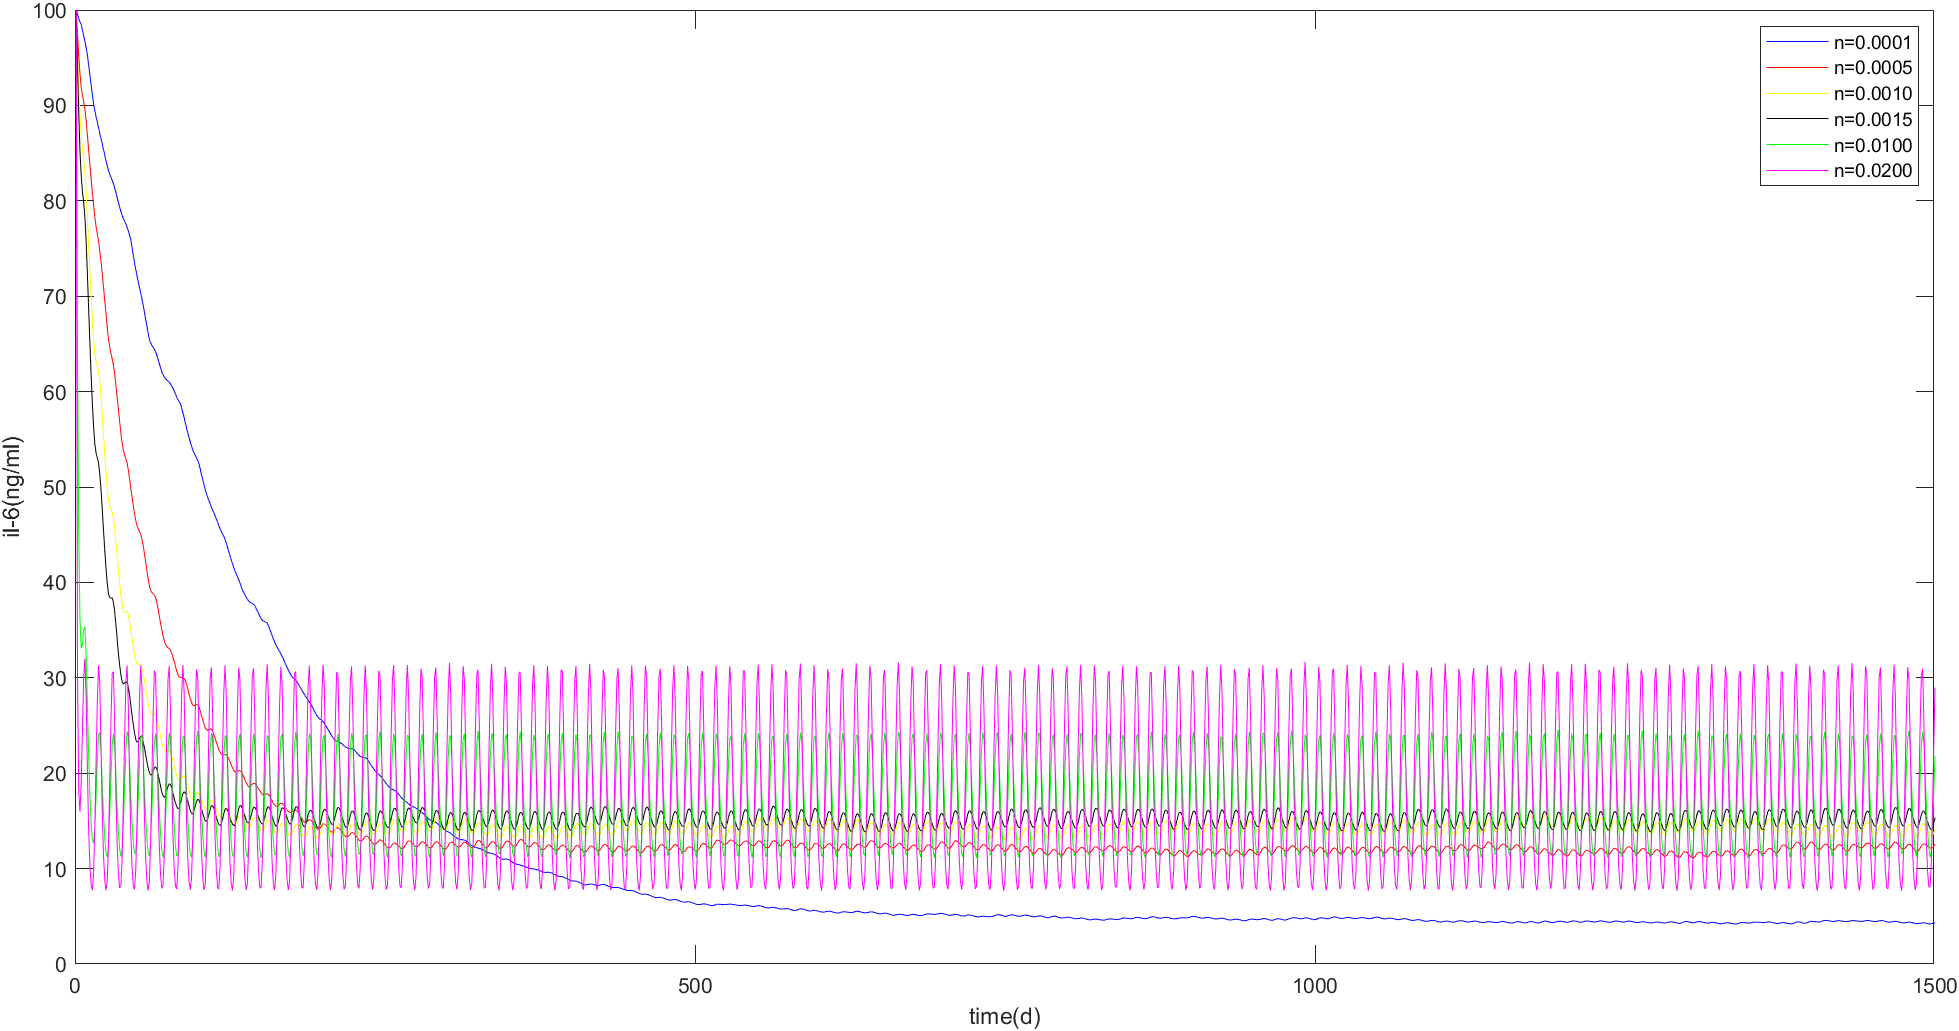
Fig. 12
When the initial IL-6 concentration is 100ng/ml, as shown in Figure 12, the changes of the stable values of each curve corresponding to different n values are consistent with Figure 10, and the stable values of the same n value do not change.For N values of 0.0100 to 0.0270 units, the patient's IL-6 concentration can be reduced to less than mild within 10 days. For N values between 0.0184 and 0.0270 units, it takes only three days to reduce a patient's IL-6 concentration to below mild level. values are consistent with Figure 10, and the stable values of the same n value do not change.
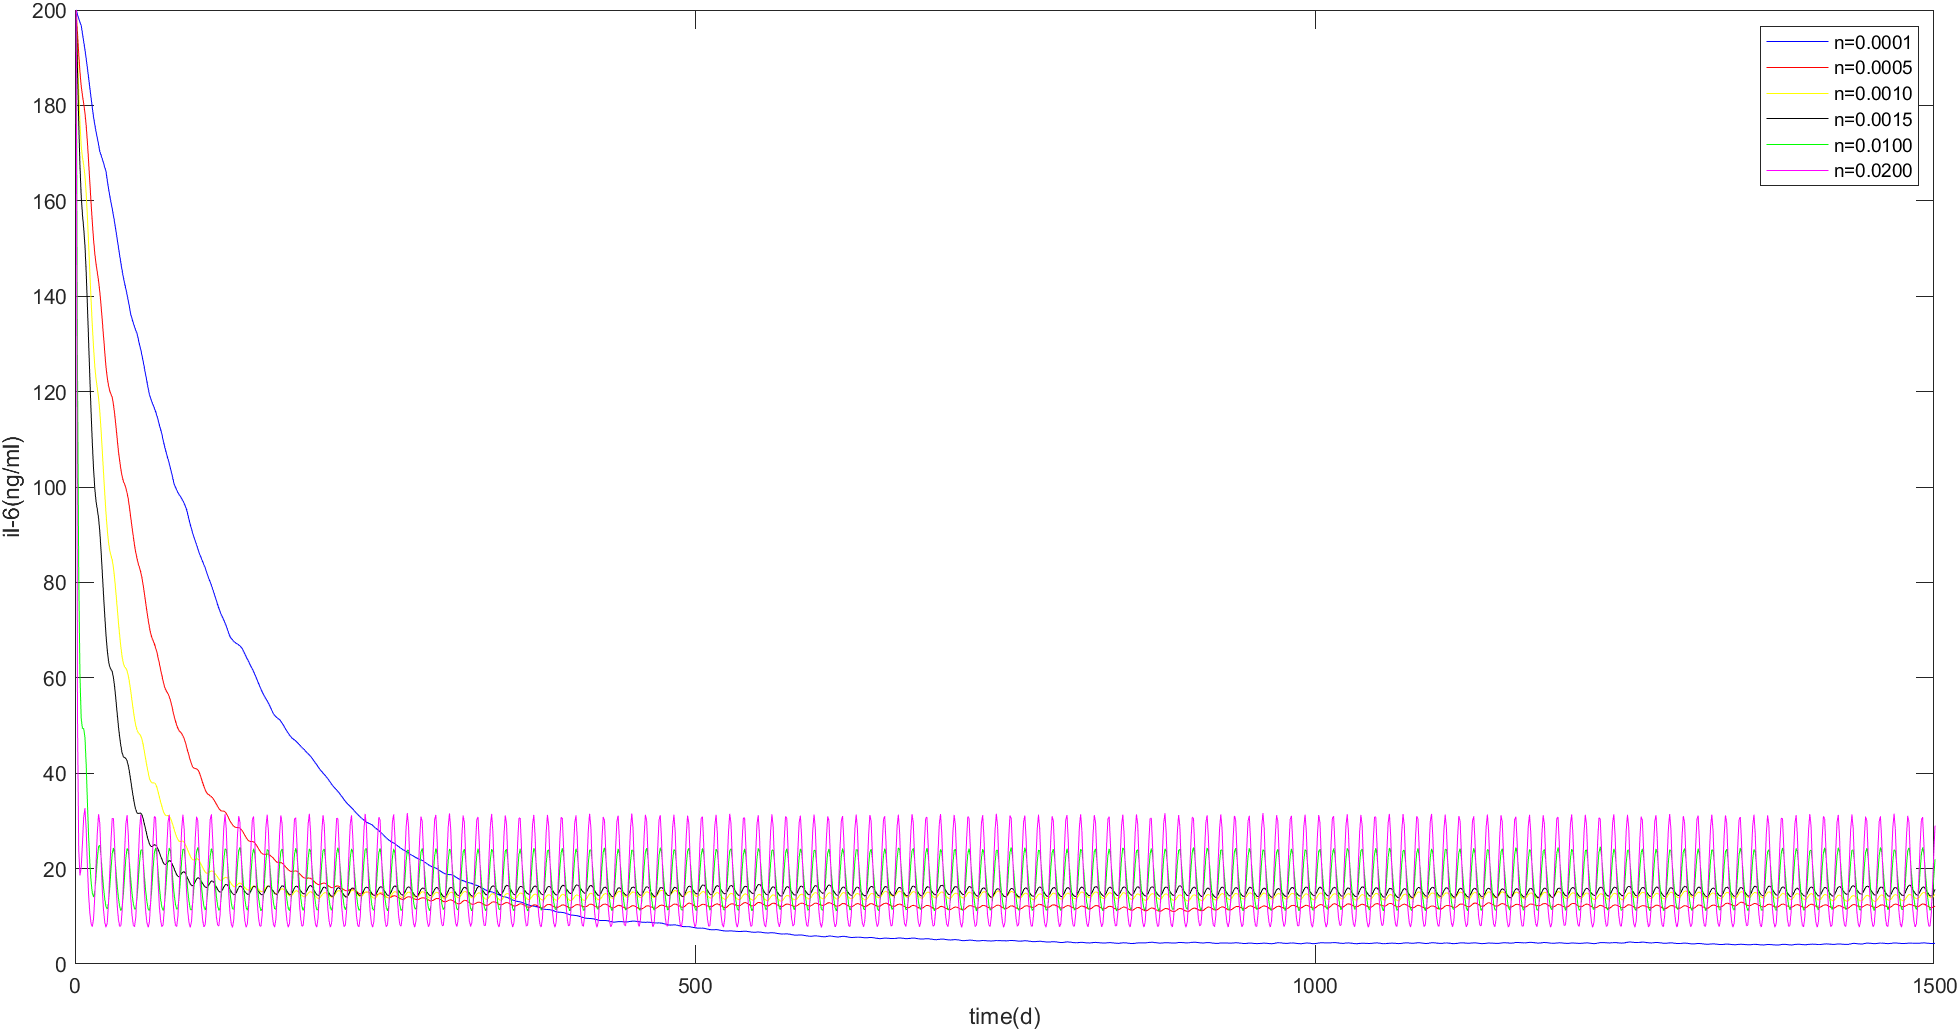
Fig. 13
When the initial IL-6 concentration is 200ng/ml, as shown in Figure 13.
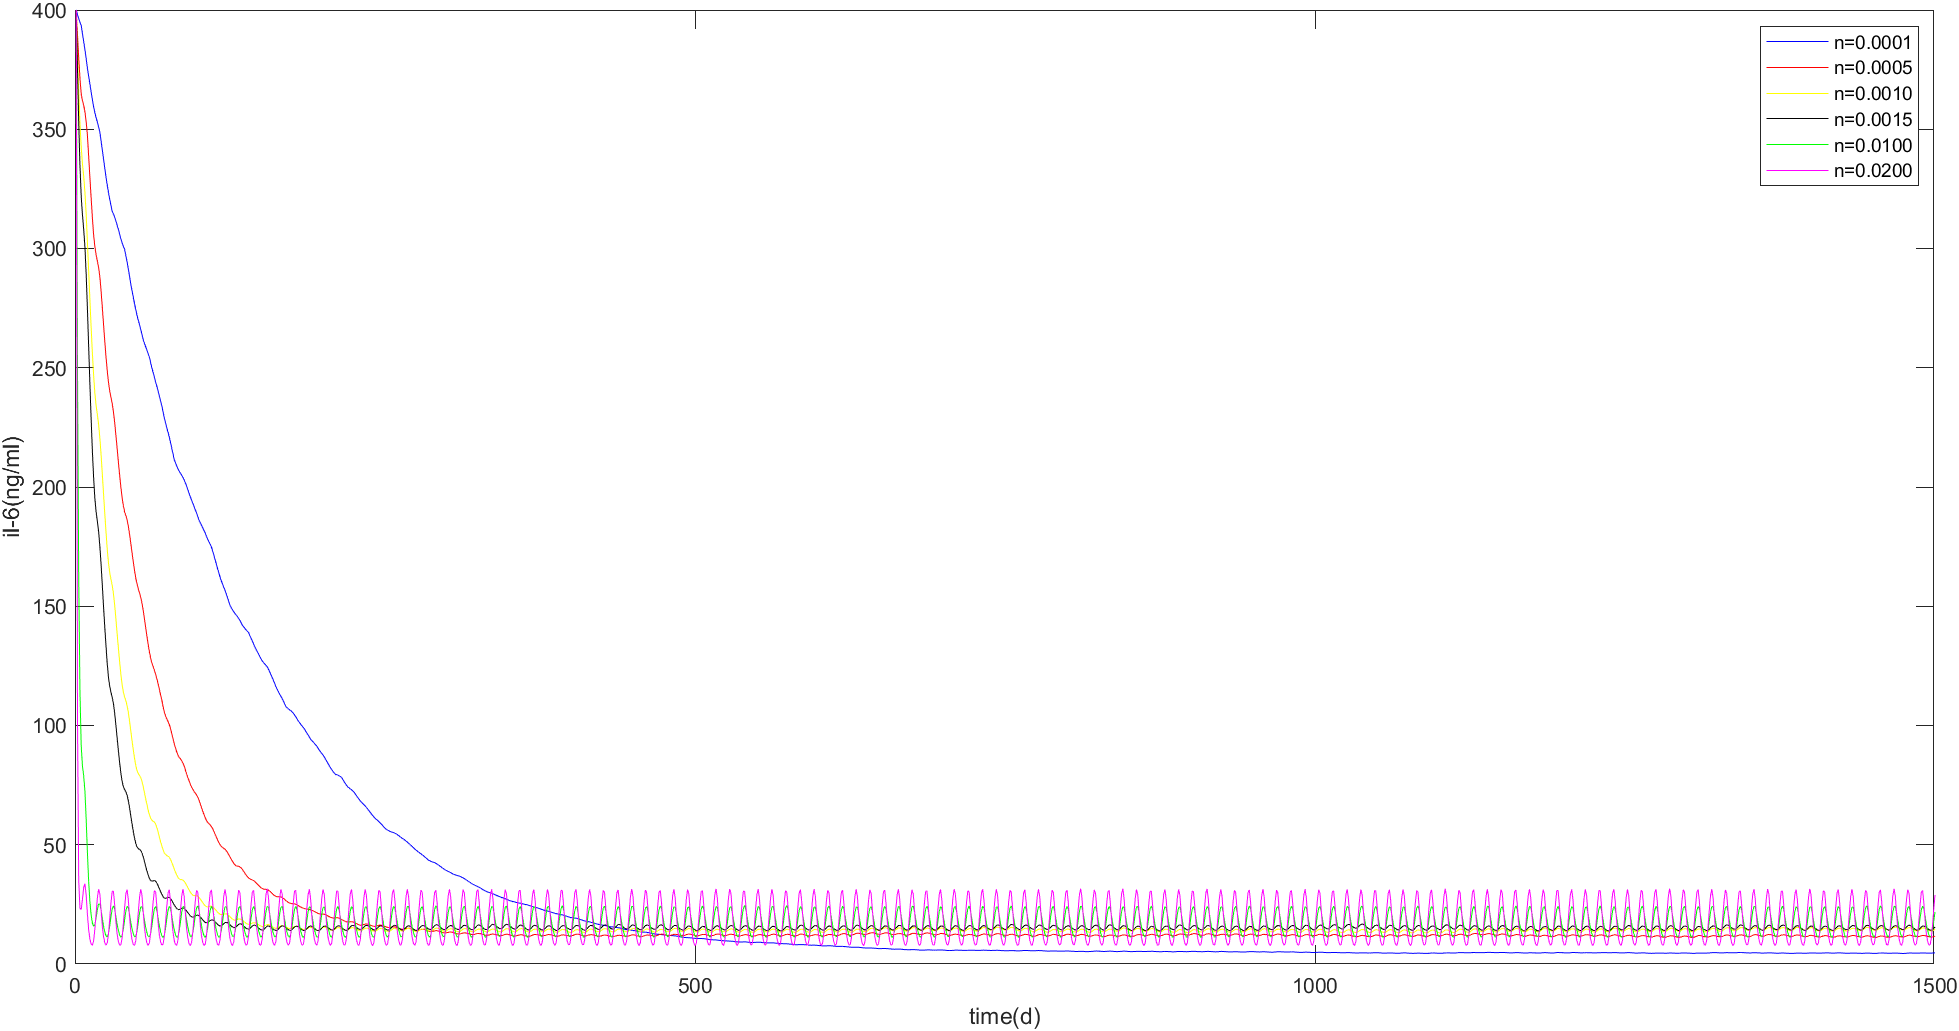
Fig. 14
When the initial IL-6 concentration is 400ng/ml as shown in Figure 14:
In order to test whether the stability value of each group was affected by the random interference item of virus, the observation results of viral load were generated randomly for several times. It was found that the stability value of each group did not change although the viral load generated randomly was different each time.
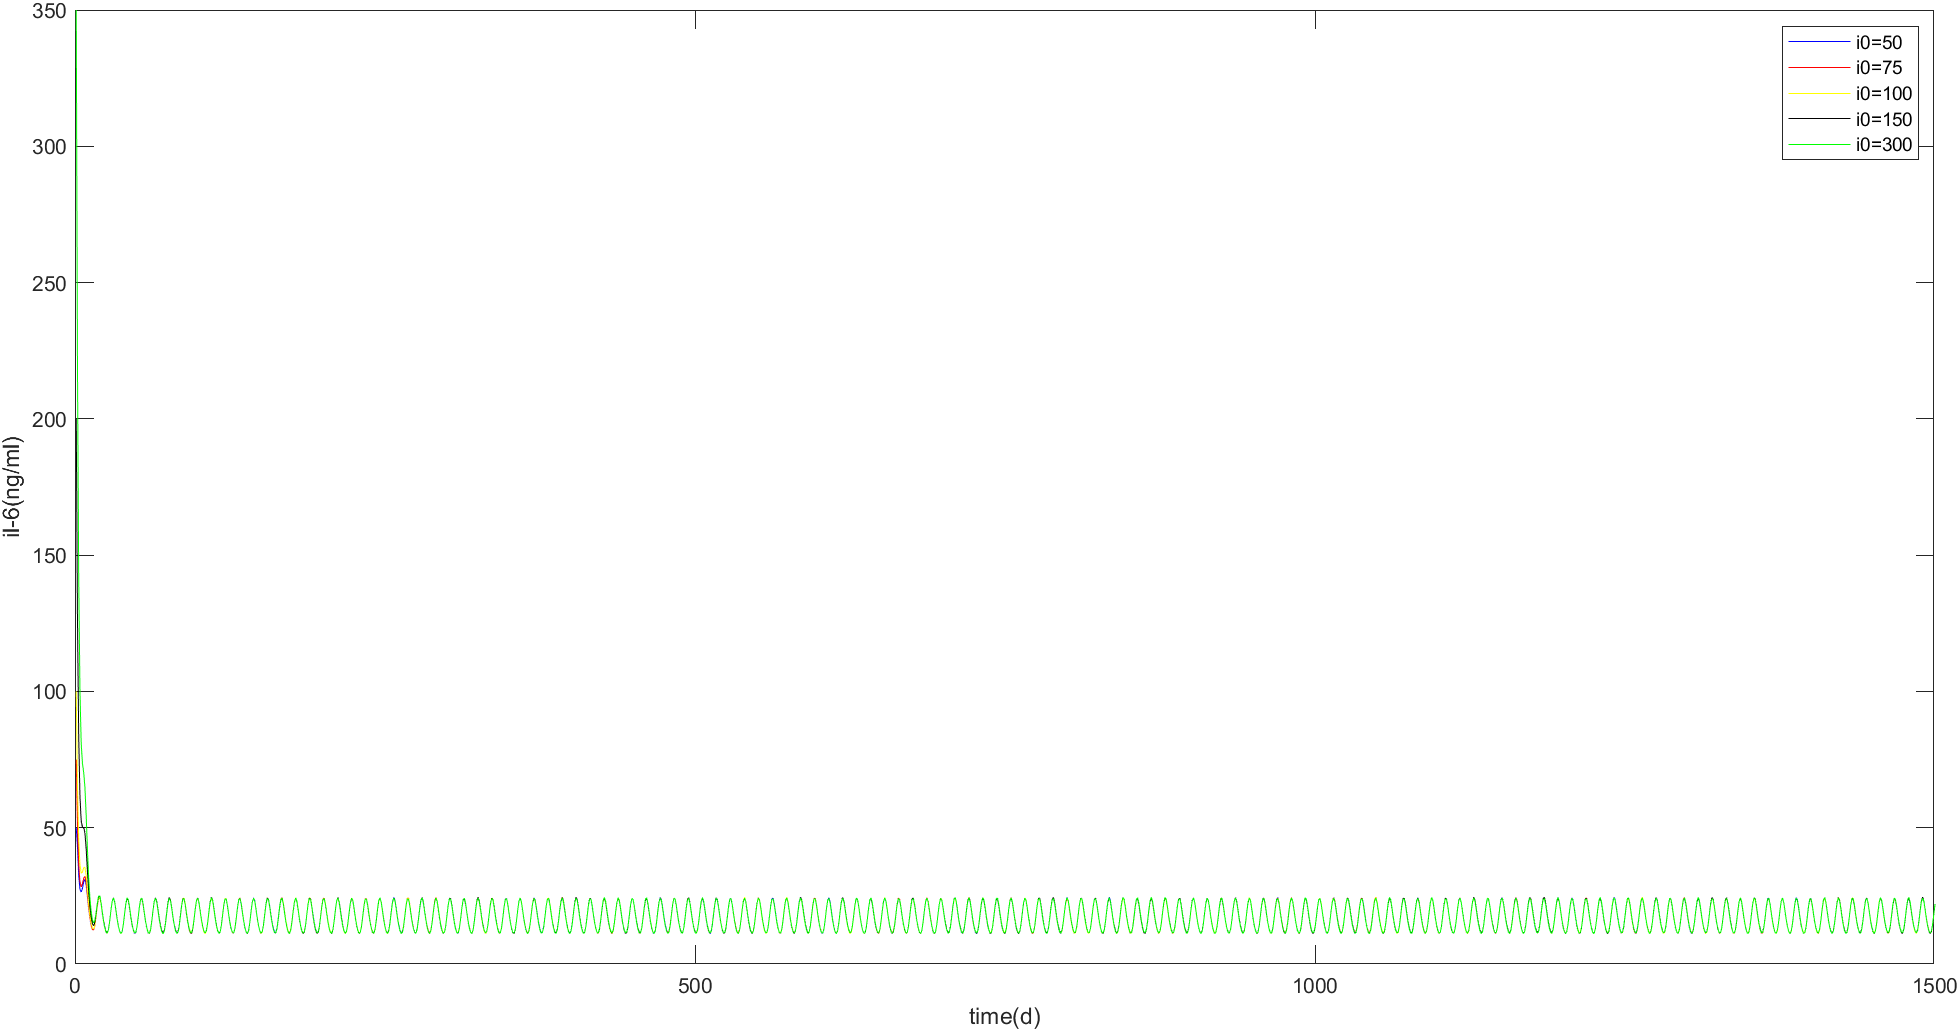
Fig. 15
Figure 15 shows the changes of IL-6 concentration over time when n=0.0050 and the initial IL-6concentration values were 50,75,100,150,300 ng/ml, respectively. It can be seen that the curves in the figure finally converge into one, oscillating up and down around 17.1ng/ml.
Result analysis
Combined with Fig. 10 ~ 14 and MATLAB calculation results, the following rules can be found:
1. For a given initial value of IL-6 concentration i0, n has a certain range [a,b] in which IL-6 oscillates around a certain stable value M, and the range of oscillation is [L, U].
2. Within the range of [A, B], the larger the n value is, the larger the IL-6 stable value m is, and the larger the oscillation range is, but the shorter the time required to reach the oscillation is.
3. Within the range of [A, B], the smaller the n value is, the smaller the IL-6 stable value m is, and the smaller the oscillation range is, but the time required to reach the oscillation is longer.
Therefore, we assume that clinicians measure the concentration of IL-6 “P” in the serum of patients, and calculate the concentration of IL-6 in tissues “I” by Formula (3). Then they input both P and I into our model to obtain the range [A, B] of the number of macrophages n that can make IL-6 oscillate at a certain stable value M. In order to figure out the optimal number of macrophages n, we need to further limit the range of oscillation according to clinical requirements. Here, we propose the following constraints:
1. The high value U of oscillation is not higher than the IL-6 concentration in tissues of patients with mild symptoms
2.Clinicians can make more demands on scope……
There are many clinical limitations on cytokine levels, and we just give an example here. In conclusion, a feasible number of macrophages can be determined by further limiting the oscillation range [A,B].
Application examples
When the initial IL-6 concentration measured in the patient's blood sample was 50pg/ml, the initial IL-6 concentration in the patient's tissue could be calculated as 320ng/ mL according to Formula (3). The initial IL-6 concentration in the tissue could be substituted into Formula (6) to find that macrophages could make IL-6 oscillate around a stable value within the range of [0.0001,0.0270].
It is known that the stable value and oscillation range vary with the number of macrophages. We take five values of 0.0001, 0.0010, 0.0030, 0.0100 and 0.0200 in the range of [0.0001,0.0270] to observe their stable value and oscillation range.
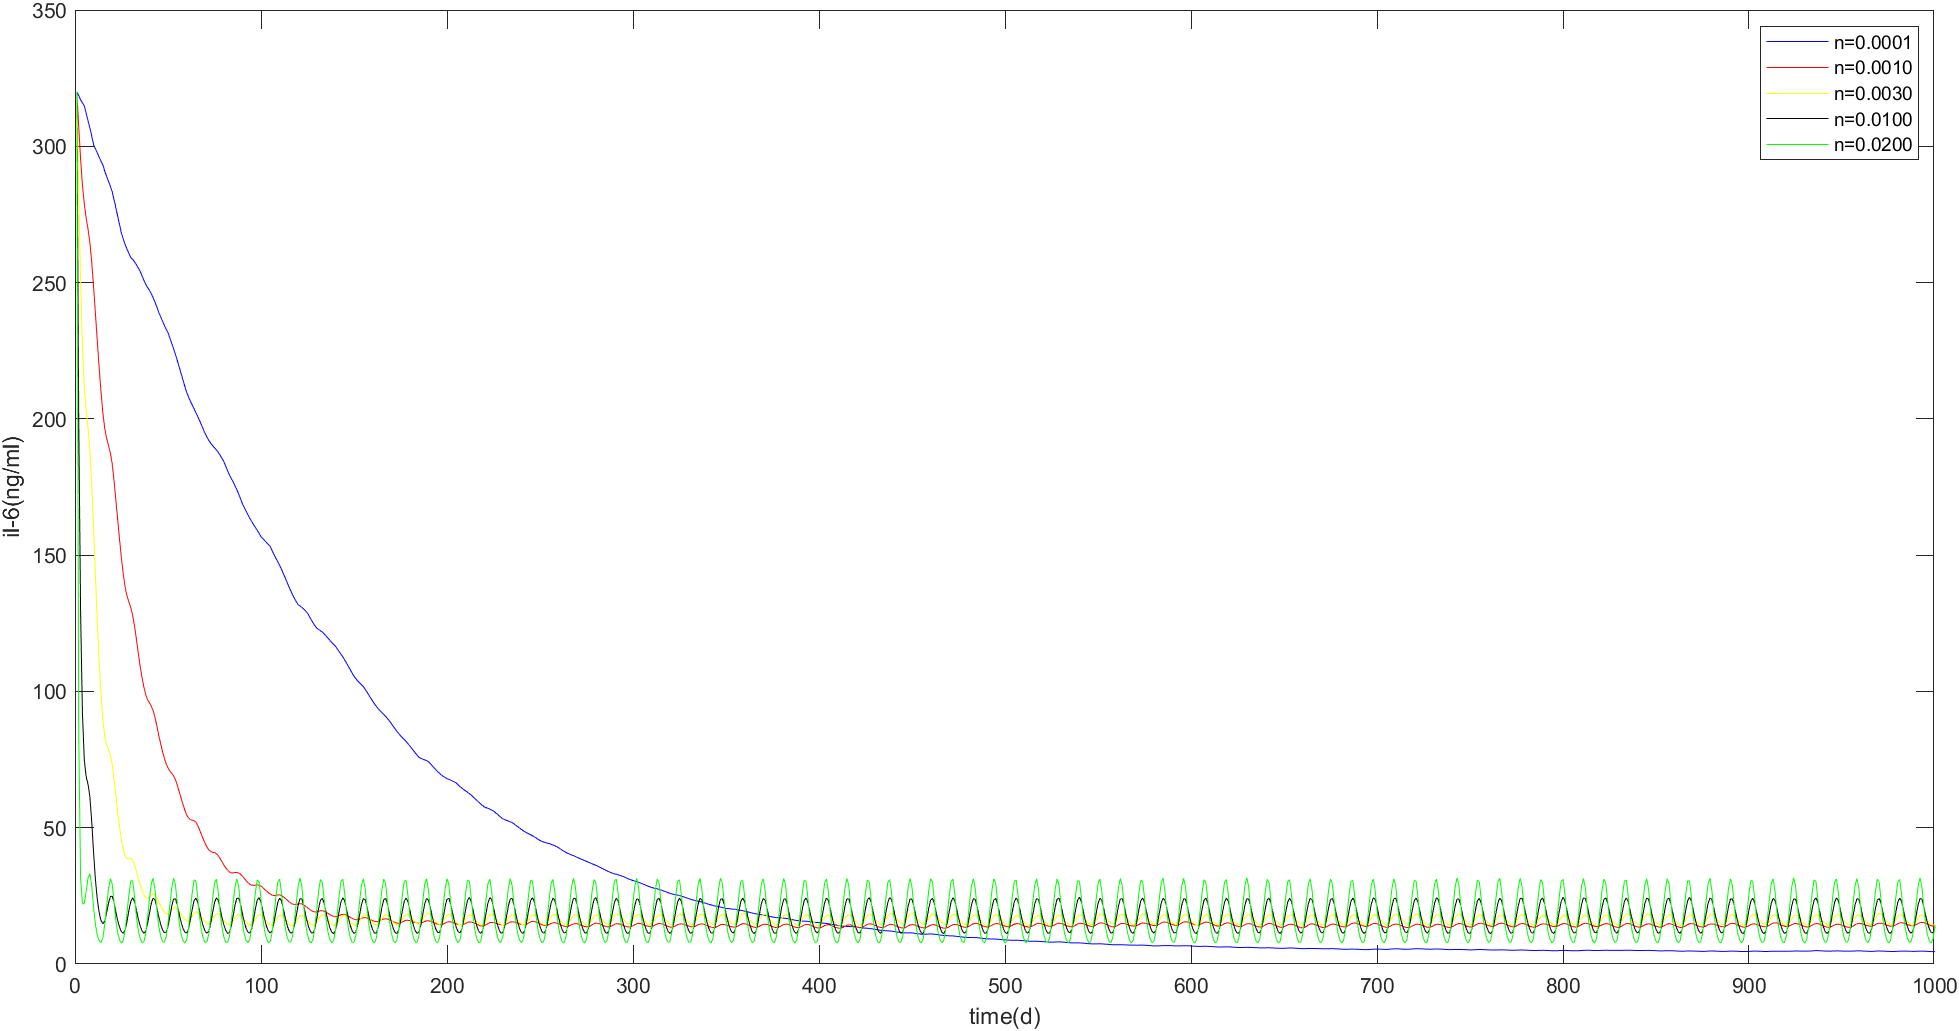
In the figure above, IL-6 concentration changes over time when macrophage number n is 0.0001, 0.0010, 0.0030, 0.0100, and 0.0200. It can be seen that when n=0.0001, the concentration of IL-6 has the lowest stable value, and the oscillation amplitude near the stable value is the smallest, but the speed of reaching the stable value is the slowest, which is in line with our expectations. As can be seen from the figure, in order to make the high oscillation value of IL-6 concentration not higher than 40.32 ng/ml, which is the IL-6 concentration in the tissues of patients with mild disease. 0.0001-0.0270 units, i.e. 1e3~2.7e5 macrophages, can be injected into the patients, and for all feasible n values, the high oscillation value of IL-6 concentration is not higher than 35.4ng/ ml. For n values of 0.0100 to 0.0270 units, the patient's IL-6 concentration can be reduced to less than mild within 10 days. For N values between 0.0184 and 0.0270 units, it takes only three days to reduce a patient's IL-6 concentration to below mild level.