Team:NCTU Formosa/Efficiency Optimization Model

Loading...


Introduction
In the meeting with our advisor (You-Siang Luo, NCTU), we found that controlling the time interval between each feeding is important. Once the time interval is too frequent, it might cause the indigestion of the dog; however, if the time interval is too long, the dental bone becomes inefficient.
The oral environment in different dogs fit different conditions, thus, striking the balance of controlling time intervals is a tough issue. Here comes a problem, how to get the best feeding interval to optimize the efficiency of our designed dental bone?
After several discussions and meetings, we finally came up with an idea: how about using reinforcement learning to predict the customized feeding intervals based on the amount of P. gingivalis?
To achieve the goal, we use PyTorch to construct our reinforcement model and predict next feeding time. Moreover, we also show that compared to regular feeding, our reinforcement model indeed improves the dental bone utilization efficiency.
Machine learning
Overview
Artificial intelligence is a prevalent technique now trending all over the world, and machine learning is a branch of artificial intelligence. A growing number of experts apply machine learning to different fields to further study their research.
Unlike traditional programming, machine learning infer the rule according to input data. In the training process, the model optimizes the parameters by referring to the training data, which includes features and labels. In other words, the model “learns” in this process.


Reinforcement Learning (RL)
RL is a subclass of machine learning concerned with how intelligent agents ought to take actions in an environment in order to maximize the notion of cumulative reward. RL is one of three basic machine learning paradigms, alongside supervised learning and unsupervised learning.
Before introducing the process of reinforcement learning, here are some important terminologies have to be clarified:
- Agent:
The agent is also the brain of the RL model, which is responsible for adapting to the environment, and will collect the state at every point in the environment.
- Environment:
The interaction target. It gets actions from the agent and gives reward and current state to the agent.
- Policy:
Policy is usually composed of a complicated machine learning algorithm, where the agent predicts the next action. The policy will obtain the state from the environment, input into the policy, and output the next action after the calculation process.
- Reward:
Reward is programmer-defined, and is the most crucial part of the RL model, which requires domain knowledge and significantly influences the model performance. The training process is to reach the maximum rewards, so that the change of cumulative reward is also an important performance evaluation method.
Efficiency Optimization Model
Overview
Our Efficiency optimization model combines reinforcement learning and takes our prediction model as the environment to virtualize the interaction among our designed dental bone, P. gingivalis in dog mouth and the reinforcement learning model.
Before we apply our reinforcement learning model into a real dog, we use our prediction model to simulate the response of the bacteria number in the dog mouth.
Firstly, our device would measure the amount of P. gingivalis, virtually we obtain the bacteria number from the prediction model. Second, our model passes the bacteria number and default time interval to the neural network, which outputs the next time interval to the environment and calculates the reward and loss. Third, the reinforcement learning model obtains the loss, and then it can optimize its parameters in the neural network, which accurates the model. Finally, the model returns an optimized time interval to the environment and repeats the loops over and over again until the reward converges.
Environment
In our project, we’re planning to apply our system to a real dog, and the dog is the environment. Before we apply it into reality, our prediction model temporarily plays as the “virtual dog”, to simulate the response of the dog's oral environment to our designed dental bone.
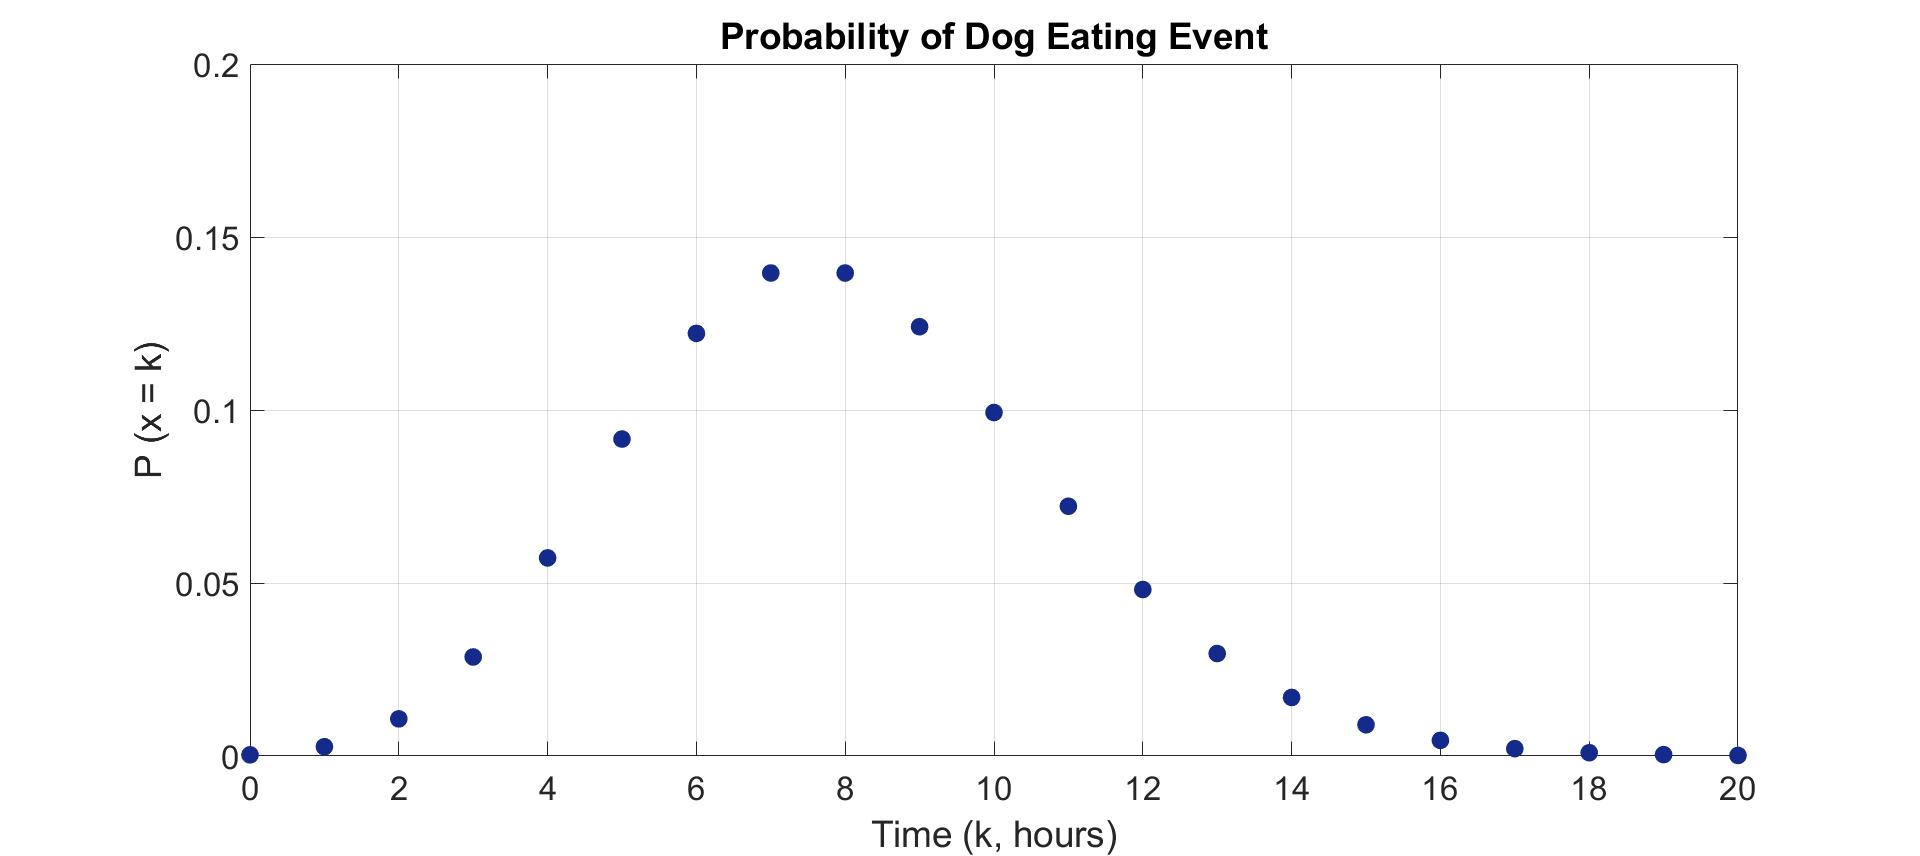
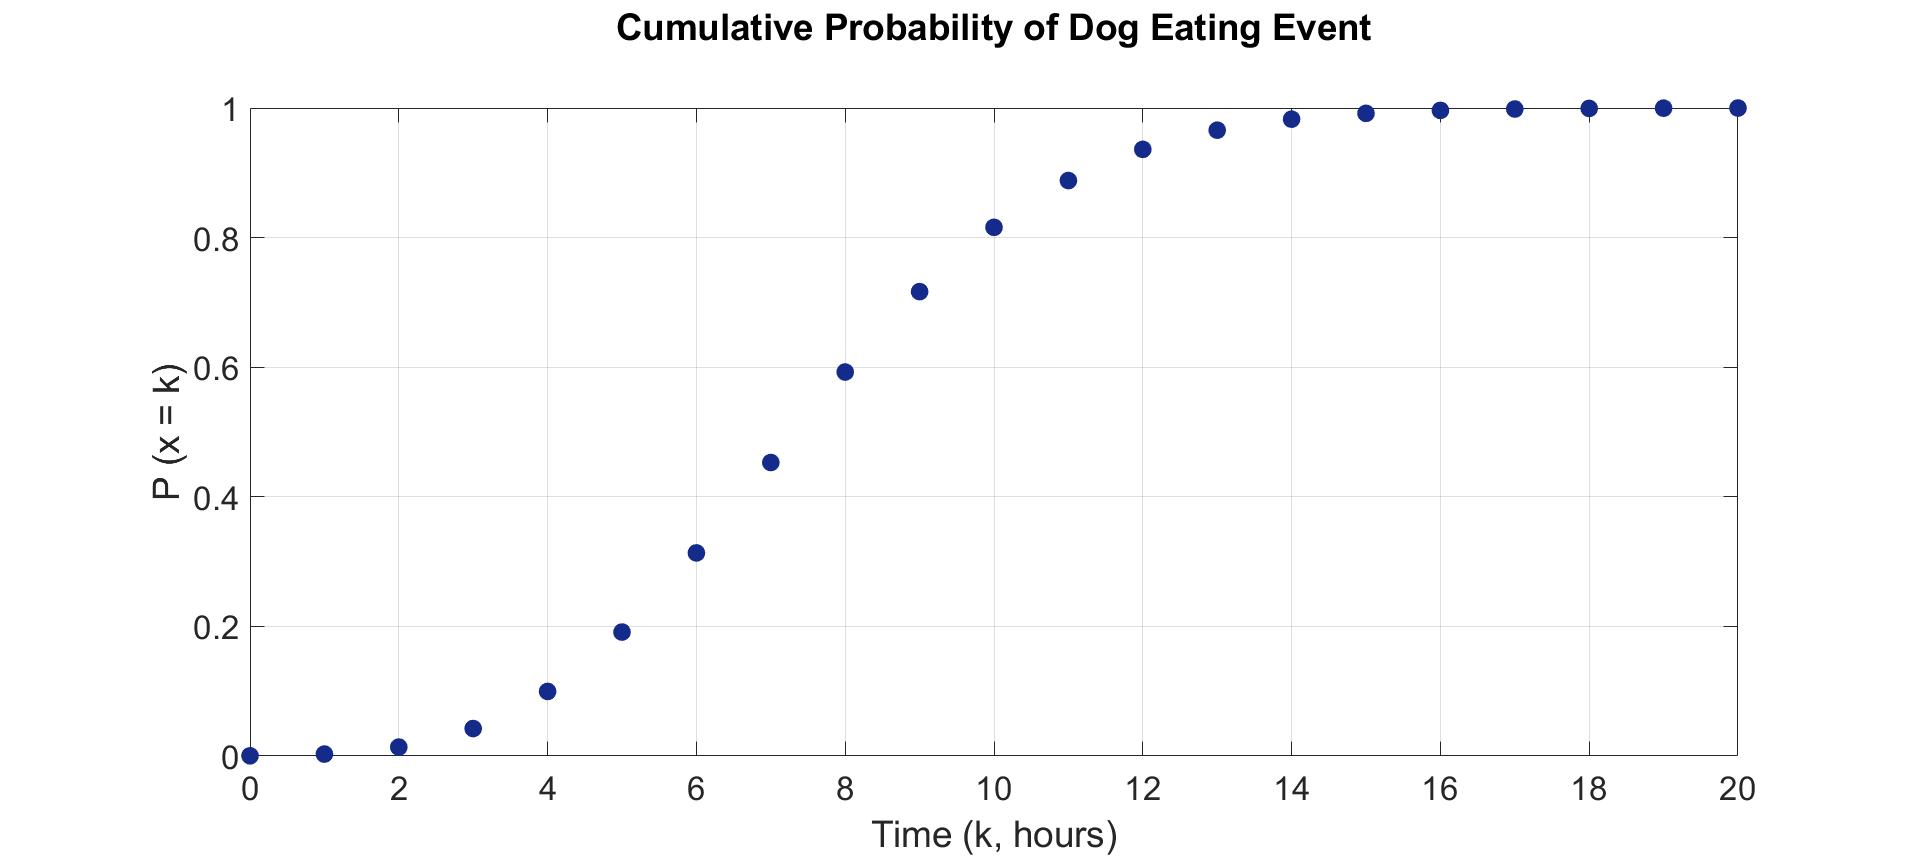
Otherwise, we found that the dog’s eating habits would also influence the number of bacteria in the dog’s mouth, in order to simulate the eating behavior, we imported the concept of Poisson random variable into the environment.
Poisson random variable is a commonly-used discrete probability model that expresses the probability of a given number of events occurring in a fixed interval of time or space. The probability mass function (PMF) of Poisson random variable is below:
$${\displaystyle P(x=k)={\frac {e^{-\lambda }\lambda ^{k}}{k!}}}$$
where lambda represents the expectation of the event.
Assuming that the dog eats three times a day, we set the lambda value as eight (hours).
Policy
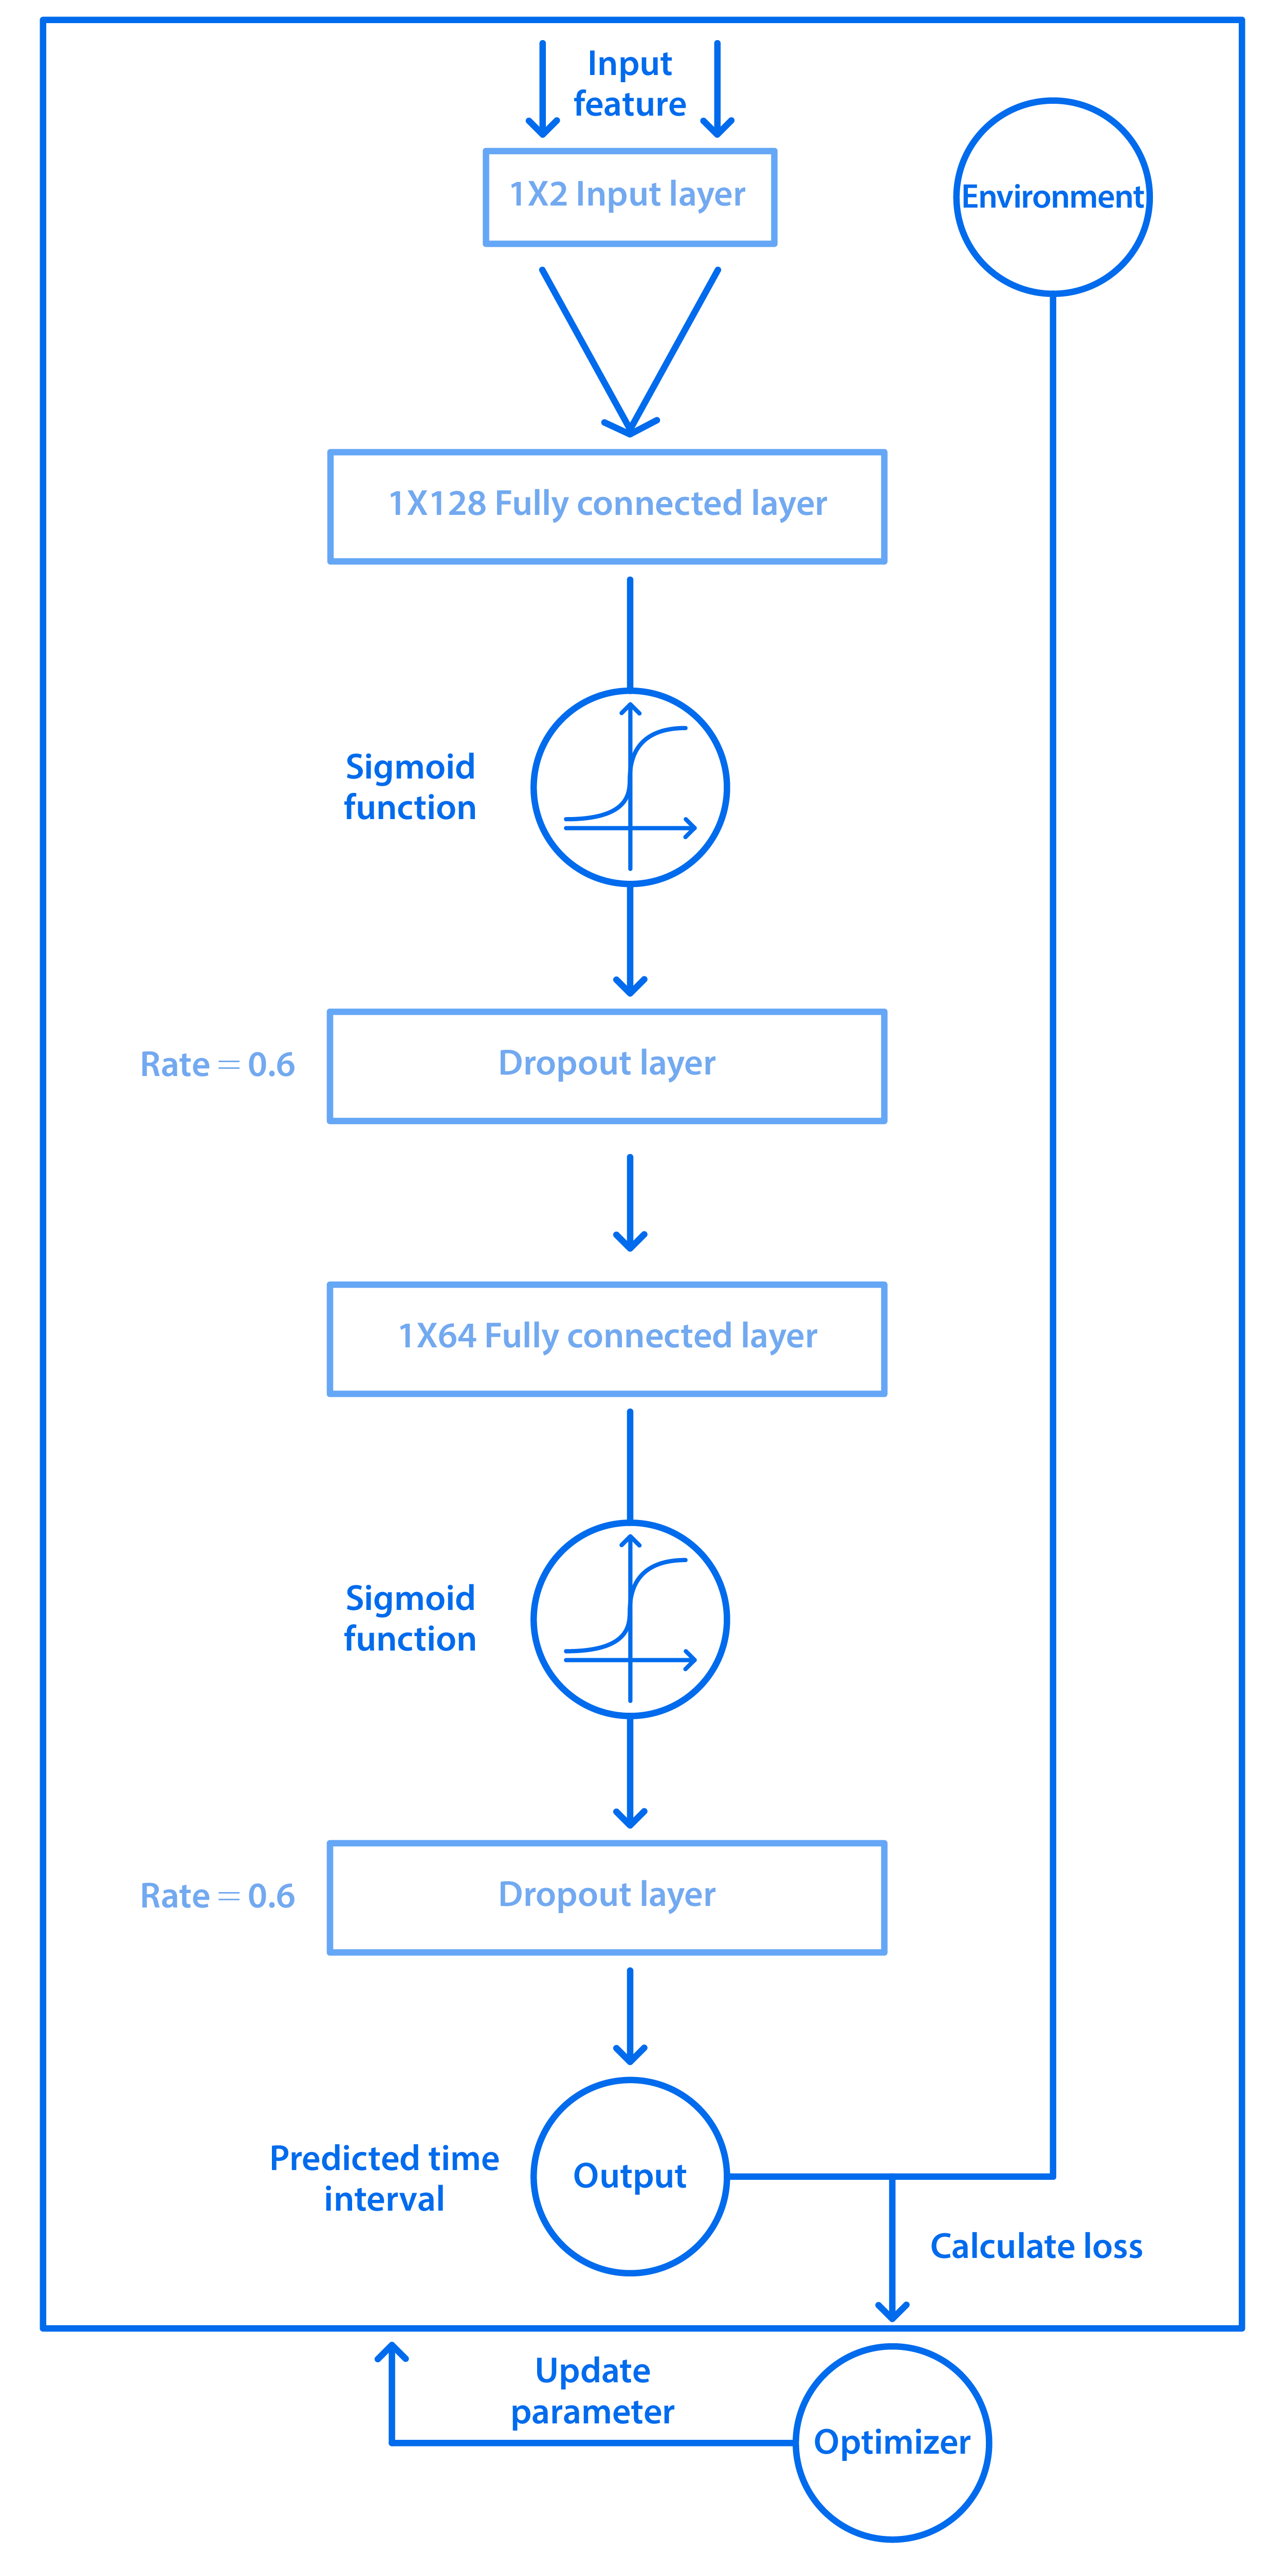
In the entire policy process, the number of bacteria and the default time interval are input in the ANN, and then the data pass through the calculation of fully connected layer, activation function, and dropout function respectively. Repeating the same steps 3 times, and outputting a predicted time interval. Besides, we use the designed loss function to evaluate the error, and the optimizer updates the weight parameters inside the model according to the error.
At first, each feature will be calculated by the following function:
$$x_j = \displaystyle \sum_{i\in in(j)}x_{ij}y_i+b_i$$
where Wij is the corresponding weight of the input yi to the output xj, and bj is the bias.
After getting the output value from the fully connected layer, we pass it to an activation function, which allows the neural network to solve non-trivial problems by using less node number. We use sigmoid function as the activation function here, which satisfies the following formula:
$$f(x) = \frac{1}{1+e^x}$$
Moreover, output neurons would be closed randomly according to dropout probability, which avoids overfitting because this method can lower the probability that the output value relies on some specific feature too much.
Repeating the same steps from fully connected layer to dropout layer, but we reduce the input/output feature number to 64, and then to 1, in order to gradually extract the predictive time interval.
Reward Function
The overall RL training process is to minimize the “goal” and maximize the reward, and the definition of goal and reward is case by case. In our project, we want to minimize the number of bacteria in the dog’s mouth the whole time. Thus we define our goal as the following formula:
$$Goal = \frac{c\int_0^T B(t) \,dt}{T}$$
where B represents the total number of bacteria (including P. gingivalis and engineered E. coli) while x = t, T is reaction time and c is a constant.
If we need to calculate the number of bacteria in the whole time, we must integrate B(t) from x = 0 to x = t, and then divide by T in order to meet the total amount of bacteria per unit time.
Then, the goal and the reward should be negatively correlated, thus we write reward function as reciprocal function:
$$Reward = \frac{T}{c\int_0^T B(t) \,dt}$$
Optimizer and Loss Function
The RL model updates its parameter by referring to the loss, which is the evaluation result based on the error between the label and the prediction from the algorithm. The loss function defines “how much is the error” and the optimizer decides “how much should adjust the parameter.” Thus the appropriate loss function and optimizer definitely improve the convergence speed and performance during the whole training process.
By doing countless trials, we found out the most suitable loss function as the following formula (function 6), and the optimizer is to minimize it, which can be shown below:
$$ min(-\ln\frac{T}{c\int_0^T B(t) \,dt})$$
Result
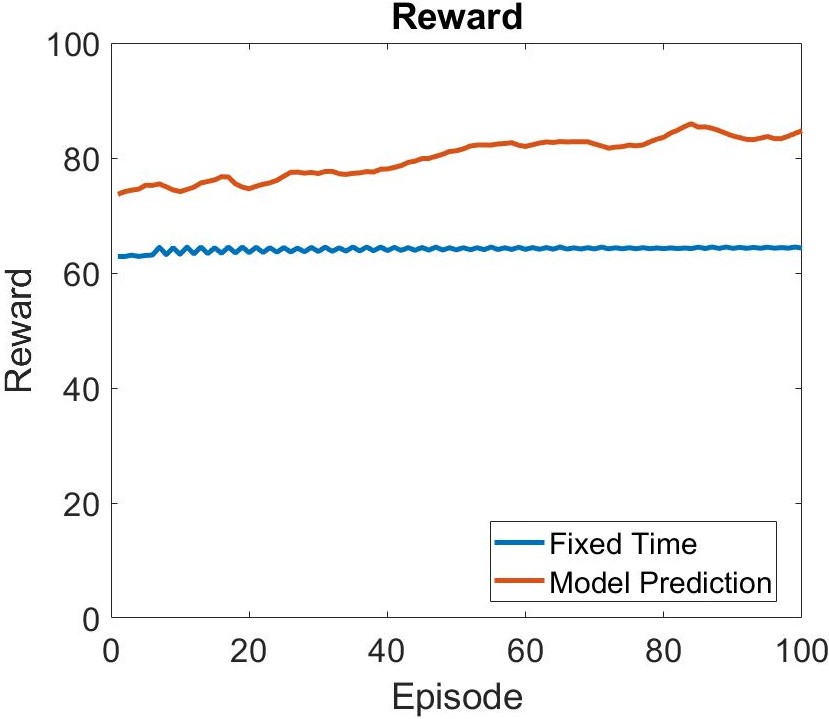
Reward
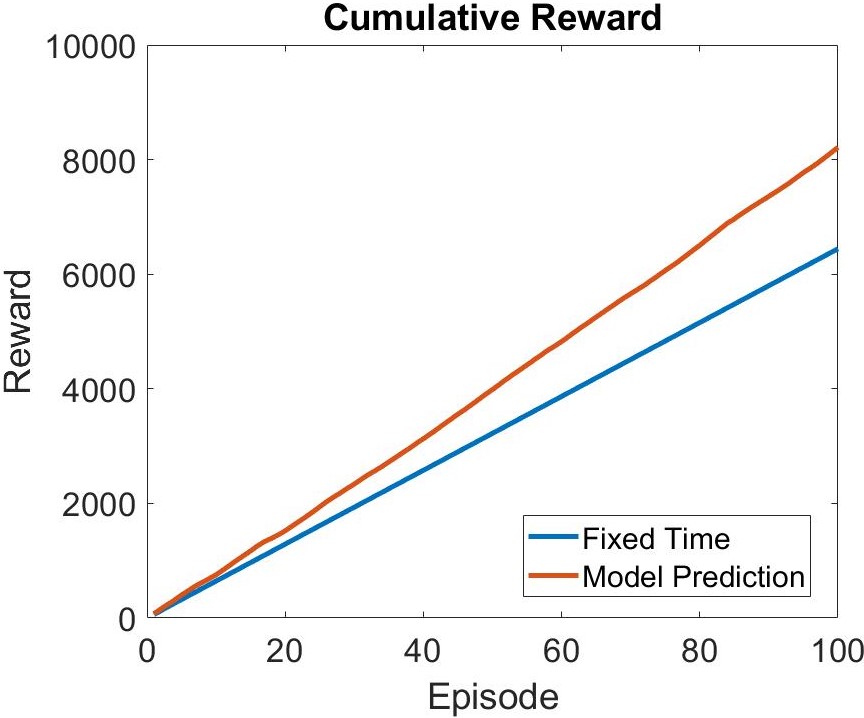
To investigate if the RL model shows better efficiency, we do a comparison with fixed time feeding. Figure 3.A shows the reward of the RL model and fixed time feeding with respect to time. From figure 3.A, we found that the model is capable of increasing the reward as the episode goes. Figure 3.B is the cumulative reward with respect to time of RL model and fixed time feeding. We are able to observe that as the episode goes, the optimization efficiency of the RL model is gradually greater.
Experiment
In order to validate the efficiency optimization model usable in any environment, we use E. coli with pSB1K3, hydrogen peroxide, and glucose to simulate as P. gingivalis, feeding dental bones and eating foods. As a result of the different environments of the experiment and the dog's mouse. We modified the environment reaction function to meet requirements.
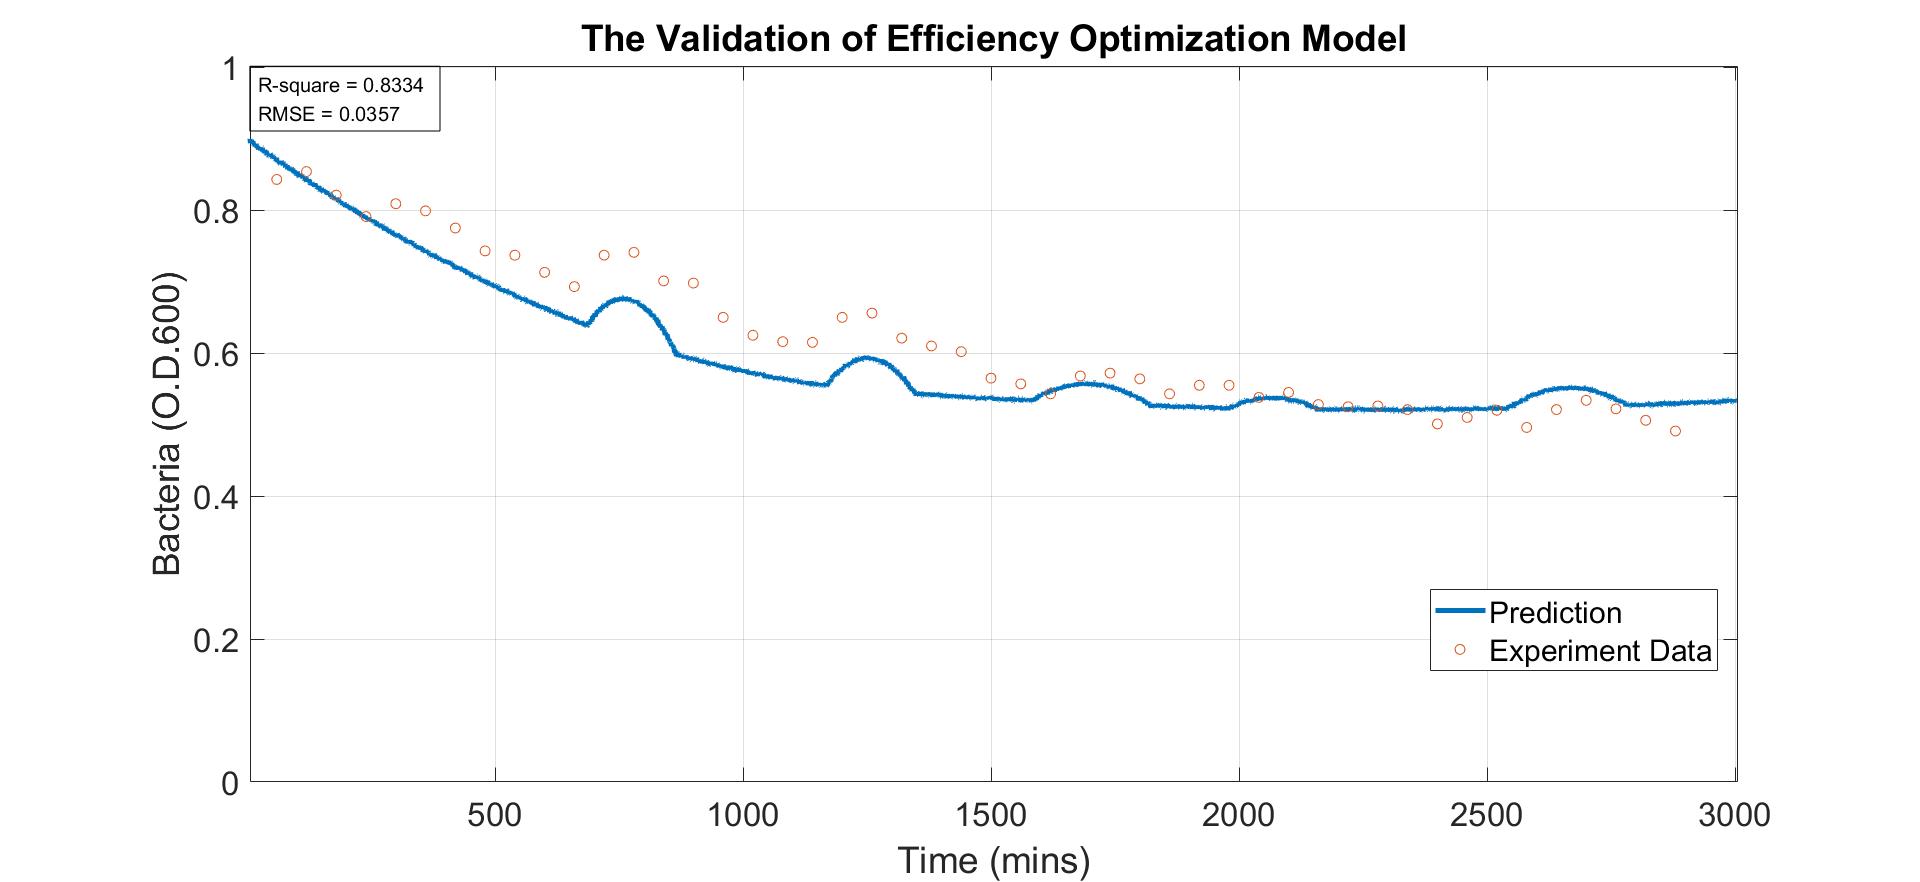
The above figure shows that the prediction value is very close to the experimental data, and the prediction is very accurate and precise by observing the R-square and RMSE.
After validating the accuracy and precision of the model, we further compare the reward of two dental bone feeding policies. Policy 1 (control group) is feeding dental bone with a fixed time interval. Policy 2 (experimental group) is feeding dental bone with RL prediction results.
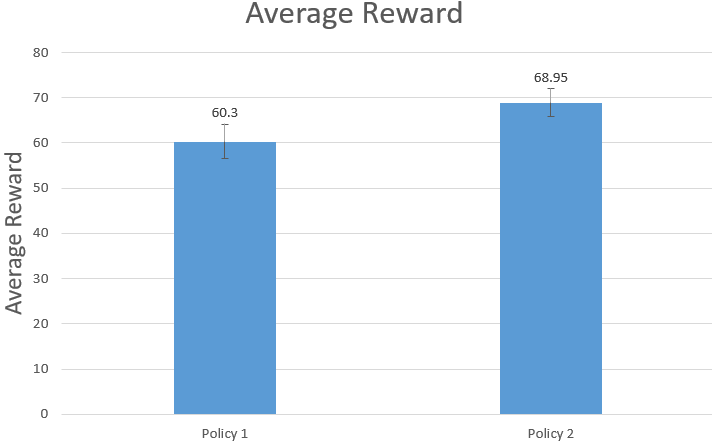
Through calculating the reward of policy 1 and policy 2 by reward function, we can claim the reward of policy 2 is statistically higher than policy 1. Simply speaking, through the validation experiment, we successfully proved the optimization ability of this model.
Reference
- Acar, E., Camtepe, S.A., Krishnamoorthy, M., Yener, B.: Modeling and multiway analysis of chatroom tensors. In: Proceedings of the IEEE International Conference on Intelligence and Security Informatics, pp. 256–268. Springer, Berlin (2005).
- Hinton GE. Learning multiple layers of representation. Trends Cogn Sci. 2007;11:428–34.
- Mitchell TM. Machine learning. New York: McGraw-Hill; 1997. Consul, P. C., & Jain, G. C. (1973). A Generalization of the Poisson Distribution. Technometrics, 15(4), 791–799.
- https://2019.igem.org/Team:NCTU_Formosa/Mutagenicity_Prediction
- Apley, Daniel W., and Jingyu Zhu. “Visualizing the effects of predictor variables in black box supervised learning models.” Journal of the Royal Statistical Society: Series B (Statistical Methodology) 82.4 (2020): 1059-1086.