Team:McMaster/Model
Modelling
How did we use mathematical models and computer simulations in our work?Detection Module
Iteration 1
The first iteration was modelling circuit modules 1 and 2: the QseB and QseC circuit.
Circuit 1: NO, NsrR And Gate
| NO | NsrR | QseB Generation |
|---|---|---|
| 0 | 0 | 0 |
| 1 | 0 | 0 |
| 0 | 1 | 0 |
| 1 | 1 | 1 |
In the absence of NO and presence of NsrR do not generate QseB. In the presence of both NO and NsrR generate QseB.
Circuit 2: Has a constitutive promoter that constantly generates QseC
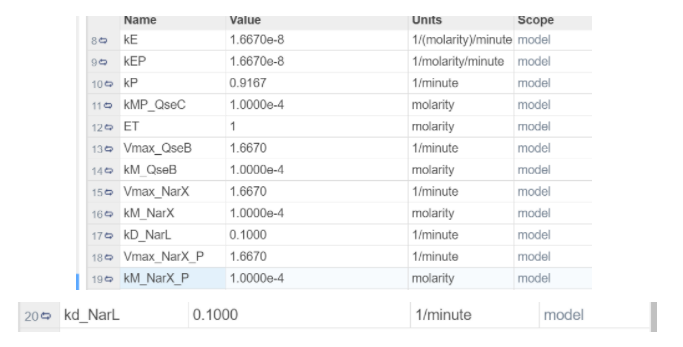
These are the parameters being used:
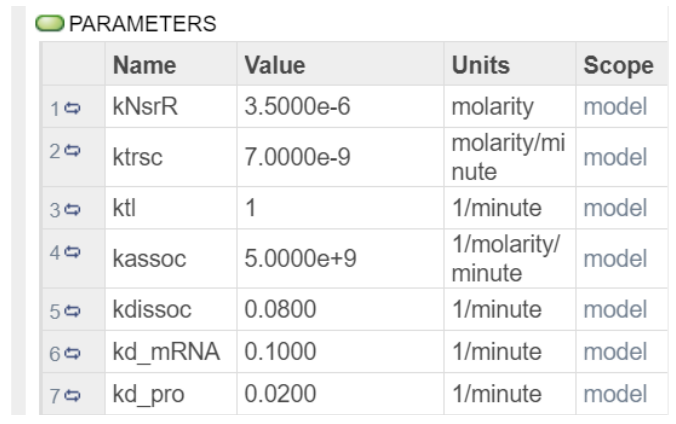
CKNsrR was obtained from Team:NCKU Tainan. And the rest of the parameters were obtained from the IBEHS 2P03 Final Exam Winter 2021 VERSION B .
These are the ODES being used:
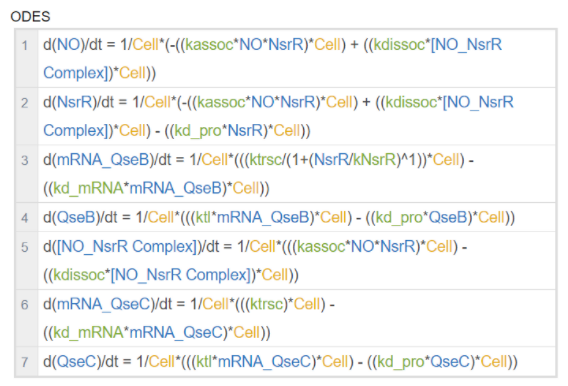
We are using the Hill equation for Transcription (Covert, 2015).
Simulation Results: Simulations were ran for 300 minutes
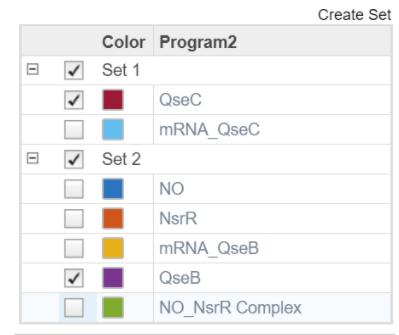
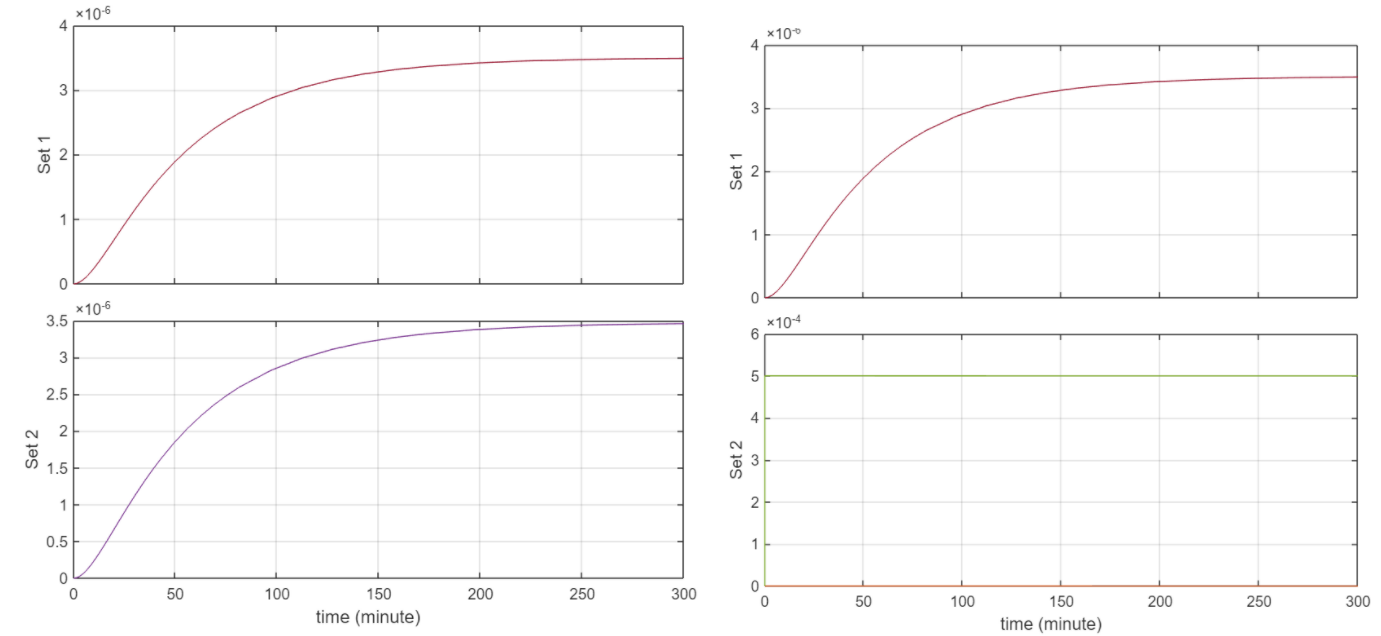
Both NsrR and NO were set to 5e-4
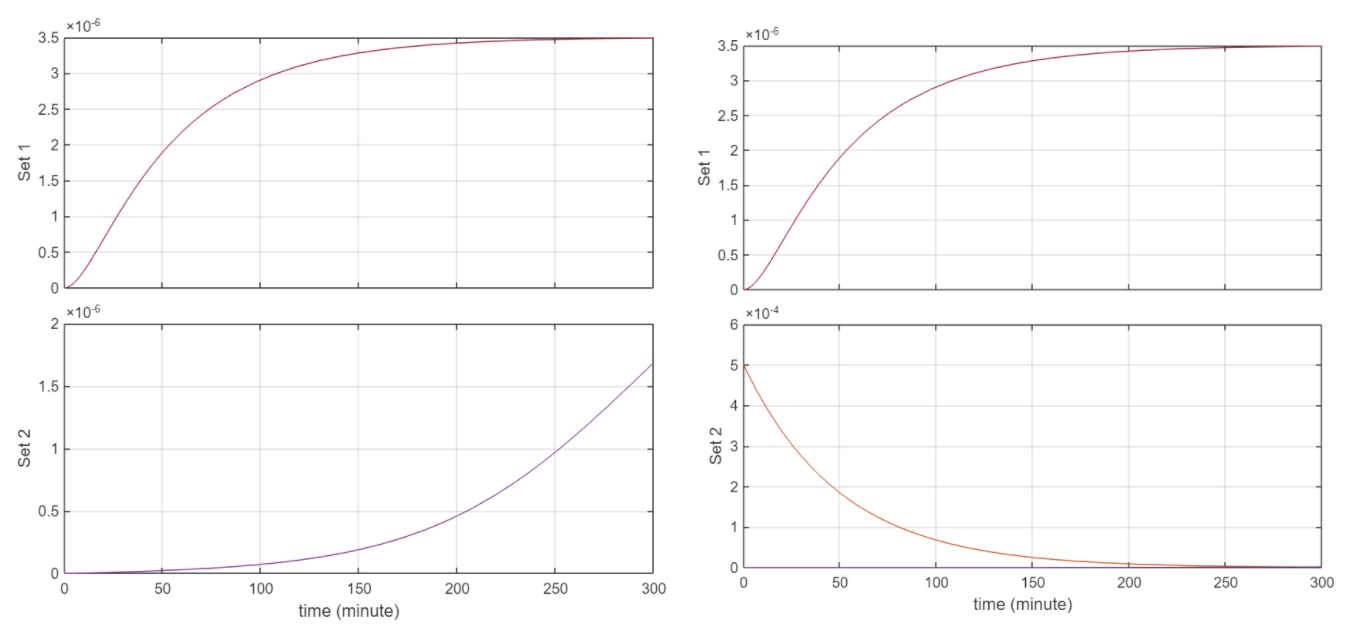
NsrR set to 5e-4, NO set to 5e-12
Discussion
Behaviour logically is consistent. From the first 2 figures, when the initial [] of NO and NsrR are the same, we have that same concentration of the complex. At this point the graph of concentration vs T for QseB and QseC are the same. This makes sense as the equation for QseC is simply the transcription rate ktrsc. And for QseB the reaction rate for transcription simplifies to ktrsc since the denominator simplifies to 1 + 0 given that NsrR = 0 as it’s forming the No_NsrR complex. Similarly as NsrR is degrading to 0 concentration, the equation for QseB transcription goes to ktrsc for the same reason stated above. Currently the circuit is rather insensitive to NO but this has to do with the rate constants.
Limitations
The biggest limitation of this model is the parameters used. Given that we weren’t able to go into the lab, we couldn’t experimentally determine these constants. Furthermore it was extremely difficult to find the relevant parameters online, therefore we resorted to using generic parameters. Another limitation is this model doesn’t show the full story of what’s going in the cell and how it connects to the rest of the circuits.
The purpose of this initial model was to verify that the current setup gives us the desired behaviour that we were looking for.
Iteration 2
The next iteration of the model added a lot more components to the model in order to show a more complete picture and also connect it with the other circuit.
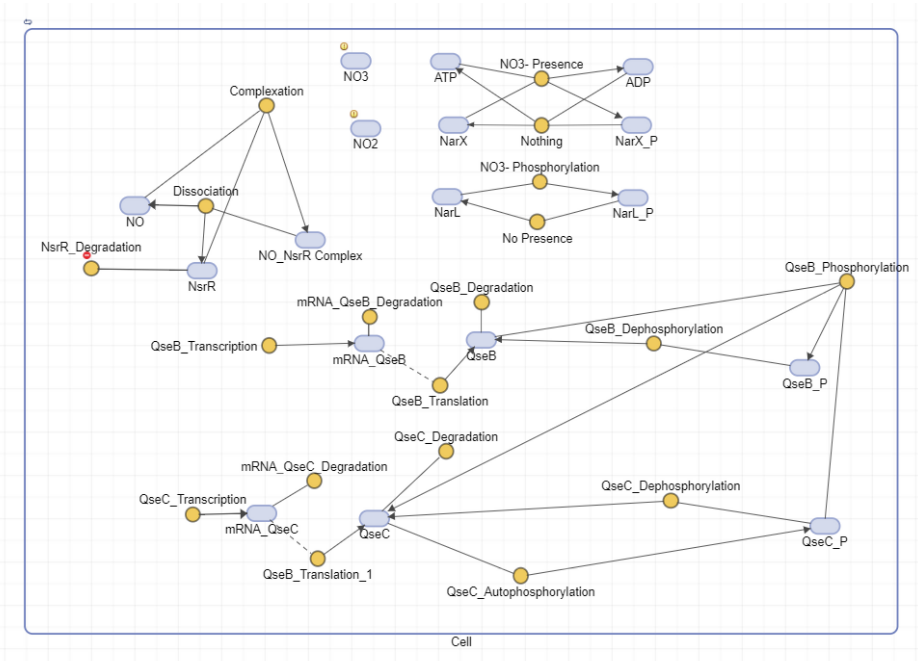
We’ve the autophosphorylation of QseC which aids in the phosphorylation of QseB (this is the part that links this circuit to the other circuit). As well we’ve added an NarX, NarL positive feedback loop which plays a role in QseB transcription, this provides a more complete picture for our circuit.
Equations: In addition to the equations used in the first iteration, there are two new equations for phosphorylation and autophosphorylation
Equation for autophosphorylation
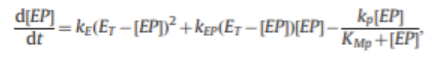
This equation is from (Doherty et al., 2015)
For phosphorylation, the Michaelis-Menten Equation for Enzyme Kinetics: v = Vmax[S]/(Km + [S]) = d[P]/dt is being used (Covert, 2015).
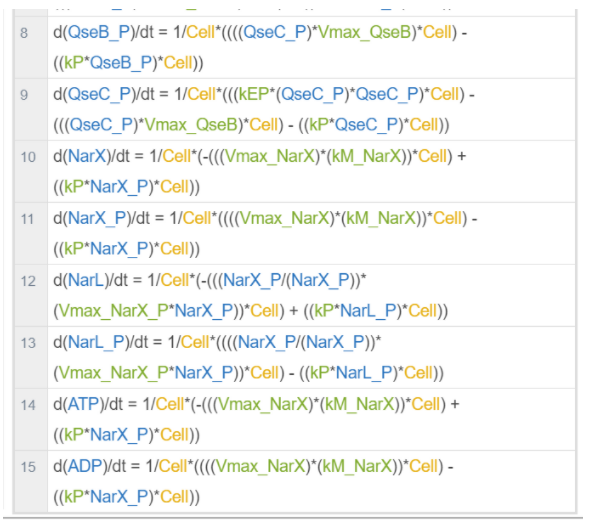
Parameters: In addition to the parameters used in the first iteration, this iteration has more parameters.
All of the kD_ parameters are the same as iteration 1. The other parameters were found from: (Doherty et al., 2015) divided by 60 to convert them from seconds to minutes. The paper describes kcat which is the rate of catalysis, and is given a range from 1- 100 1/s. For Vmax, we took the highest rate of catalysis. kP is of the form: kcat*[P] where P is the concentration of phosphatase, we’ve assumed that it’s 1 molarity and given that kcat is given in a range, so we’ve taken the average.
Simulation Results:
Unfortunately a simulation of this iteration could not be run because it did not meet the integration tolerance for matlab. Attempts to change the relative and absolute tolerance did not fix it.
Limitations:
As with the previous model, this iteration is greatly limited by the parameters. More so because the equations used are a lot more complex and required a lot more parameters. There were a lot of conflicts of units which were resolved by simplifying the equation immensely.
Future steps:
The most important step would be to find parameters that are compatible with the equations. Another step would be to try and find a proper equation for phosphorylation instead of using the Michaelis-Menten Equation for Enzyme Kinetics.
Effector Module
The modelling for the second circuit within this project was completed in a similar manner to the previous circuit. Here, the Hill equation for transcription was used to determine the response of the circuit when phosphorylated QseB is present.
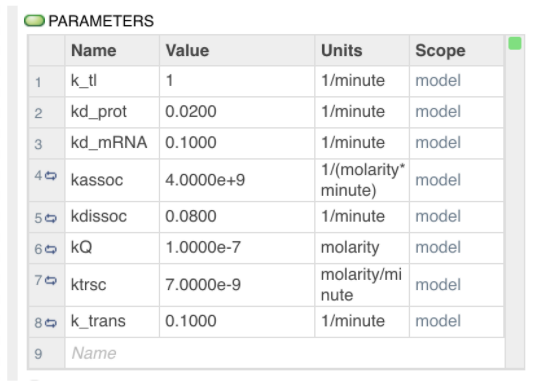
Parameters
The following parameters were used in designing this circuit. These values are general to E Coli circuits or were determined by extrapolating between similar values.
Equations
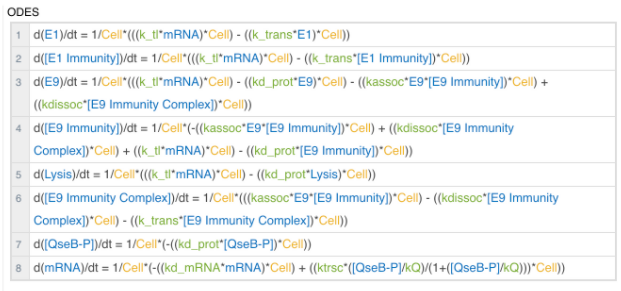
The following Ordinary Differential Equations can be used to predict the behaviour of this circuit. The equations follow standard transcription, translation, and degradation behaviour. To simplify the translocation component of this circuit, where translocation occurs the protein degradation rate was replaced with an approximate value for the rate of transport out of the cell using either transport mechanism mentioned in previous sections.
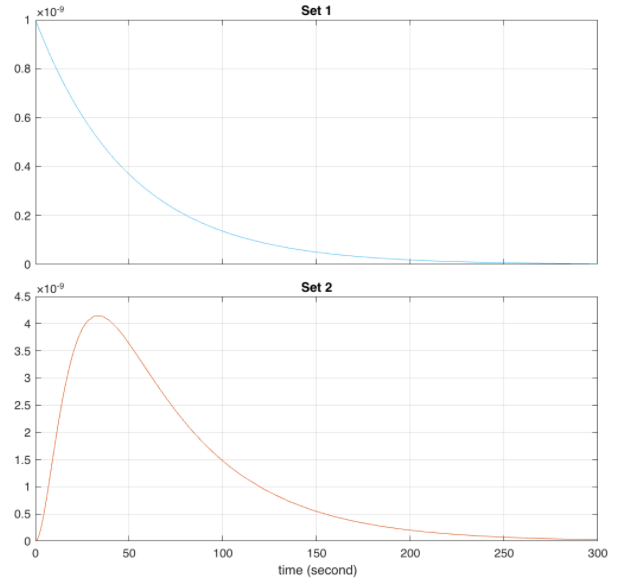
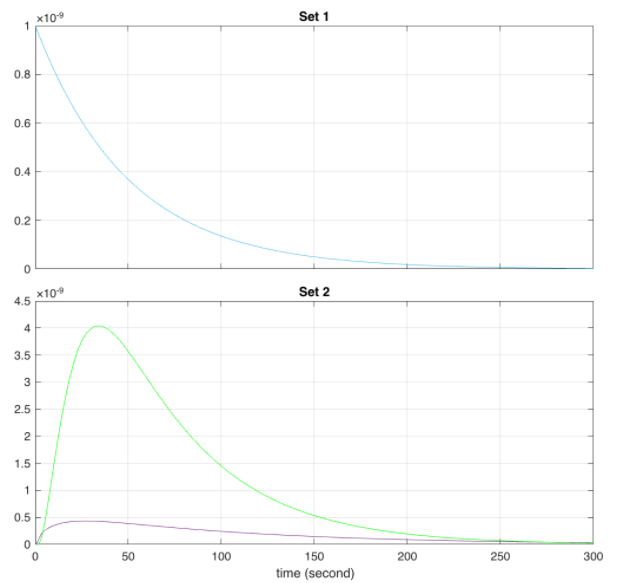
Simulation Plots
The simulations were each performed with an initial concentration of QseB set to 1E-9M and run for 300 seconds. The time component in these simulations can be ignored as a similar outcome would be expected upon adjusting the parameters and converting equations in terms of minutes or hours.
Order of plots: Comparison of QseB (set 1) and E9 and E9 immunity - the behaviour is identical, only one curve visible (set 2); Comparison of QseB (set 1) and E1 and E1 immunity (set 2); Predicted behaviour of the E9 and E9 Immunity Complex behaviour relative to E9 concentrations.
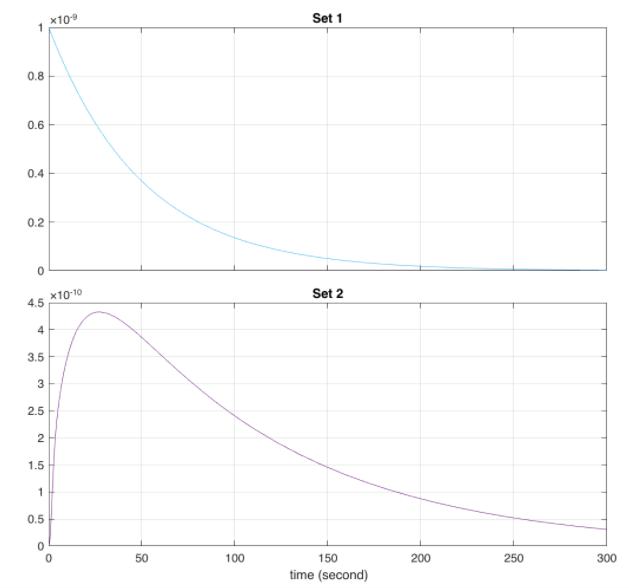
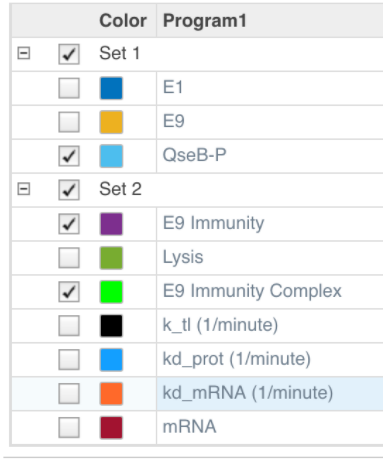
The above colour legend can be used as reference when reviewing the plots.
Discussion
The outcome of this circuit is logically consistent with what the expected outcome of the circuit. As we can see, in the presence of phosphorylated QseB transcription of the mRNA can occur which subsequently synthesizes the desired proteins. In the Absence of phosphorylated QseB no further reactions can occur.
Looking at the behaviour of the E9 and immunity complex, we can see that it is larger than the individual proteins. This is the expected result as those concentrations are accounted for in their individual degradations, complex association, and the translocation rate of the complex.
Limitations
The circuit designed above demonstrates the behaviour of a single cell. To apply this mathematical simulation and model to the application of this project, the projected output would need to be scaled by the number of cells active within the gut. Thus, the concentrations indicated here are not indicative of the concentrations that could be detected within the human body.
Furthermore, this model is limited in its accuracy as the parameters, which are the primary determinants of how the circuit responds, are values general to E. coli or similar microbial systems. Typically, these parameters would be determined experimentally.
Next Steps:
This model provides a basic understanding of how the proposed circuit functions. With further progress, this model can be improved to more accurately represent the protein behaviour in three separate compartments: inside the inner membrane, between the inner and outer membranes, and outside the cell. This added layer of complexity would yield more accurate concentrations that can then be used to determine the impact within the human body if scaled accordingly.
Furthermore, due to time constraints this circuit could not be integrated with the input circuit model. Doing this in future, would set a more accurate QseB input.
References
- Team:NCKU Tainan/Model—2017.igem.org. (n.d.). Retrieved October 19, 2021, from https://2017.igem.org/Team:NCKU_Tainan/Model
- Covert, M. (2015). Fundamentals of systems biology: From synthetic circuits to whole-cell models. CRC Press, Taylor & Francis Group.
- Doherty, K., Meere, M., & Piiroinen, P. T. (2015). Some mathematical models of intermolecular autophosphorylation. Journal of Theoretical Biology, 370, 27–38. https://doi.org/10.1016/j.jtbi.2015.01.015