Team:GCGS China/Model


1. The model of combination of Aptamer and SYBR Green I (SG)
In our experience, the successful SG fluorescence test proves the function of our aptamer, which indicates that the aptamer can specifically combine the C4-HSL and 3O-C12-HSL successfully. During the reaction, SG, a kind of DNA dye, would combine with the aptamer non-specificlly, and the AHL will combine with the aptamer that makes the SG escape from the Aptamer competitively. We can observe the excitation of the fluorescence was subsequently quenched again.
For doing a deeper research of this process, we used the model to study the mechanism and process of aptamer binding to SG, and finally get the relationship of the complex to the fluorescence value, the number of SG that 1 aptamer can bind, and the equilibrium constant of aptamer binding to SG.
After determining the target, we did the relevant experiments, where only SG and C4-HSL aptamer responded to the reaction. In the setting of the experimental system, the concentration of SG was set to 0×, 0.2×, 0.4×, 0.6×, 0.8×, and 1×. The concentration of aptamer remained constant at 100 nM. Using this experience, the fluorescence changes of different SG concentrations after binding to aptamer are understood. Meanwhile, fluorescence changes were recorded every minute during the reaction with a total of 10min, and we also can get the yield of the reaction over time.
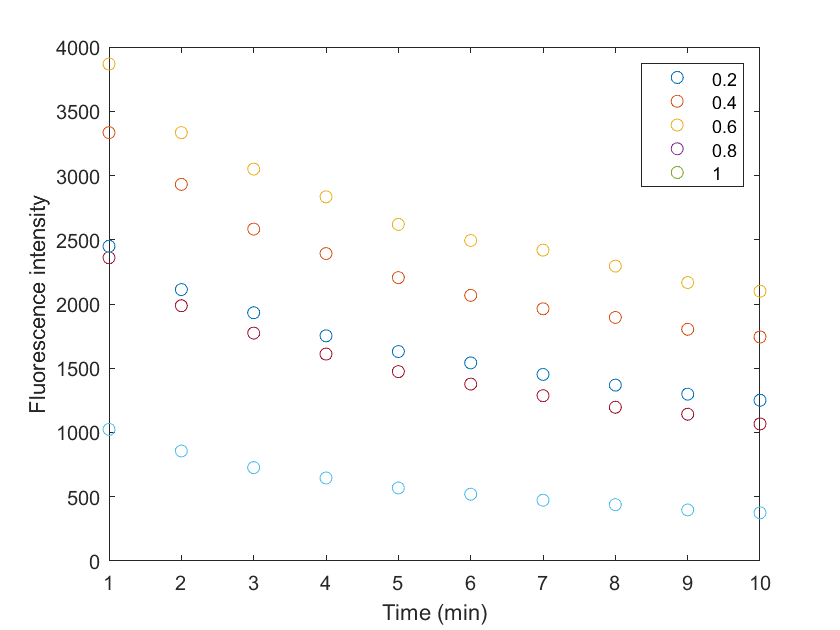
Fig 1. The fluorescence intensity caused by the binding of aptamer and SG
(Note: Different colors represent the SG concentrations of 0.2,0.4,0.6,0.8, and 1×, respectively)
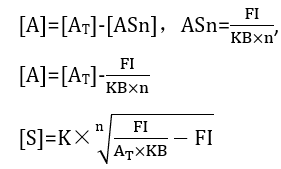
To find the principles behind the experimental results, we started with the basic reaction equations combined with the experimental data, following the detailed steps and contents of the model:
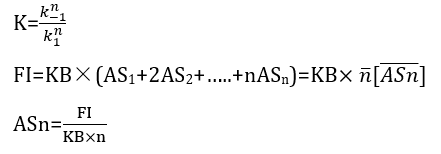
A: aptamer; S: SG; ST: Total S; AT: Total A;FI: Fluorescence intensity AS: The aptamer-SG complex
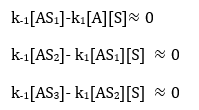
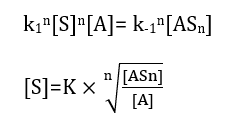
We assumed that three S in one reaction bind to A to obtain the basal reaction equation:
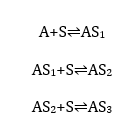
The forward reaction equilibrium constant for all three reactions is that the k1, reverse reaction velocity is k-1, at the same time, and the S resolves naturally at the velocity of γ.
We can derive expressions of the ST, AT, and FI based on the underlying reaction equations
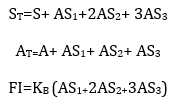
(One AS2 complex includes two S, and so on)
According to the expression, we can obtain the expressions of different substances in the system over time and obtain the differential equations:
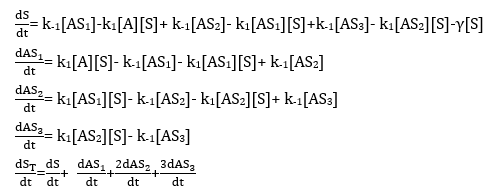
From the above aquation, we can get

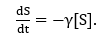
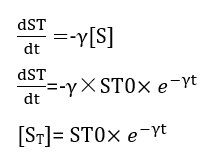
The equation of the change of S over time changing:

Based on the QSSA's theory, assuming that the first three terms to the right of the equation are about equal to 0. For the reaction takes too much quicker than -γ[S], we assume that they equal 0.
Thus,It is equal to
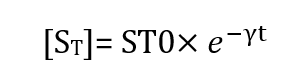
Integrating the equations of S over time:
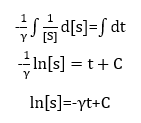
So we can get the equation of the S over time changing:
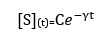
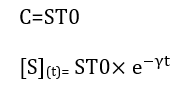
According to the data of experiment, when t=0, [S](t)=ST0 =1×SGI (1960 nM)
So we can get the final expression
Bringing the expression of S about t into the following equation:
Assume that the relationship between the AS complex and the fluorescence intensity is indicated by KB, while [AS]= [ST]-[S] we can get:
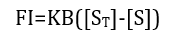
Assuming that almost no free S, in the system, all of the S has been combined with aptamer, we can get that:
According to this equation, and the experimental data, since the fluorescence intensity value is known, fitting the KB and γ in the equation using matlab and the , The fitting results was
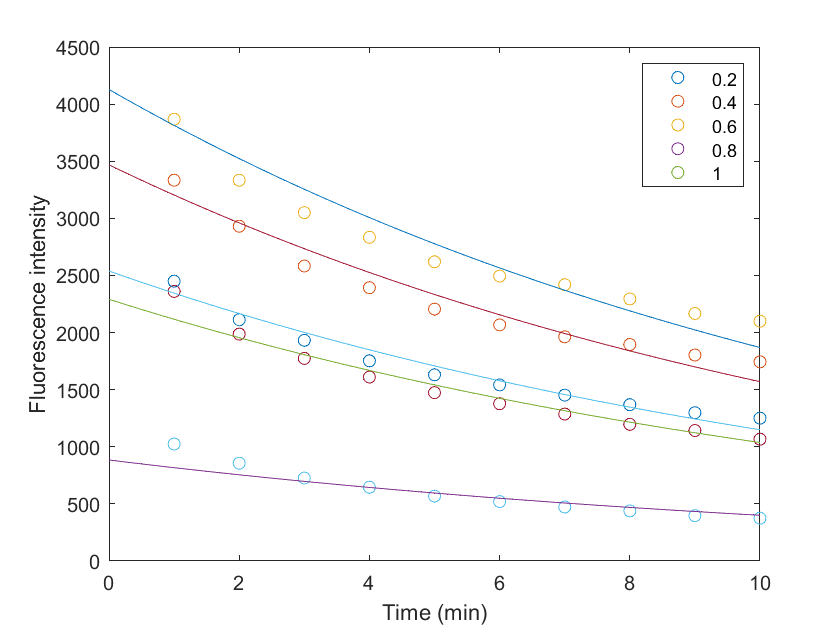
Fig 2. The fitting curve and experiment data
The original experimental data (scatter representation) and the data presented from the fitted values (curve representation) are shown in Figure 2, which shows a better fitting effect. Thus by modeling the first step, we obtain parameter values regarding the relationship between the fluorescence intensity and the AS complex, and the AS complex fluorescence fading over time.
2.Fitting of the number of SG molecules bound by Aptamer
To further fit the associated n based on the existing KB values (i. e., how many SG molecules an Aptamer will bind), since it is not known exactly what n values are, an assumption is made with the average of n and the basic reaction equation can be written as:

The rate of forward reaction is k1n , and the rate of backward reaction is k-1n, suggesting
From existing experimental data, FI is known, and from the above fitting, KB is known, we can fit the value of n using Matlab with the results as K= 2.94×10⁻¹⁸, n=36
Now we get all the value of our parameters, we can verify the fiiting effect. According the above equation:
and the results KB=2.106, γ=0.1, we can calculate the ST values at different times to obtain the theoretical ST value.
More importantly, we can further use the experimental data to calculate ST, and we can compare the two values according to the results. Next, the experimental ST data calculations process were as followed:
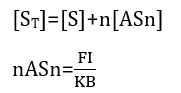
When the reaction reaches the equilibrium, we can get that:
Since K, KB as well as n values have been fitted, FI is the actual measured fluorescence value, according to Equation below:
The combination of the above two equations can calculate the experimental value of the [ST], then we ca achieve the experimental and theoretical values of the [ST] in the same figure. The horizontal axis represents the ST value obtained from the experiment and the vertical axis represents the ST value obtained from the fit.
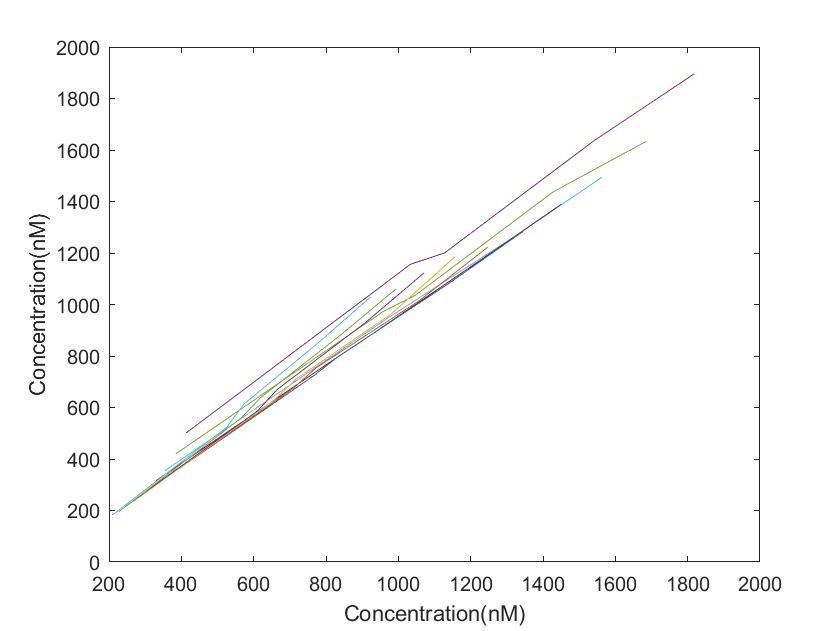
Fig 3: Fitting of the ST value
According to Figure 3, we can see that at different time points, the graph is almost all a y=x line, indicating that the theoretical derived ST value and the value of the actual ST are nearly equal.
3. Equilibrium dissociation model
In experiments on aptamer, we focused on the affinity of aptamer binding to HSL and therefore wished to obtain the kd of its binding, which is the equilibrium dissociation constant, kd represents the extent to which the complex dissociates into free aptamer and free target, thus mirrors the binding affinity of an aptamer against its target molecule. A high kd value represents a weak association of aptamer-target complex, while a low KD value represents a stronger association of the aptamer-target complex, indicating high affinity of the aptamer towards its cognate target(Thevendran et al., 2020).Based on our experimental data, where the system contains C4, SG as well as apt, we can make a fit to the kd values.
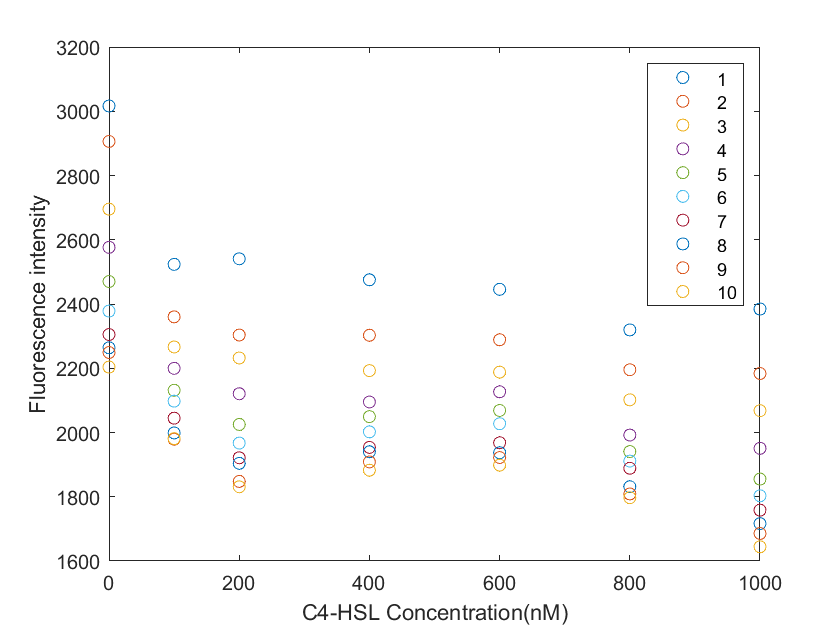
As shown in Figure 4, there is a clear decrease trend in fluorescence intensity as the C4-HSL concentration changes. The different colors represent different times, data measured at 1-10min per minute, and natural regression of fluorescence intensity.
Next follows the procedure of fitting the kd values:
HT: Total HSL; AH: apt and HSL complex AT: The total apt remaining after the apt bound to SG was removed
The basic equation is:
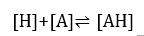
Forward reaction rate equilibrium constant k2, and backward reaction rate equilibrium constant k-2.
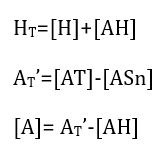
Reactions were assumed to reach equilibrium, and assumed
Also because that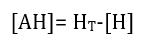
Putting this into the equation
we can get 
Converting it to 
because: [H]≥ 0, data were analyzed without HSL equal to 0
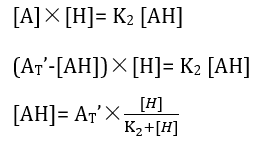
Making that 
We can solve that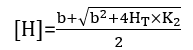
Also because 
The theoretical value of HT can be calculated by the formula:  the actual value of HT is the amounts of reactions in the system.
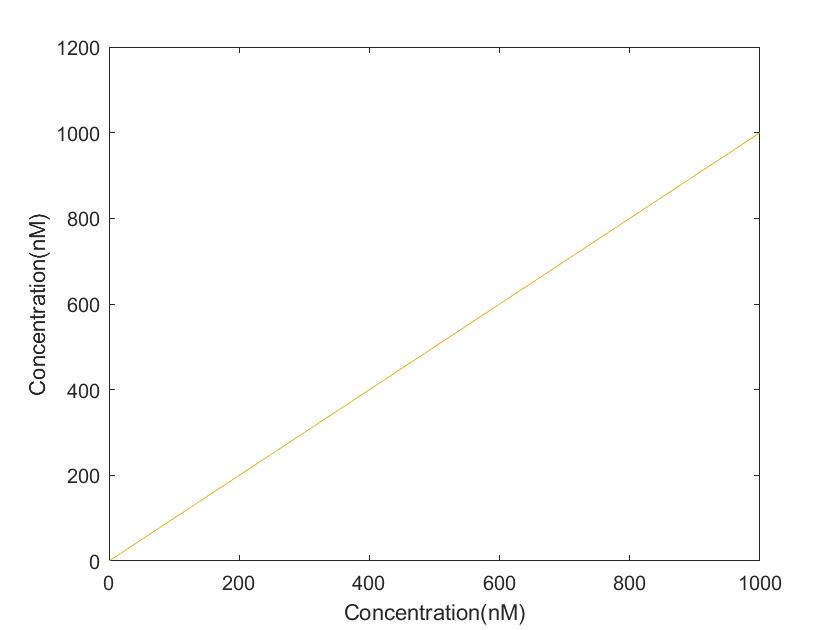
FIg 5. Fitting of the HT value
Using the matlab to fit minimize the difference between the theoretical and practical values, the fit yielded K2=21.375, namely kd=21.375. In figure 5 The abscissa represents the real HT, ordinate in the experiment in the fitting of the obtained HT. It can be seen that it is basically on a straight line of y=x, with a good fitting effect.
References:
- Thevendran, R., et al., Mathematical approaches in estimating aptamer-target binding affinity. Anal Biochem, 2020. 600: p. 113742.