Team:ZJUT-China/Model
We built a deterministic gene expression model, which takes into account the RNA polymerase ( RNAp )/ ribosome performing transcription/translation on DNA template/mRNA.

To better understand gene expression in a Cell-Free system and to assist in experimental design, we built a deterministic gene expression model. The model takes into account the RNA polymerase (RNAp)/ ribosome performing transcription/translation on DNA template/mRNA based on earlier work by Vincent N. et al.[1].
Sensitivity analysis of different biochemical parameters was performed to find the key parameters that lead to saturation of the protein synthesis rate when the concentration of DNA template is increased. By fitting the model to our experimental data, the redetermination of the strength of three untranslated regions (UTR1, UTR2, UTR3) not only assisted us to improve an existing part (BBa_K2205002) , but also helped us successfully to create a new part (BBa_K3885311).
We then used the model to explore a two-stage transcriptional activation cascade that uses E. coli \(σ^{28}\) as a transcription factor, which is a very important part of our gene circuit. In the simulations, we mathematically determined the optimal concentration of each plasmid to be added to the cell-free system, which greatly reduced our trial and error and accelerated the experimental progress.
Values of the parameters for simulations were either assumed, derived from the literature or obtained by fitting model to experimental data.
 Figure 1. (a) Schematic of mRNA and
protein synthesis in a Cell-Free system. Only the species included in the model are
shown.
Figure 1. (a) Schematic of mRNA and
protein synthesis in a Cell-Free system. Only the species included in the model are
shown.(b) Equations describing a single transcription unit regulated by σN.
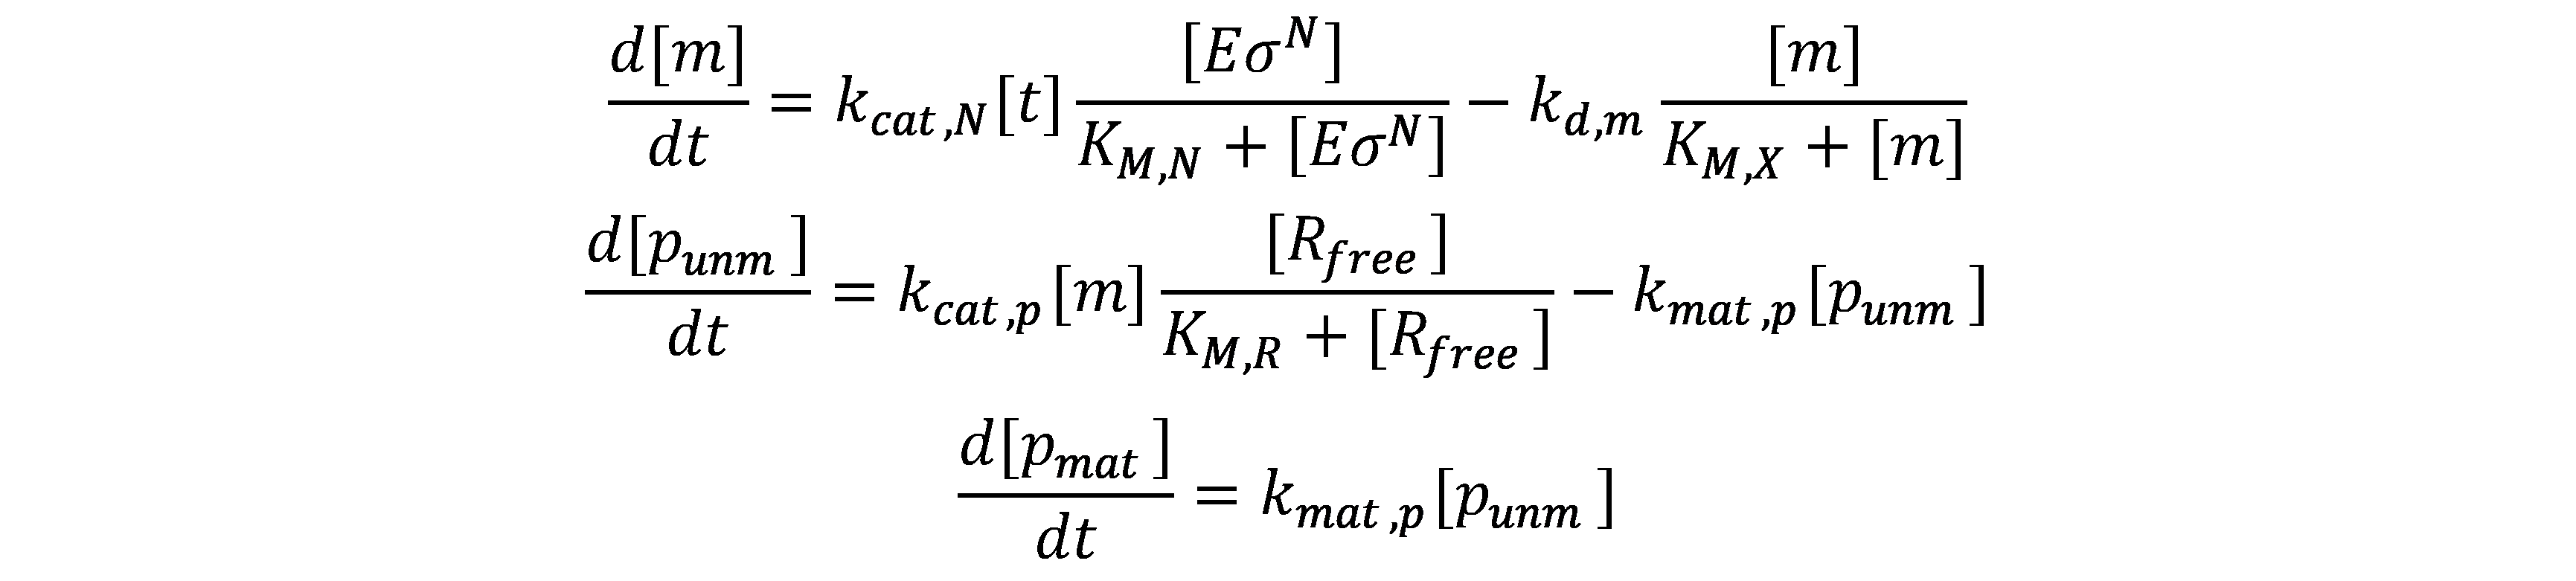
The mRNA and protein synthesis in the model comprises four basic reactions: DNA transcription, mRNA degradation, mRNA translation and protein maturation. Except for protein maturation, all other reactions are described by Michaelis-Menten kinetics.
DNA transcription

mRNA degradation

mRNA translation

Protein maturation

| Enzyme | Substrate | Product | Michaelis-Menten constant | Catalytic rate constant |
| RNA polymerase holoenzyme/ EσN | DNA template/ t | mRNA/ m | KM,N | kcat,N |
| RNase/ X | mRNA/ m | null | kM,X | kdeg,m |
| Ribosome/ R | mRNA/ m | Protein/ p | kM,R | kcat,p |
Why don't we include protein degradation in the model?
The degradation of protein in the Cell-Free system is achieved by endogenous ClpXP protease, following a zeroth-order kinetics. ClpXP recognizes proteins with the degradation tag ssrA and hydrolyzes them. For proteins without ssrA degradation tags, it is almost stable in the Cell-Free system. This was confirmed by one of our experiments: we added purified eGFP to a Cell-Free system and continuously measured its fluorescence intensity.
- The Cell-Free system is under quasi-steady state for Michaelis-Menten kinetics.
- The substances required for gene expression are in unlimited supply.
- The only sigma factor present in the cell extract is σ70
- The concentration of DNA template (t) is lower than the concentration of RNAp holoenzyme (EσN)
- The concentration of synthesized mRNA (m) is larger than the concentration of RNase (X).
- The concentration of synthesized mRNA (m) is lower than the concentration of ribosomes (Rfree).
- The maturation of protein (punm) follows a first-order kinetics.
This was verified by a crosstalk assay, which concluded that all of the alternative sigma factors are either not present in the extract or are present at insufficient concentrations to activate specific promoters[4].

 In the latter, kdeg,m[X] is replaced by
kd,m.
In the latter, kdeg,m[X] is replaced by
kd,m.

The maturation time of deGFP has been well determined[1]. For simplicity, we assume that the maturation of the protein follows a first-order kinetics.
With these assumptions, the kinetics of mRNA and protein synthesis is described as following:
Sigma factor
Every sigma factor has two forms: free (\(σ_{free}^N\)) or complexed with core RNAp (\({E\sigma}^N\)).

Core RNAp
In the presence of a single sigma factor species, core RNAp has three forms: free (\(E_{free}\)), complexed with sigma factor (\({E\sigma}^N\)) or performing transcription on DNA template (\(E_{tx}\)).

Ribosome
Ribosome exists in two forms: free (\(R_{free}\)) or performing translation on mRNA (\(R_{tl}\)).

- The concentrations of transcription and translation machinery remain constant.
- The binding between sigma factor and core RNAp is a fast biochemical reaction.
- The length of the transcribed gene is \(L_m\).
- The core RNAp which performing transcription on DNA template moves forward along the DNA template at a constant rate (TX).
- Dividing this equation by the elongation rate constant of core RNAp (TX), we obtain the concentration of the core RNA polymerase that is synthesizing the mRNA:
- The ribosome which performing translation on mRNA moves forward along the mRNA at a constant rate (TL).
This is the prerequisite for building conservation equations for sigma factor, core RNA polymerase and ribosome.
This keeps the following biochemical reaction in equilibrium with the dissociation constant \(K_N\) all the time.

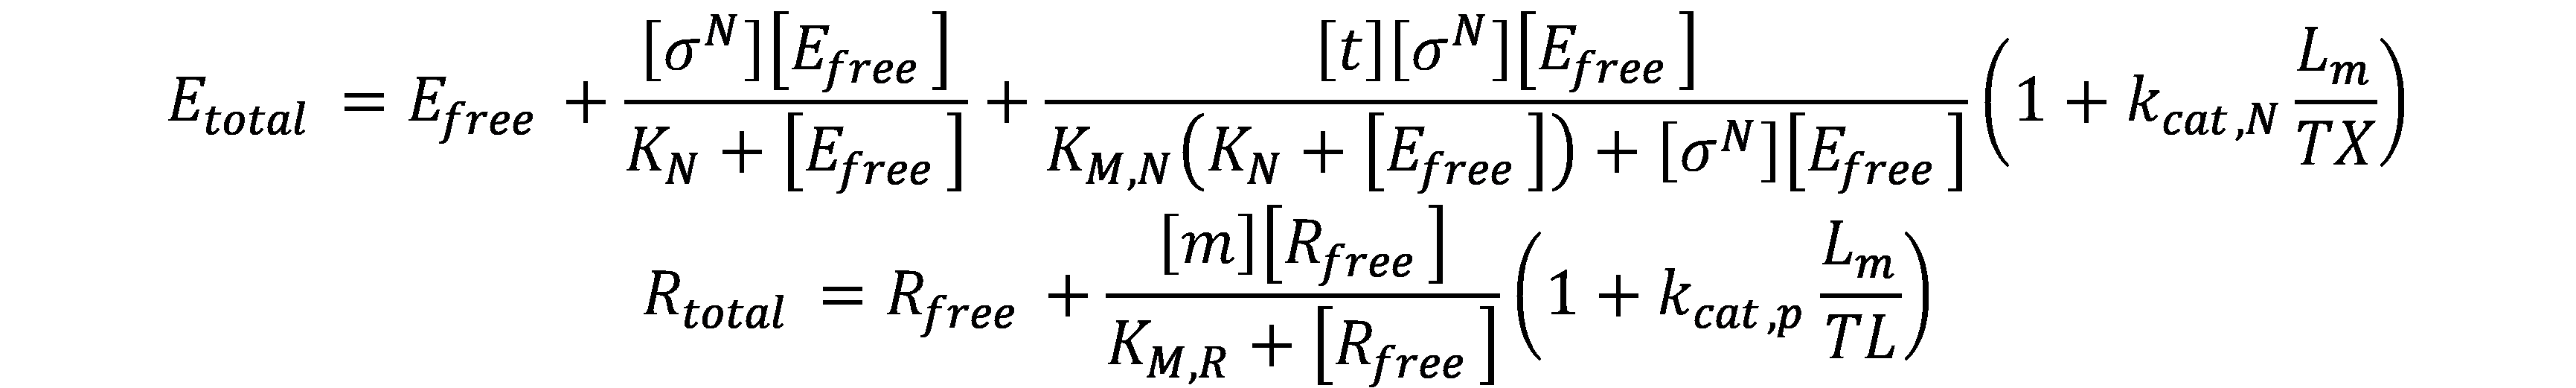
Thus, the concentration of RNAp holoenzyme is found to be

The rate of mRNA synthesis is given by

which indicates that the total number of bases per second that core RNA polymerase moves along the DNA template is


Considering the RNA polymerase bound to the promoter, the concentration of core RNAp performing transcription on DNA template (\(E_{tx}\)) is given by

Proceed in a similar manner, the concentration of ribosome performing translation on mRNA (\(R_{tl}\)) is given by

Using these assumptions, we get the conservation equations for core RNAp and ribosomes:
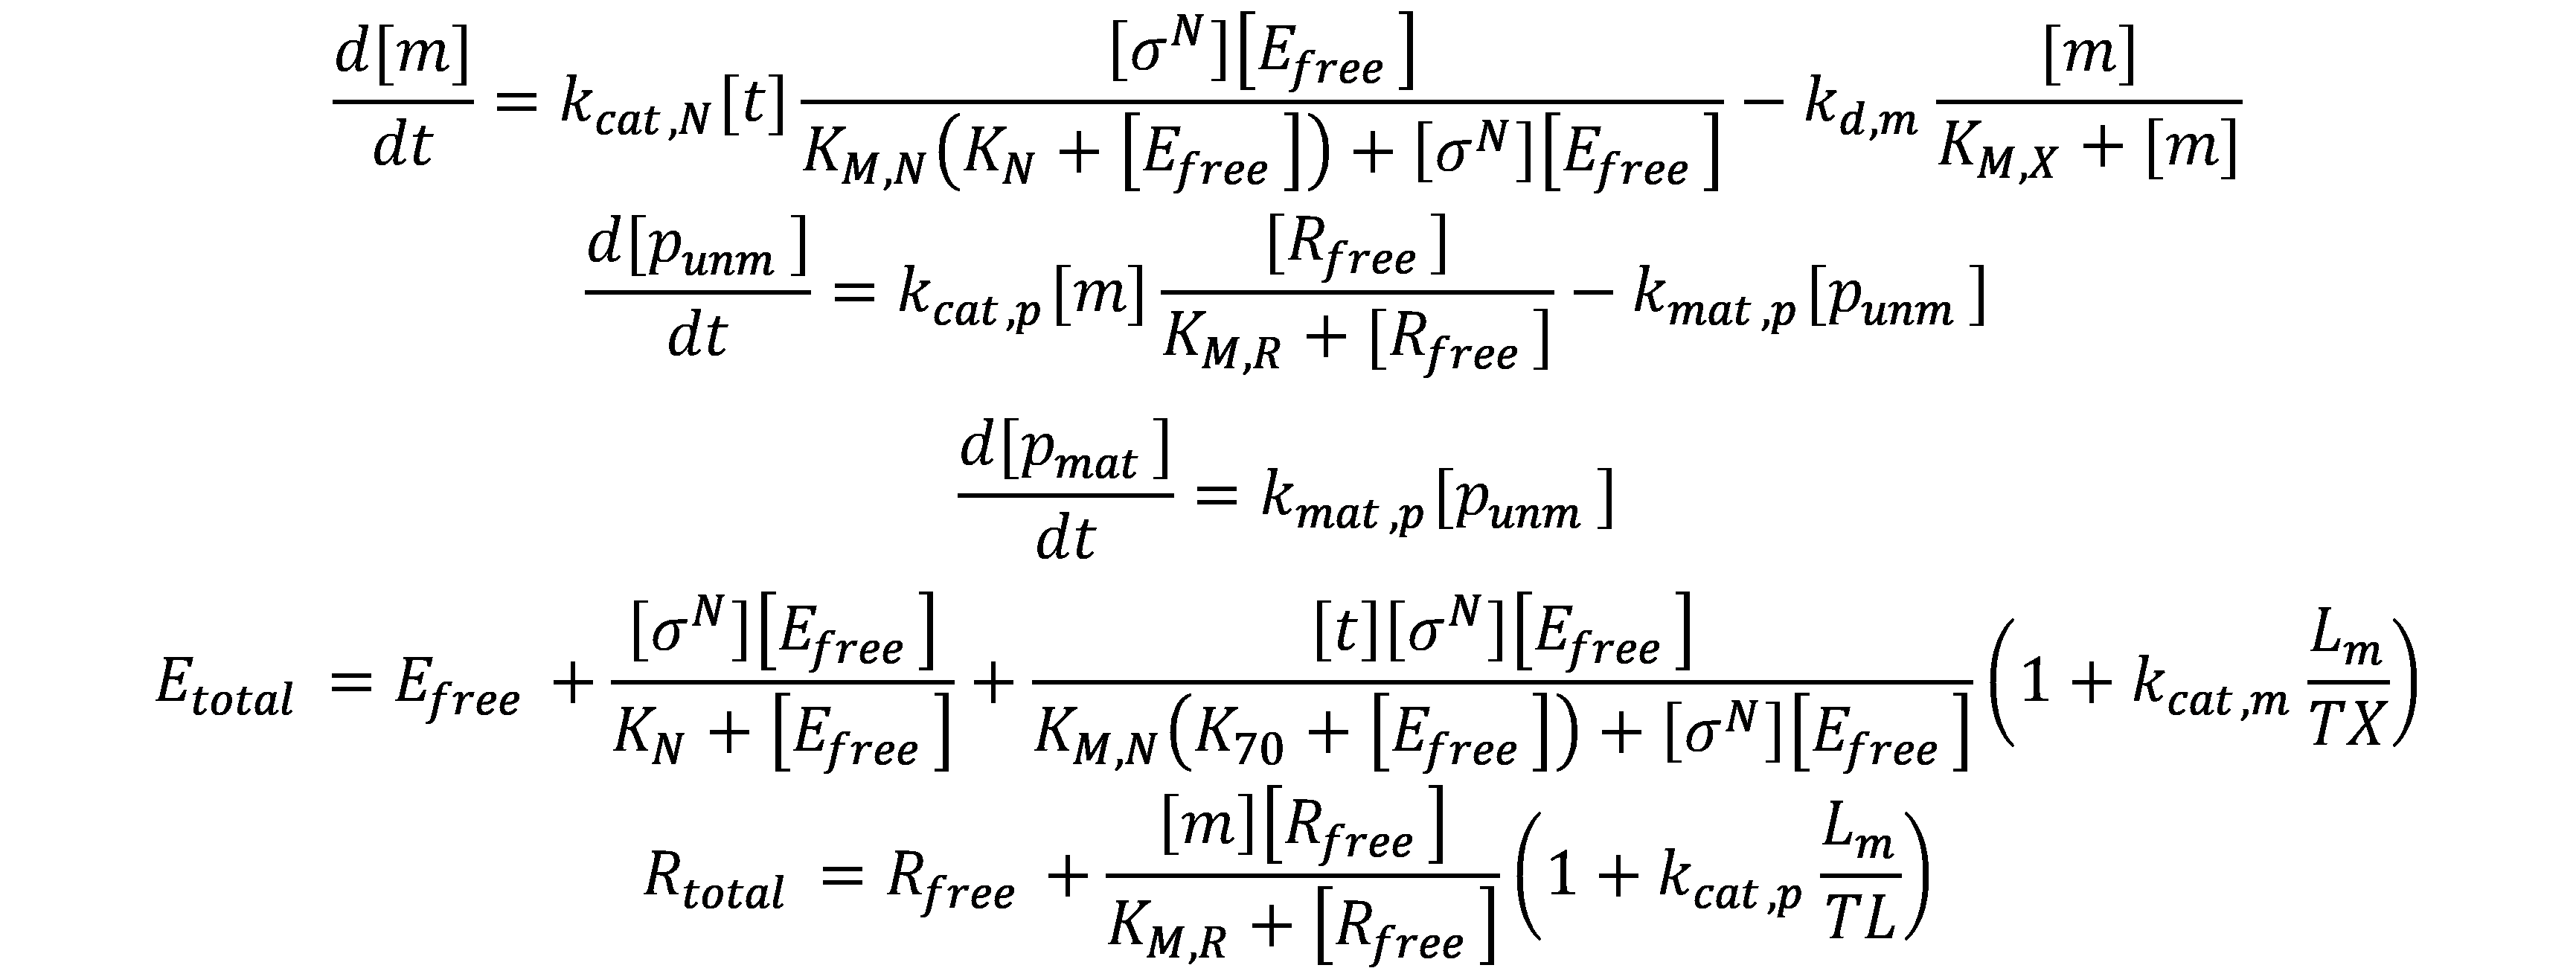
Combining the above two parts of equations, we obtained the set of equations describing the gene expression of a single transcription unit:
Since the model takes into account the consumption of RNA polymerase and ribosomes during transcription and translation, there is a theoretical maximum for the rate of protein synthesis. To find the key parameters that limit the maximum rate of protein synthesis as the concentration of DNA template increases, we tested the sensitivity of the model by varying the value of each biochemical parameter. The biochemical constants of P70a-UTR1-deGFP were used as original inputs[1].
In our simulations, high sensitivity is observed only when varying \(k_{cat,N}\), \(k_{d,m}\), \(R_{total}\), and \(k_{cat,p}\). However, changes in \(k_{cat,N}\) and \(k_{d,m}\) only affect how quickly the output saturates as the DNA template concentration increases, and do not increase or decrease the value at which the output saturates. Therefore, we consider \(R_{total}\) and \(k_{cat,p}\) as the key parameters that leading to the saturation of protein synthesis rate, especially \(R_{total}\).

Based on the model of single transcription unit, we explored the performance of the two-stage transcriptional activation cascade. The two-stage transcriptional activation cascade consists of two transcription units, one of which encodes an alternative sigma factor required to activate the other.
 Figure 4. Schematic of a two-stage
transcriptional activation cascade using E. coli \(\sigma^{28}\). The untranslated
region of both single transcription units is UTR1.
Figure 4. Schematic of a two-stage
transcriptional activation cascade using E. coli \(\sigma^{28}\). The untranslated
region of both single transcription units is UTR1.
The system of equations describing the cascade P70a-UTR1 -σ28\(\rightarrow\)P28-UTR1-deGFP is as follows:

RNA biomarkers can be detected by our Cell-Free biosensor. The measurements, experiments, and hardware testing demonstrated that without RNA biomarker, the fluorescence intensity was significantly lower than with the RNA biomarker that was present. As a result, we have demonstrated the feasibility of our concept. Moreover, the RNA biomarker concentration is related to the sensitivity of the biosensor, but we do not have much more time to test this attribute, so we put forward a plan for the next step.
Currently, the strongest expression of single transcription unit in the Cell-Free system is delivered by combining the strongest promoter (P70a) with the strongest UTR (UTR1) reported so far. P70b and P70c are derived from the P70a mutation (strengths: P70a > P70b > P70c), and UTR2 and UTR3 are derived from the UTR1 mutation (strengths: UTR1 > UTR2 > UTR3)[2]. By changing the combination of promoter and UTR, the expression of single transcription unit can be adjusted to appropriate strength. The catalytic rate constant of these promoters and UTRs has been well determined[1].
Before characterizing these nine combinations in the laboratory, we first simulated the expression of P70a-UTR1-deGFP in a Cell-Free system.
Although we used the same Cell-Free system as in Vincent N. et al. (myTXTL kit from Arbor Biosciences), a large deviation between experiments and simulations was observed. Considering that the reference was published in 2019, we attribute this deviation to differences in the concentration of transcriptional and translational machinery in Cell-Free systems (the quality of myTXTL kit may have improved).
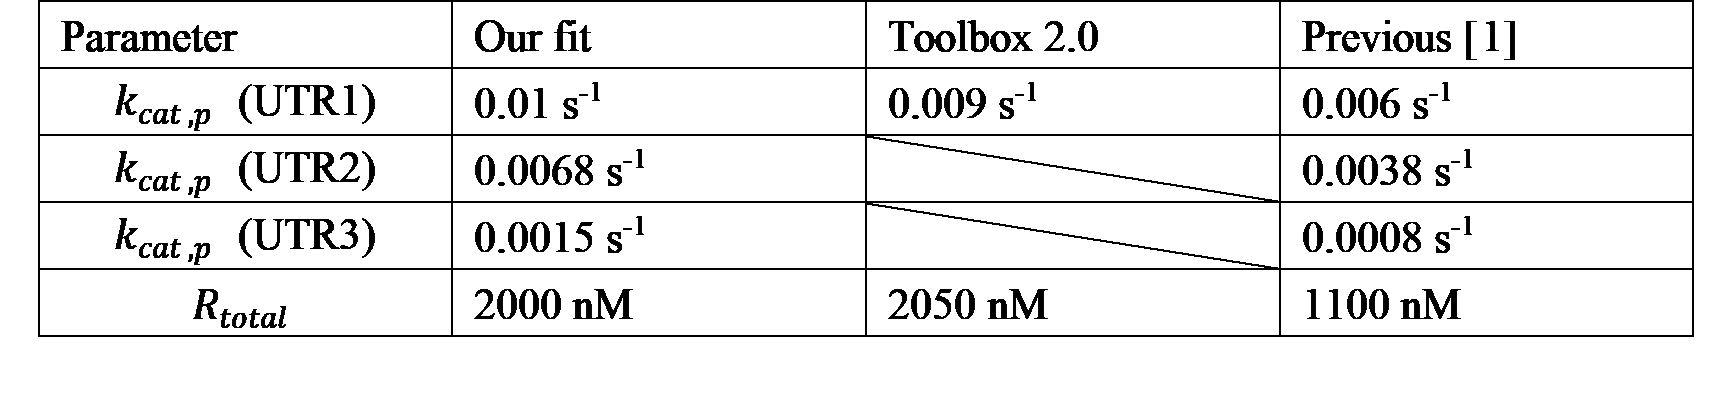
Sensitivity analysis showed that the model is most sensitive to \(k_{cat,p}\) and \(R_{total}\). So, we redetermined \(k_{cat,p}\) and \(R_{total}\) by fitting the model to our experimental data and the data from The all E. coli TXTL Toolbox 2.0[2]. We found that the total concentration of ribosomes and the catalytic rate constant of UTR1 were about twice as high as in the literature.
We also characterized the other eight combinations. We then fit the model to our experimental data and redetermined \(k_{cat,p}\) rates for UTR2 and UTR3, respectively.
This transcriptional activation cascade consists of two single transcription units: P70a-UTR1-σ28 encoding for the transcriptional factor and P28-UTR1-deGFP encoding for the reporter protein. To explore the performance of the cascade, we made the following assumptions:
- \(K_{28}=0.74\ nM\)
- \(K_{M,28}=1\ nM\)
- \(L_{m_{\sigma^{28}}}=800\ bp\)
- \(k_{cat,28}=0.021\ s^{-1}\)
- The value of \(k_{mat,\sigma^{28}}\) should be significantly larger than \(k_{mat,deGFP}\).
The dissociation constant for \(\sigma^{28}\) binding to core RNAp was obtained from reference[3].
Because the model is insensitive to \(K_{M,28}\), we set the value of \(K_{M,28}\) to be the same as \(K_{M,70}\).
The length of transcribed gene of \(\sigma^{28}\) is similar to that of deGFP, 800 bp was taken for simplicity.
P70a-UTR1-deGFP reaches its maximal protein synthesis rate at 5 nM. For optimal expression, P70a-UTR1-σ28 and P28-UTR1-deGFP should be set at 0.5 nM and 15 nM, respectively. Due to the low concentration, we assume that P70a-UTR1-σ28 provides sufficient σ28 without depleting the transcriptional and translational machinery. Thus, the maximum protein synthesis rate of P28-UTR1-deGFP saturates at 15 nM.
P70-UTR1-deGFP reaches its maximal protein synthesis rate at 5 nM. So, we consider the value of \(k_{cat,28}\) to be about one-third of \(k_{cat,70}\):

The \(\sigma^{28}\) is necessary for flagellar biosynthesis and chemotaxis in many bacteria. A slow maturation rate will prevent efficient regulation of gene expression.
By fitting the model to the data from The all E. coli TXTL Toolbox 2.0, the protein maturation rate constant \(k_{mat,\sigma^{28}}\) is found to be 0.16 s-1 (two hundred times faster than deGFP), which confirms our assumption.

A complex gene comprises multiple single transcription units. Each single transcription unit interacts with the others to affect the output of the system as a whole. Any change in plasmid concentration will interfere with the performance of the system. Therefore, it is crucial to determine the optimal concentration of plasmids for the experiment.
Simulations based on experimental data will provide design considerations for experiments. To ensure that our gene circuit function properly in a Cell-Free system, we need to set each plasmid at the appropriate concentration. The saturation concentration of P28-UTR1-deGFP in the Cell-Free system is 15 nM. In our experiments, we set it to 10 nM in order not to affect the expression effect of other plasmids. To achieve optimal deGFP expression, we need to redetermine the concentration of P70a-UTR1-σ28. By varying the concentration of P70a-UTR1-σ28, we simulated the expression of deGFP and found that deGFP could be maximally expressed when P70a-UTR1-σ28 was at 2 nM. Eventually, we characterized this cascade in the laboratory and found that the data matched the simulation well.
Our model describes gene expression of a single transcription unit in a Cell-Free system and explores the performance of a two-stage transcriptional activation cascade. By performing sensitivity analysis of the model and fitting the model to experimental data, we are convinced that the maximum rate of protein synthesis in Cell-Free systems is mainly limited by the translation process.
By fitting the model to our experimental data, we redetermined the strength of UTR1, UTR2 and UTR3. In addition, we provide reference values for the strength of P28 and the maturation rate of σ28. We hope that this model will provide experimental design considerations for future iGEM teams who will use Cell-Free system in their projects.