Team:XJTLU-CHINA/Proof Of Concept

Loading...
Proof-Of-Concept
Overview
In our engineered phage detection system, we need to prove there is a positive relationship between the output of LuxR and input of bacteria so that we can use the output of LuxR to quantify bacteria.
To verified the bistable semi-quantitative system, there are 4 aspects to be tested by either wet-lab experiment or dry-lab modeling: the specific parameters of the S-curve, the right-shifting of the S-curve, the RepA-tagged the degradation, and the binary signal output.
Finally, a whole-system simulation was performed to provide evidence for overall verification of the project.
Engineered-Phage Detection System
Positive Correlation Between the Output of LuxR and Input of Bacteria
From the simulations of our model, we observed our engineered T4 phage can infect the bacteria and produce LuxR whose number positively correlated to bacteria number in the system. However, this positive correlation only exists when the multiplicity of infection (MOI) of the whole detection system is larger than 7 (figure 1). Based on these results, we could maintain a positive relationship between input bacteria and output LuxR by regulating the initial feeding number of phages. (For more characteristic descriptions of this model, please see our modeling page.)
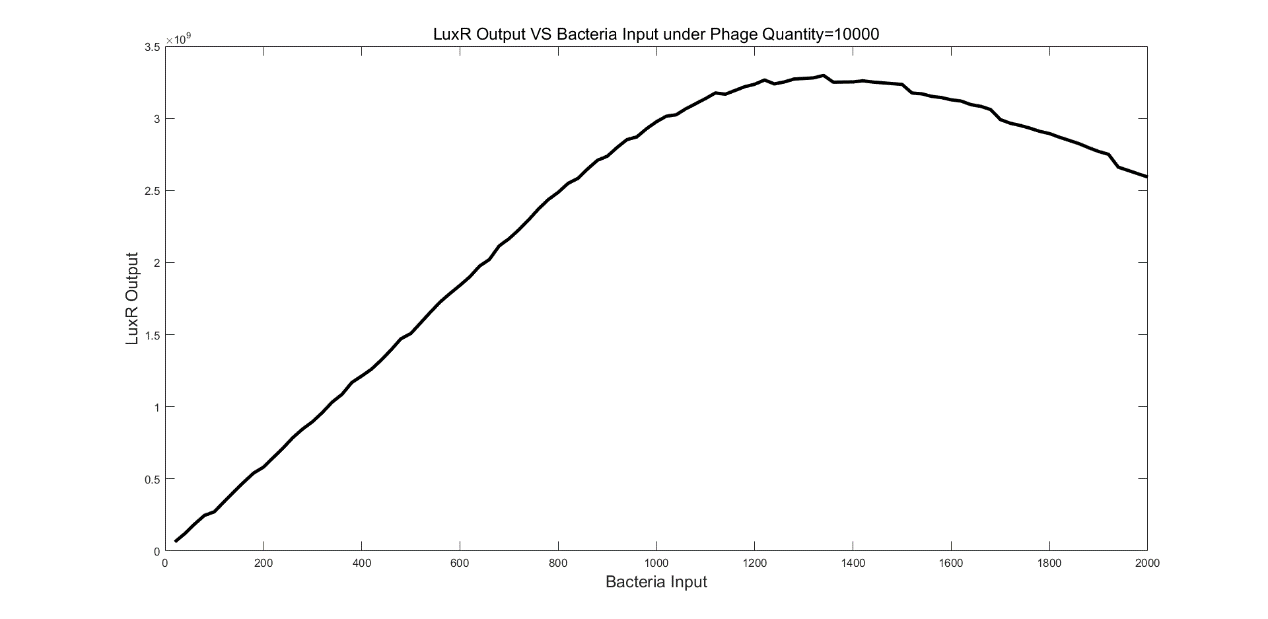
(Figure 1. LuxR Output VS Bacteria Input under Phage Quantity=10000)
Bistable Semi-Quantitative System
Parameters of the S-Curve

(Figure 2. A. The S-curve measured by dilution series experiment of LuxR-induced eGFP expression. B. The eGFP standard curve of its fluorescence intensity-concentration.)
The most important component of our bistable system is the sigmoidal-shape curve (S-curve); its conformation plays a dominant role in the threshold position and the fluorescence intensity at the higher equilibrium.
According to the experimental data, the switch point of the S-curve of the dose-response eGFP expression rate is ~2.77μM; the leakage or lower plain is ~0.046μM/min and the plateau is ~1.045μM, displaying a 22.7x difference between lower and higher plains.
Right-Shifting of the S-Curve

(Figure 3. A. The real-time fluorescence accumulation curve.)
The right-shifting of the S-curve is essential in system optimization. The experimental data demonstrated indicate high inhibitory effect of the promotor. The data of the inhibitor-positive set with 20μM of LuxR comparing to that of with the 5μM verified the proposal that the inhibitory effect can be counteracted by increasing the LuxR concentration derived from the modeling.

(Figure 4. The prediction of the counteraction by concentration increase to the inhibitory effect.)
Further experiments are needed to test the LCM situation (see Engineering and Modeling for more details).
Degradation

(Figure 5. The curve of in vivo degradation of RepA-eGFP)
Degradation is another core component in the bistable system. The qualitative tests in vivo confirm the degradation induced by N-terminal RepA tagging. In vitro experiments and gradient test of ClpAP concentration- degradation rate is still needed for the investigation of the specific parameters of enzyme kenetics.
Binary Signal Output

(Figure 6. The simulation of DBV bistable system with visible fluorescence signal at the positive state with the threshold between 1.6 and 1.7μM LuxR.)
The output of the bistable system is verified by the simulation of the DBV bistable system. The concentration above 1.6μM LuxR all induced high expression of eGFP and exceeded the assumed visible intensity by ~150min. (See Engineering and Modeling for details)
Whole-System simulation

(Figure 7. The whole-system simulation with bacteria input of 300, 500, 700, 960, 1000, 1040 1300, 1500, 1700 MPN/g.)
The whole-system modeling used the correlation between LuxR output and bacteria input under Phage Quantity=20000, to detect bacteria in 200g food slurry, with the recovery time that gives the bacteria a 10x rise in number; the resulting LuxR were input directly into a system with 66.7μg/mL and 0.45μM ClpAP. The convergence of the curves indicates visible fluorescence signals at the “positive state” and a threshold around 1000MPN/g.
