Team:XJTLU-CHINA/Engineering

Loading...
engineering
Overview
According to the demands derived from our HP research, we need to construct a fast semi-quantitative system that can detect live bacteria and output simple visible signal indicating whether the bacteria number meets a certain standard.
We divided the system into two sections: the engineered phage detection system and the signal output bistable system. These two sections were iterated by series of feedback loops between wet-lab experiment and dry-lab modeling.

Upstream
Reasons for using phage to detect foodborne microbes
Food products contaminated by bacteria pose a serious challenge to the food industry as well as a high risk to people (Schmelcher and Loessner, 2014). Despite advanced control methods and increasing of public awareness, the development for novel detection methods is still significant and essential (Schmelcher and Loessner, 2014).
Currently, the conventional bacteria culturing is the golden standard for the foodborne detection. However, the major disadvantage of this kind of method is time-consuming and laborious, which usually needs 48h to 72h (Schmelcher and Loessner, 2014). Especially in the outbreak of foodborne diseases, the drawback will be magnified. Also, lots of culture-independent approaches have been applied to practical diagnose, such as different kinds of polymerase chain reaction (PCR), immunological methods and mass spectrometry (Schmelcher and Loessner, 2014). Although these methods have shortened the detection time, improved the detection efficiency, the existing detection methods also face some challenges, for example, none of them can effectively distinguish between dead and living bacteria and viable (Meile et al., 2020). Moreover, the high cost of antibody production and expensive instrument remains a difficulty for detection.
Currently, the conventional bacteria culturing is the golden standard for the foodborne detection. However, the major disadvantage of this kind of method is time-consuming and laborious, which usually needs 48h to 72h (Schmelcher and Loessner, 2014). Especially in the outbreak of foodborne diseases, the drawback will be magnified. Also, lots of culture-independent approaches have been applied to practical diagnose, such as different kinds of polymerase chain reaction (PCR), immunological methods and mass spectrometry (Schmelcher and Loessner, 2014). Although these methods have shortened the detection time, improved the detection efficiency, the existing detection methods also face some challenges, for example, none of them can effectively distinguish between dead and living bacteria and viable (Meile et al., 2020). Moreover, the high cost of antibody production and expensive instrument remains a difficulty for detection.
Reasons for choosing and editing T4
The main reason for us to utilize bacteriophage T4 for detection is that T4 is a well-researched model organism and it can specifically infect generic E. coli cells, such as E. coli K12 and E. coli B (Miller et al., 2003, Tanji et al., 2004). Meanwhile, the safety level for these microorganisms is BSL-1 and we can manipulate them in our laboratory with low risk. Therefore, we chose to use T4 as our model bacteriophage to demonstrate our detection methods.
The reason for us to engineer our T4 because we needed an output signal from bacteria to our downstream bistable system. This signal molecule needs to be distinguished from bacteria proteins and its production is positively correlated with the number of bacteria. Therefore, we came out that we could engineer LuxR protein on T4 phage and produce the LuxR with the infection cycle of T4. Meanwhile, the produced LuxR can activate our downstream gene circuit in cell-free system.
Reasons for choosing target gene to edit
In order to release LuxR as much as possible and to minimize the safety concerns for human and ecology, we decided to place a strong RBS before the coding gene of LuxR and insert LuxR into an essential gene of T4 phage. In the end, we chose the gene of major capsid proteins, gp23 and gp24 as our candidate genes. These genes do not involve in the process of infection and lysis, as well as DNA replication and transcription. In addition, they do not contain overlapping coding sequence and the length of them are relatively suitable to be expressed on the plasmid. T4 with the deletion of gp24 in genome had shown no difference in infection process compared to wild type T4 (Tétart et al., 1996).
Methods for engineering phage
At the beginning of the project, we explore many methods to edit our phage T4. Currently, there are mainly serval ways to engineer bacteriophage: direct cloning from the phagemid, homologous recombination, synthetic genome rebooting (Brown et al., 2017, Meile et al., 2020). However, the editing efficiency in prior works to engineer phages is even lower than 0.05% (Duong et al., 2020). Due to the large and modified genome of T4, we needed to find a method to edit phage genome with relatively high efficiency.
We found that CRISPR/Cas9 system may be a feasible method for us to engineer T4. Duong et al. (2020) described that using CRISPR/Cas9 system can achieve a extremely high genome editing efficiency in T4. We also found that the components for constructing CRISPR/Cas9 is relatively available compared to other methods. Thus, we decided to apply CRISPR/Cas9 system to edit our T4.
To engineer bacteriophage T4 that infect E. coli BL21 (DE3) and output LuxR proteins which is positively correlated with the number of bacteria for the activation of downstream gene circuit. Also, our engineered phage cannot produce generations due to lack of essential capsid protein for biosafety.
We would use CRISPR/Cas9 system to insert LuxR into essential capsid protein gene, gp23 or gp24.
We expected our CRISPR/Cas9 systems could work and engineered phage could meet our design purposes.
We planned to build the crRNA cutting part and homologous recombination part and regulation of Cas9 expression part separately, which would be assembled finally to create our engineered phage.
Therefore, we applied inner DBTL cycles inside the build part of EPDS.
Design 1
We’d like to identify potent crRNAs to cut phage capsid gene.
We designed crRNAs for gp24 using Geneious Prime and adopted the crRNA for gp23 from literature (Yaung et al., 2014). We would perform phage plaque assay to test them in BL21 with pCas9 (Addgene. No. 48276) (Figure 1).

(Figure 1. the plasmids used for test the crRNA cutting efficiency. Here we used 7 different crRNAs targeting two different genes.)
If cut, the efficiency of plating would be very low, which meant a potent crRNA. The cutting would lead to the deficiency of capsid protein, which there is no plaques formed.
Build 1
We used BasI to assemble our crRNAs on to the pCRISPR backbone (Addgene. No. 48275). We used electroporation to transform pCRISPR-crRNA and pCas9 plasmids into E. coli. We selected the transformants growing on the kanamycin and chloramphenicol and amplificated these transformants for phage plaque assay.
Test 1
We calculated the EOP for different crRNAs. We disappointedly found that 6 crRNAs designed for gp24 were all failed to cut the T4 gene in vivo, and the EOP was around 1.
However, the crRNA for gp23 was very potent whose EOP was about 2x10⁻⁸. (See our result)
Learn 1
We learned that the cutting of phage genome is difficult due to the hydroxylmethylated and glucosylated-modification of cytosine in genome, making it hard for Cas9 to recognize (Tao et al.) but we were not sure that whether the failure of cutting was our mistake in designing crRNA or the modification of genome.
Therefore, to verify our design of crRNA for gp24 had no faults, we decided to transform pCRISPR-crRNA to the cell with gp24 gene. Meanwhile, because we found crRNA for cutting gp23 was efficient, we consider it was feasible to be used in the verification of the regulation of Cas9 expression in vivo, also in the editing of phage in our final CRISPR/Cas9 system.
Moreover, its high efficiency would help us select our mutant phage because it could cleave out the phages with complete gp23 but excluding our mutant phage with the deficiency in gp23. More importantly, the result of deficiency in gp23 ensured the incompetence of phage to produce generations, which partially supported our consideration of biosafety about our engineered phage.
Design 2
Our goal for the second inner DBTL cycle was to verify the expression of Cas9 can be regulated through RhaB promoter so that we could protect our complimentary gp24 gene on the plasmid from cutting by newly formed CRISPR/Cas9 complex. Thus, we decided to perform both in vivo and in vitro experiments to verify if the cutting efficiency was different due to the different expression level of Cas9 in media supplied with different kinds of sugar performed in the bacteria with pCRISPR-gp23 and pRhaB-Cas9 shown in figure 2.

(Figure 2. the plasmids we used for the regulation of Cas9. Here we use crRNA for gp23.)
Second purpose was to verify the efficacy of the crRNAs for gp24 failed in in vivo test, which we planned to do some experiments inside bacteria with both CRISPR-Cas9 system and gp24 gene (Figure 3).

(Figure 3. the plasmids used for in vitro test of crRNA cutting efficiency. Here we used crRNA1, crRNA2 and crRNA3 and an empty pCRISPR backbone.)
We expected the expression of Cas9 was higher when adding L-rhamnose into the culture media compared to the media without any sugar or adding glucose. In addition, we expected to see the expression of gp24 and Cas9 both are low when crRNAs exist, which indicated the cutting of plasmid because gp24 and Cas9 genes were on the same plasmid.
Build 2
We first change the tet promoter on pCas9 into rhaB promoter in the original pCas9 backbone. We did not add further rhamnose operator-related genes because our plasmid size was already large and adding further genes would have increased the load. Moreover, according to the literature and our alignment in BLAST, rhamnose operator-related proteins are also present in BL21 (DE3) which can be used to initiate the rhamnose promoter sufficiently (Wegerer et al., 2008). Also, we assembled gp24 gene on the prhaB-Cas9 plasmid, which would be further applied in our final CRISPR/Cas9 system and in the verification of crRNA cutting inside bacteria. The expression of gp24 gene can be regulated by T7 promoter. Adding IPTG can activated the production of T7 polymerase in BL21 and activates T7 promoter.
Test 2
We performed phage plaque assay to verify the Cas9 expression in different sugar media in the bacteria with pCRISPR-gp23 and prhaB-Cas9. We did not observe significant difference between the group induced by L-rhamnose and the group induced by D-glucose, or with no inducer. All plates had extremely low EOP, which meant the efficient cutting of genome. Therefore, we further performed the qPCR to examine the exact difference between Cas9 expression. However, to our surprise the result was contradict to our hypothesis that adding rhamnose could turn on the RhaB promoter. Our rhamnose promoter was not regulated by rhamnose and the expression of Cas9 was even lower in the rhamnose group than in the control group. In other words, addition of rhamnose inhibited Cas9 expression instead.
We also performed qPCR for the cells with pCRISPR-crRNA1& prhaB-gp24-Cas9, pCRISPR-crRNA2 & prhaB-gp24-Cas9, pCRISPR-crRNA3 & prhaB-gp24-Cas9 and pCRISPR & prhaB-gp24-Cas9, to verify the in vitro cutting. The results indicated our crRNA1, crRNA2 and crRNA3 had the ability to cut the gp24 gene on plasmid, with crRNA 1 being the most effective.
Learn 2
We learned that regulation of the Cas9 expression through RhaB promoter is not suitable due to some unknown problems. Because our aim is to protect gp24 from cutting, we should apply a codon optimization approach in the future.
Moreover, our design of crRNA might not have functional problem. Thus, the difficulty for choosing potent crRNA for T4 phage remains discussing.
Although we had the order from Genscript to construct our Donor plasmid based on the pCRISPR backbone that had two homologous arms for gp24 each around 1000bp shown in figure 4, which was demonstrated to have high homologous recombinant efficiency (Tao et al.), and our LuxR between them, we failed to test its functions due to the lack of time and the outbreak of COVID-19. Therefore, it was a pity that we failed to test the characteristic of our engineered T4 due to the unsuccessful construction of Donor plasmids.
If we had had more time, we would have verified the successfully engineered phage by PCR amplification of LucR-gp24 gene fragment and tried to extract the LuxR protein through His-tag. Moreover, we also planned to replicate our engineered phage through infection of the E. coli with our CRISPR/Cas9 system.


Recently, one research group found that the CRISPR-Cas12 system may overcome the difficulty of editing the modified genome of T4 (Dong et al., 2021). Therefore, maybe in the future, we could apply this new technique to edit T4 more efficiently.
To accomplish our design for our engineered phage, we came out the idea to simulate the protein expression of our phage in silico, which come into our second iteration of our EPDS.
Design
Due to the difficulty in experiment, we’d like to simulate a model which can predict the relationship between bacteria number and LuxR output.
In simulation we considered the mechanism of protein gp23 expression in an infected bacterium.
We expected to observe a positive correlation between bacteria number and LuxR output.
Build
We built our simulation model in Pinetree stochastic gene simulator, which embodied the transcription of late promoter in T4 genome, lysis inhibition and lysis from without.
The specific model codes can be found in our model section.
Test
We first tested the relationship between input bacteria and output LuxR under 20000 phages in the system, which indicated a linear relationship between them.

(Figure 5. LuxR Output VS Bacteria Input under Phage Quantify=20000.)
Similarly, we tested the relationship between input bacteria and output LuxR under 200 phages. We found that in a certain range of bacteria input the output LuxR decreased as the increase of input number.
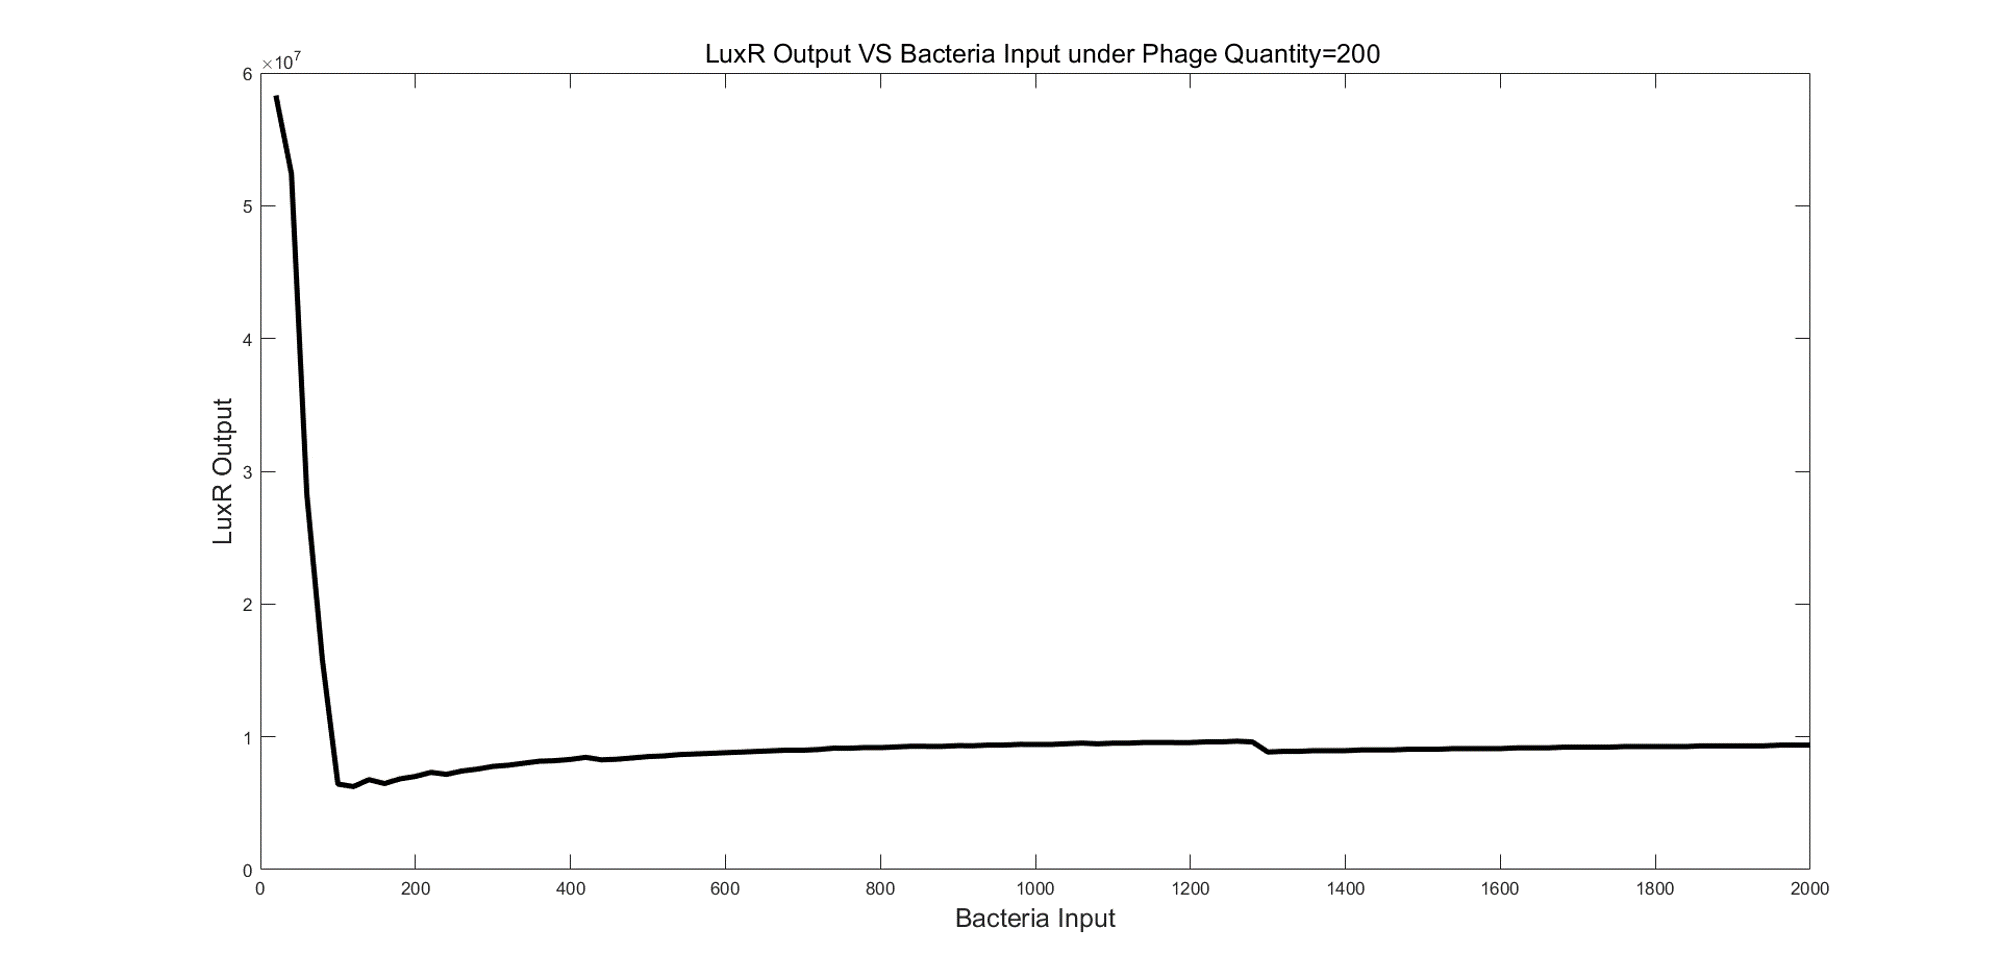
(Figure 6. LuxR Output VS Bacteria Input under Phage Quantify=200.)
Then we tested the relationship between input bacteria and output LuxR under 10000 phages. We found that there was a peak in the LuxR output at a certain bacteria input.
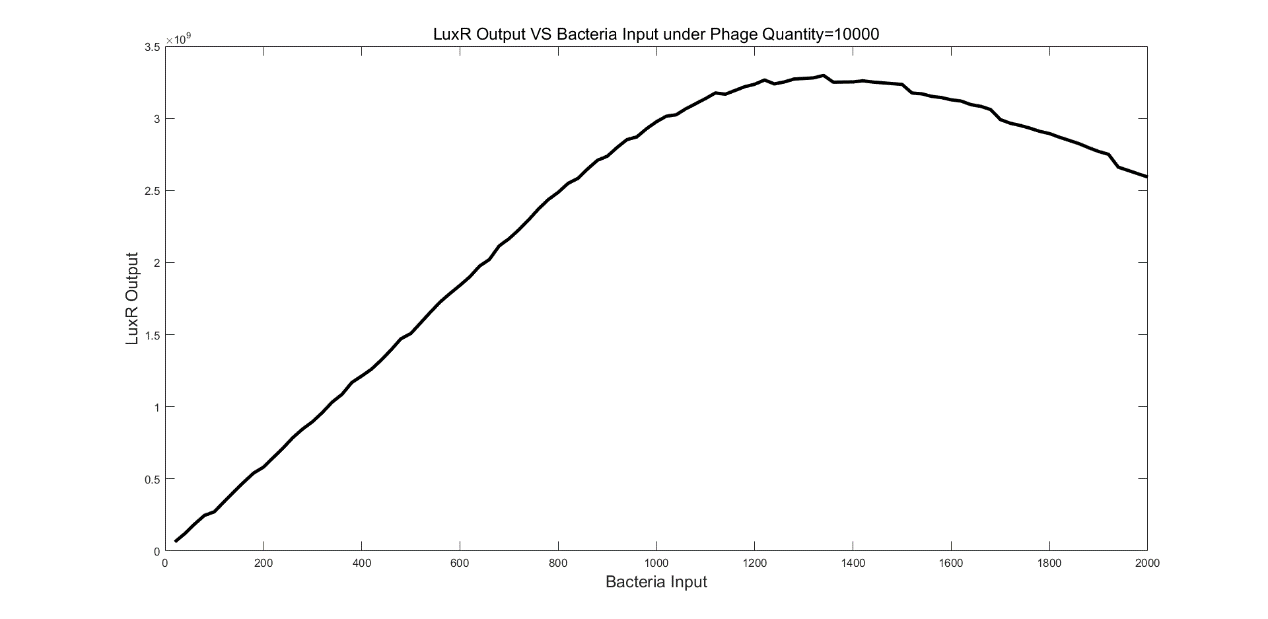
(Figure 7. LuxR Output VS Bacteria Input under Phage Quantify=10000.)
Learn
From the results of simulations, the positive correlation did not always exist, which may influence the quantification of our downstream. We found the number of phages in the system might influence the linearity between LuxR output and bacteria input.
Design
Based on what we leant in DBTL-Cycle 2, we decided to perform parameter sweep of phage number to plot a heatmap which described the LuxR output under each combination of bacteria input.
Build
We first performed the parameter sweep to a series of simulations in Pinetree. Then we outputted the data to MATLAB for plotting a heatmap.
Test
We obtained following heatmaps after simulations. We observed there was a peak in LuxR output. Furthermore, we also found that the position where the peak existed was highly related to the MOI in current system. Usually, the peak appeared at MOI around 7.

(Figure 8. Heatmap of LuxR output under different bacteria input and phage quantity.)
Learn
If we want to get a positive linear relationship between LuxR output and bacteria input in a certain range, we should consider the phage number in the detection system, which can maintain a MOI always greater than 7 in our expected working condition.
Downstream
Purpose
We want to construct an Expression/Degradation system of LuxR and eGFP using Cell-Free system as the chassis.
Expected Function:
①The Cell-Free Expression system displays a sigmoidal curve (S-curve) of LuxR-Dose-Response eGFP Expression Rate.
②The ClpAP Protease exhibits a linear-like Dose-Response degradation curve around the switch point of the S-shape Expression curve (Below KM of its Michaelis-Menten Equation Curve).
③The whole system possess a threshold marked by the binary overall expression rate of a higher and lower level, in response to higher and lower concentration of LuxR input.
④The threshold can be modified by shifting the S-curve to meet demands derived from the combination and optimization process of the upstream and downstream systems.
Purpose: To preliminarily construct and test the system, generating data for trouble-shooting.
Design
An Expression/Degradation system was construct using NEB T7-Polymerase cell-free system as the chassis. The Cell-Free system provides the expressional materials including NTPs and Amino Acids, while Sigma70 Polymerase, pluxR_eGFP, pluxR_LuxRm, and pluxR_eGFP plasmid are exogenous.
AHL silution of at least 5ng/μL was added into every part of the system for the purpose of keeping all the LuxR active and protecting them from degradations by protease such as Lon protease.
Expected Function: The Cell-Free Expression system displays an S-shape Curve of LuxR-Dose-Response eGFP Expression Rate.
Build
The plasmid was constructed using a pUC57 Backbone, NdeI and XhoI restriction enzyme for cleavage and T4 Ligase for ligation; the sequence of pluxR_LuxR and pluxR_eGFP were inserted into the backbone. The successfully constructed plasmids were screened by sequencing.
We prepared the cell-free expression system by mixing:
The chassis of the system: NEB T7-polymerase-based Cell-Free system.
Polymerase: Sigma70
AHL solution
The plasmids were added in to the customed system for expression.
The testing of the system should be done by
①expressing LuxR using the system and a commercial pET_LuxR plasmid,
②perform SDS-PAGE and Western Blot on the LuxR sample,
③adding the LuxR into another set of cell-free system, and
④detecting the fluorescence signal.
Test
To obtain viable LuxR: pET_LuxR plasmid were added into the NEB cell-free system and incubated in 37°C water bath for 3 hours.
To verify the LuxR: SDS-PAGE using 12% polyacrylamide gel and Western Blot test were performed.
To test the system: the expressed LuxR were added into another set of NEB cell-free system as the transcription factor of pluxR_eGFP.
Experimental outcome:

(Figure 9. The Western Blot result of the NEB cell-free expression product.)
There was a band on the WB membrane indicating the successful expression of LuxR; no fluorescence was detected.
Learn
The Sigma70 polymerase may not be compatible with T7-polymerase-based NEB Cell-Free system. Replacement of the Cell-Free System is required.
Purpose: To test the new Sigma70-Polymerase-base cell-free system and construct the S-curve with it if possible.
Design
An Expression/Degradation system was constructed using Promega Cell-Free system as the chassis. The Cell-Free system provides the expressional materials including NTPs and Amino Acids, while pluxR_LuxR, and pluxR_eGFP are exogenous.
AHL silution of at least 5ng/μL was added into every part of the system for the purpose of keeping all the LuxR active and protecting them from degradations by protease such as Lon protease.
Expected Function: The Cell-Free Expression system functions and displays an S-shape Curve of LuxR-Dose-Response eGFP Expression Rate.
Build
The plasmid we used was the previous ones.
The plasmids were added in to the customed system for expression.
The volulme of LuxR sample, AHL solution, and plasmid to be added into the 60μL cell-free system was optimized to 6μL (1:10), 3μL (25ng/μL), and 2μL respectively.
The testing of the system should be done by
①expressing LuxR using the system and a commercial pET_LuxR plasmid,
②perform SDS-PAGE and Western Blot on the LuxR sample,
③adding the LuxR into another set of cell-free system, and
④detecting the fluorescence signal.
The construction of LuxR-Dose-Response Curve of eGFP Expression Rate (denoted as S-curve) should be done by:
①preparing dilution series of LuxR,
②measuring the eGFP expression rate under each LuxR concentration.
Test
To test the system: the expressed LuxR (by NEB cell-free system) (denoted as NEB-LuxR) were added into sets of Promega cell-free system as the transcription factor of pluxR_eGFP.
Experimental outcome:
The peak of the emission spectrum was detected at ~510nm, while that of the excitement spectrum was at ~490nm".

(Figure 10. The measured Emission and Excitation of the NEB cell-free expression.)
...
...
Design (C2TC1)
Use NEB-LuxR as transcription factor, do series of 1000-fold dilutions to test the corresponding induced expression rate of eGFP.
Build (C2TC1)
The NEB-LuxR was 1000-fold diluted by LB broth; the dilution product was further diluted 1000-fold.
The pluxR_eGFP plasmids used in the experiment were the previous ones.
Test (C2TC1)
The original stock and the two dilutions of NEB-LuxR were added into 3 sets of Promega cell-free system as the transcription factor. After the expression of 4 hours, the emission curve of the 3 samples were measured, the value of the peak at ~510nm were obtained and used to construct the S-curve.
Experimental outcome
The 3 points indicated an increase in LuxR-dose-response expression rate.

(Figure 11. The average expression rate of the three LuxR concentration.)
Learn (C2TC1)
Finer dilution series such as 10-fold or even lesser should be done to determine the exact shape of the curve around the interval of 100 and 10-3 dilution of NEB-LuxR. The amount of LuxR sample is therefore required to be larger; eGFP expression method should be improved: cell-free expression was too expensive and small in amount.
Design (C2TC2)
Use E. coli expressed LuxR as transcription factor, do series of 10-fold dilutions and some narrower steps between certain intervals to test the corresponding induced expression rate of eGFP.
Build (C2TC2)
The E. coli expressed LuxR was harvested and dissolved in LB broth (denoted as LB-LuxR). Part of the LB-LuxR was taken to be purified and quantified for rough concentration calculation; the concentration was ~10μM.
The LB-LuxR was 10-fold diluted by LB broth from 10-fold to 100,000-fold (5 sets); the 10-fold dilution was then diluted to the concentration 10-1.5x and was put through 2 more 10-fold dilutions to obtain the samples with 10-2.5x and 10-3.5x concentration of the original solution.
The pluxR_eGFP plasmids used in the experiment were the previous ones.
Test (C2TC2)
The original stock and the 8 sets of dilutions of LB-LuxR were added into the Promega cell-free system as the transcription factor. The real-time expression of eGFP were monitored by the plate reader. The average expression rates before the stationary phase were calculated and used to construct the S-curve.
Experimental outcome
The original stock and the 8 sets of dilutions of LB-LuxR were added into the Promega cell-free system as the transcription factor. The real-time expression of eGFP were monitored by the plate reader. The average expression rates before the stationary phase were calculated and used to construct the S-curve.
Experimental outcome:
The 9 points indicated an increase in LuxR-dose-response expression rate; the plateau of the S-curve was not reached.

The 9 (Figure 12. The real-time fluorescence accumulation curve of the nine LuxR concentration)

The 9 (Figure 13. The average expression rate of the nine LuxR concentration.)
Learn (C2TC2)
The LuxR concentration is not high enough to induce an expression rate at the higher stationary “plateau” of the S-curve. Expressing higher concentration of LuxR or concentrating of the LuxR sample is required.
Design (C2TC3)
Use concentrate LuxR as transcription factor, do series of dilutions with wide steps to verify the plateau of eGFP expression rate curve. One point of the previous LB-LuxR concentration must be covered for analysis.
Build (C2TC3)
The E. coli expressed LuxR was harvested and dissolved in LB broth and concentrated using a Millipore tube; the final concentration measured by purifying and quantifying a small portion of the sample to be 600μM (denoted as C-LuxR).
The C-LuxR was 2-fold, 10-fold, and 60-fold diluted by LB broth.
The pluxR_GFP plasmids used in the experiment were the previous ones.
Test (C2TC3)
The 3 sets of dilutions of C-LuxR were added into the Promega cell-free system as the transcription factor. The real-time expression of eGFP were monitored by the plate reader. The average expression rates before the stationary phase were calculated and used to construct the S-curve.
Experimental outcome:
The expression rate of 300μM LuxR was higher than that of 10μM and 0.1μM.

(Figure 14. The real-time fluorescence accumulation curve of 30μM, 1μM, and 0.01μM)
Learn (C2TC3)
The concentration of LuxR was successful. Studies should focus on the interval of 1μM – 100μM. Comparison of the expression rate induced by 10μM, 100μM and higher concentration should be compared to verify the specific point where the plateau is reached.
Learn
The estimated plateau from the experimental data was not significantly higher than the lower plain of the S-curve and even the expression product induced by the highest concentration of LuxR is not observable via naked eyes: a more powerful cell-free system in protein expression is needed.
Purpose
To test the new Sigma70-Polymerase-base cell-free system and construct the S-curve with it if possible.
Design
An Expression/Degradation system using Arbor Cell-Free system as the chassis. The Cell-Free system provides the expressional materials including NTPs and Amino Acids, while, pluxR_LuxRm, and pluxR_eGFP are exogenous.
AHL silution of at least 5ng/μL was added into every part of the system for the purpose of keeping all the LuxR active and protecting them from degradations by protease such as Lon protease.
Expected Function: The Cell-Free Expression system functions and displays an S-shape Curve of LuxR-Dose-Response eGFP Expression Rate. plateau is significantly higher than the lower plain.
Build
The volulme of LuxR sample, AHL solution, and plasmid to be added into the 12μL cell-free system was scaled and optimized to 1.2μL (1:10), 0.6μL (25ng/μL), and 2μL respectively.
The LuxR sample and the pluxR_eGFP plasmids used in the experiment were the previous ones.
Test
6-fold, 60-fold, 120-fold, 600-fold, 6000-fold and 60000-fold dilution of C-LuxR were prepared. The real-time expression of eGFP were monitored by the plate reader. The average expression rates before the stationary phase were calculated and used to construct the S-curve.
Experimental outcome:
(Figure 15. The average expression rate of the LuxR concentration of 60μM, 30μM, 10μM, 1μM, 0.1μM and 0.01μM)
Learn
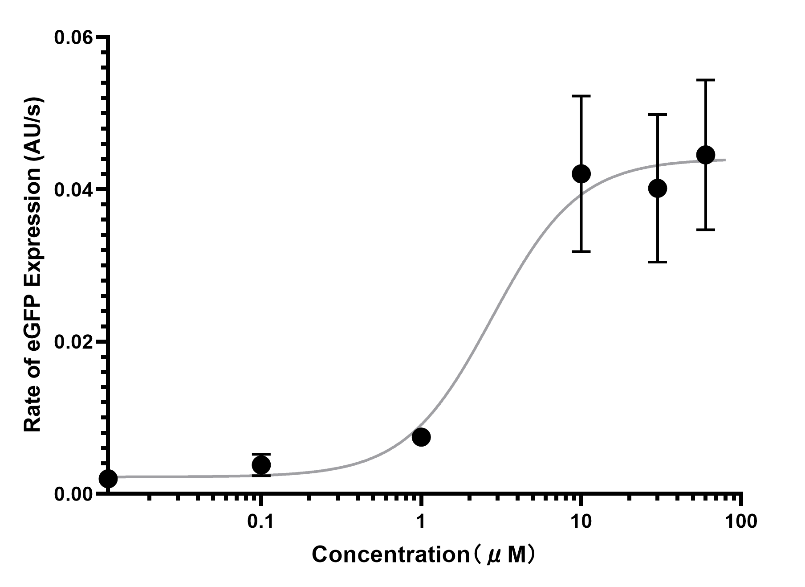
The Arbor cell-free system succeeded in visualizing the signal to an observable level of naked eyes. The switch point of the S-curve was at around ~2.77μM LuxR.
Purpose
To test the curve-shifting mechanism, enabling the modulation of switch point position of the S-Curve, its intersection with the degradation curve, and in turns the threshold, for the demands that might be unveiled during the combination and optimization of the upstream phage-detection and downstream bistable systems.
Design
Promotors with nonsense code behind was used as competitive inhibitors of the LuxR induced protein expression.
Expected Function: The S-curve would be right-shifted after the induction of the inhibitor due to the decline of valid LuxR for each corresponding initial input.
Build
The inhibitory plasmid was constructed using a pUC57 Backbone, NdeI and XhoI restriction enzyme for cleavage and T4 Ligase for ligation; the sequence of pluxR promoter followed by random nonsense nucleotides.
The testing of the inhibition should be done by performing the expressions with or without inhibitors and with higher or lower concentration of LuxR.
Further testing of using different inhibitors of different affinities to LuxR was done by simulation using mathematical models.
The model was constructed by first calculating the remaining valid LuxR after the equilibrium of inhibitor application.
Test
1. Wet Lab
①pLuxR_eGFP plasmid + Inhibitory Plasmid + 5μM LuxR
②pLuxR_eGFP plasmid + LB broth+ 5μM
③pLuxR_eGFP plasmid + Inhibitory Plasmid + 20μM LuxR
The real-time expression of eGFP were monitored by the plate reader. The average expression rates before the stationary phase were calculated and used to construct the S-curve.
Experimental outcome:
Comparing the two sets with 5μM LuxR, the one with inhibitory plasmid displayed a lower expression rate than that of without the inhibitor.
Comparing the two sets with inhibitor, the one with higher concentration of LuxR displayed a higher expression rate than that of with lower LuxR concentration.

(Figure 16. The real-time fluorescence accumulation curve.)
2. In Silico
Two sets of simulation altering the inhibitor concentration and affinity to LuxR, respectively, were performed; each set contained 6 simulations: No inhibitor, inhibitor of 1x, 2x, 3x, 4x and 5x concentration of that of AHL for the concentration-variation sets; No inhibitor, inhibitor of 1x, 2x, 3x, 4x, and 5x affinity to LuxR for the affinity-variation sets.
The simulation was performed using MATLAB.
Experimental outcome:
The real-time expression of eGFP were monitored by the plate reader. The average expression rates before the stationary phase were calculated and used to construct the S-curve.

(Figure 17. A. The inhibitory effect of different concentration of the inhibitor. B. The inhibitory effect of different affinity of the inhibitor.)
Learn
The inhibition was successful and the shifting was theoretically viable, verified by a controlled experiment. However, the direct apply of inhibitors might be inappropriate, for the S-curve is distorted making its intersection with the degradation curve harder to be designed and controlled. A method is needed through which inhibitor-LuxR complex can be removed from the reaction system.
Purpose
To design and test an inhibitor-LuxR complex-removing system for right-shifting of the S-curve in a working bistable system and to test the robustness of the system.
Design
For right-shifting, certain amount of double-stranded DNA of the promotors were immobilized on a surface to consume a certain amount of LuxR when the sample of the upstream cell lysate flow through it, modulating the input signal intensity to the downstream system; this section is called the LuxR-consuming module (LCM).
Expected Function: The S-curve, and consequently the threshold, would be right-shifted after the flow of the lysate through this module, for the concentration of LuxR was diminished by a certain amount decreasing the valid LuxR for each corresponding initial input.
Build
Mathematical model of the LCM was constructed by assigning 1nM/min to disassociation constant k2 and 1.5nM/min to association rate constant k1, inferred from the experimental data of iGEM Team ETH 2014, calculating the equilibrium result and the amount of remaining valid LuxR as the input to the downstream bistable system.

(Figure 18. The diagram of the LuxR-Consuming Module.)
For the synthesis S-curve, Hill equation was applied. The association constant Ka was assigned with 0.1nM/min, inferred from the data of ETH 2014, activation coefficient Kd with 1.5nM and hill coefficient n with 1.6, inferred from the data of iGEM part BBa_F2620, and maximal promoter activity β with 12.6nM/min inferred from iGEM team Imperial 2007.
For the degradation curve, Michaelis-Menten’s equation was applied. The Michaelis-Menten constant Km was assigned with 40nM, while the turn-over rate Kcat was assigned with 0.46nM/min (Shi et al., 2018).
Mathematical model of the bistable system was constructed by combining the equations of S-curve and that of degradation curve; the degradation curve is the linear approximation of the section before Km of the original curve. This system is called the intersection-based variant (IBV) of bistable system.

(Figure 19. The intersection-based variant of bistable system.)

(Figure 20. The diagram of the whole bistable system.)
A normal distribution of errors was calculated using experimental data of measurement. Errors obeying this normal distribution, N (0.472, 0.21), were generated for simulations that is closer to real situations and for the robust test.


(Figure 21. The normal-like distribution of errors.)
The errors were inserted into the system as a random variable in front of every parameter; the variable will be regenerated each time it is applied onto a parameter.

The test of the curve right-shifting should be performed by simulating the convergence process under different LuxR input, identifying the threshold, and comparing the threshold of the system with or without the signal modulation by the curve-shifting region.
The robustness should be tested using a stochastic model of simulations of each input LuxR concentration near the threshold.
Test
Two sets of simulation without errors were performed: with or without the shifting, 100 simulations of 0.4nM, 0.5nM, 0.6nM LuxR input each.
Another 20 simulation of 0.4nM, 0.5nM, 0.6nM LuxR input each was performed with errors obeying the normal distribution was performed.
Experimental outcome:
The simulation without shifting displayed a threshold slightly below 0.5nM of LuxR input, while that of the simulation with shifting was slightly lesser than 13.8nM LuxR.

(Figure 22. The convergence of IVB bistable system with the original threshold.)

(Figure 23. The convergence of IVB bistable system with the right-shifted threshold.)
The simulation with errors exhibited oscillations during the convergence process. The threshold is still slightly lower than 0.5nM LuxR, but 5 out of 20 simulations yielded to a false convergence to the lower equivalence.

(Figure 24. The stochastic bistable system model. A. 100 simulations with 0.4nM and 0.6nM LuxR input. B. 20 simulations with 0.5nM LuxR input.)
Learn
The curve-shifting using fixed promotors was theoretically and mathematically practicable, indicating by the model simulation. The system is at least robust at 0.1nM scale.
Purpose
To simulate a new possible situation of bistable system and verifying the system’s validity.(From the experimental data a concern has risen that a degradation curve with a Km of 40nM may not intercept the S-curve at the section before Km, but at the stationary phase of the curve.)
Design
The S-curve intercept the degradation curve at its stationary phase, except for the absence of theoretical upper equilibrium point. The “on” state is now represented by the visibility of fluorescence and the final intensity is affected additionally by the ATP and the raw materials in the downstream system.
Expected Function: The bistable system still converges to two distinct states indicating whether the bacteria number meets the standard.
Build
Mathematical model of the bistable system was constructed by combining the equations of S-curve and that of degradation curve; the degradation curve is the linear approximation of the stationary phase of the original curve. This system is called the depletion-based variant (DBV) of bistable system.

(Figure 25. The depletion-based variant of bistable system.)
The test of the system validation should be done by inputting different concentration of LuxR and compare the accumulated output signal intensity.
Test
LuxR of 1μM, 1.5μM, 1.6μM, 1.7μM, 1.8μM, 2μM, and 4μM were input into the model for simulation. The program records the amount of accumulated degradation and synthesis eGFP and halt both the synthesis and degradation process once this value exceeds 340μmol, to roughly mimic the depletion process of ATP in the system.
Experimental outcome:
The system successfully converged to two states with the threshold between 1.6 and 1.7.

(Figure 26. The convergence of DVB bistable system.)
All of the groups with LuxR concentration higher than 1.7μM exceeded the visible level of fluorescence intensity, which is theorized from the experience of eGFP standard curve construction.
Learn
This variation of bistable system was also theoretically and mathematically practicable, indicating by the model simulation. Even though there is no theoretical upper equilibrium, the output signal, green fluorescence, can still be used as the visualization of the semi-quantitative signal.
The final iterations of the two sections so far are already very promising in fulfilling our demand of phage detection.
The time-span of the whole system will be no more than 6 hours: the phage-detection phase takes roughly 3 hours while the signal visualization phase takes another 3 hours. The phage used in our project ensures that the output signal is solely related to living bacteria by selective infection, screening out the dead ones. The eGFP expressed at the “positive” state of the system is enough for naked-eye observation and the binary signal is easy to be interpreted by the user of our system.
BROWN, R., LENGELING, A. & WANG, B. 2017. Phage engineering: how advances in molecular biology and synthetic biology are being utilized to enhance the therapeutic potential of bacteriophages. Quantitative Biology, 5, 42-54.
DONG, J., CHEN, C., LIU, Y., ZHU, J., LI, M., RAO, V. B. & TAO, P. 2021. Engineering T4 Bacteriophage for In Vivo Display by Type V CRISPR-Cas Genome Editing. ACS Synthetic Biology, 10, 2639-2648.
DUONG, M. M., CARMODY, C. M., MA, Q., PETERS, J. E. & NUGEN, S. R. 2020. Optimization of T4 phage engineering via CRISPR/Cas9. Scientific Reports, 10, 18229.
MEILE, S., KILCHER, S., LOESSNER, M. J. & DUNNE, M. 2020. Reporter Phage-Based Detection of Bacterial Pathogens: Design Guidelines and Recent Developments. Viruses, 12.
MILLER, E. S., KUTTER, E., MOSIG, G., ARISAKA, F., KUNISAWA, T. & RUGER, W. 2003. Bacteriophage T4 genome. Microbiol Mol Biol Rev, 67, 86-156, table of contents.
SCHMELCHER, M. & LOESSNER, M. J. 2014. Application of bacteriophages for detection of foodborne pathogens. Bacteriophage, 4, e28137.
SHI, X., WU, T., C, M. C., N, K. D. & JOSEPH, S. 2018. Optimization of ClpXP activity and protein synthesis in an E. coli extract-based cell-free expression system. Sci Rep, 8, 3488.
TANJI, Y., FURUKAWA, C., NA, S.-H., HIJIKATA, T., MIYANAGA, K. & UNNO, H. 2004. Escherichia coli detection by GFP-labeled lysozyme-inactivated T4 bacteriophage. Journal of Biotechnology, 114, 11-20.
TAO, P. A.-O., WU, X., TANG, W. C., ZHU, J. & RAO, V. Engineering of Bacteriophage T4 Genome Using CRISPR-Cas9.
TéTART, F., REPOILA, F., MONOD, C. & KRISCH, H. M. 1996. Bacteriophage T4 Host Range is Expanded by Duplications of a Small Domain of the Tail Fiber Adhesin. Journal of Molecular Biology, 258, 726-731.
WEGERER, A., SUN, T. & ALTENBUCHNER, J. 2008. Optimization of an E. coli L-rhamnose-inducible expression vector: test of various genetic module combinations. BMC Biotechnology, 8, 2.
YAUNG, S. J., ESVELT, K. M. & CHURCH, G. M. 2014. CRISPR/Cas9-Mediated Phage Resistance Is Not Impeded by the DNA Modifications of Phage T4. PLOS ONE, 9, e98811.
