Team:USTC/Software
Hello, Welcome to SOFTWARE PAGE
Software Instructions
1. When opening this
program, users can see the initial interface as shown behind.
2. In the “Number of the
uncorrected curves” line, enter the number of curves(0~4). These curves
are from the same set of experiments and are used as standard curves in
the correcting function.
3. In the "Number of the
corrected curves" line, enter the number of corrected curves (0 ~
4).These curves are from the same set of experiments and are used as the
curves to be corrected in the correcting function.
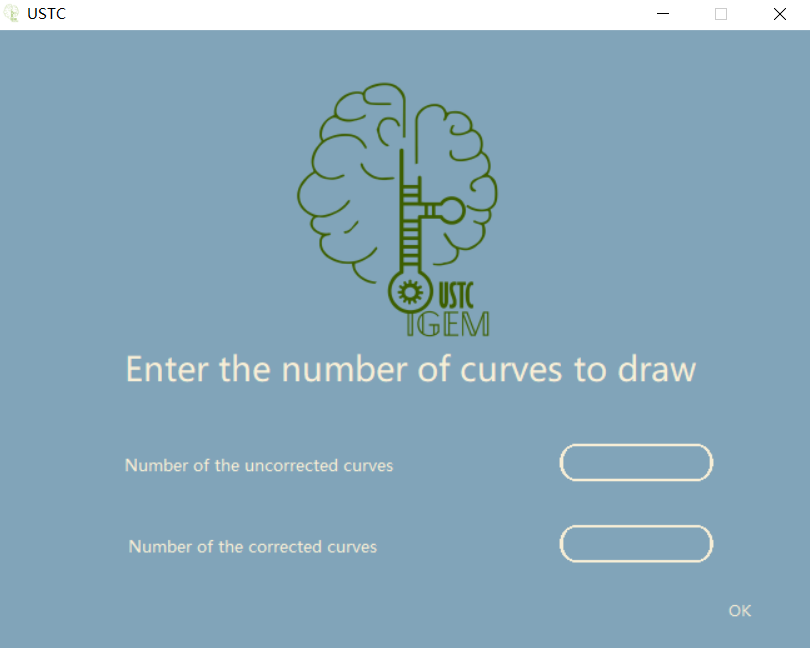
4. After entering the
numbers, click "OK" button to enter the next interface
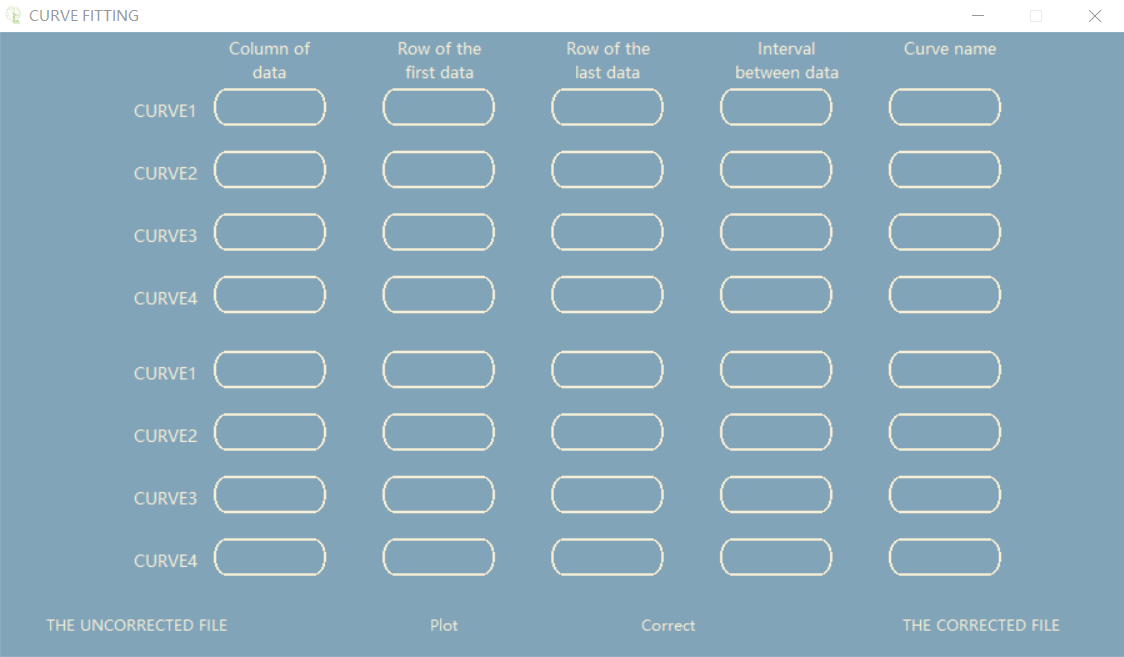
5. The interface is divided
into three parts.
6. Part 1 is the uncorrected
data input box, which is divided into CURVE1, CURVE2...Line. The number
of lines here is the value entered in the first line of the previous
interface.The first line in the data input box here serves as the
correcting curve data location.The first input box inputs the number of
columns of the file data (data read only supports in a row). The second
input box inputs the line number of the first data. The third input box
inputs the line number of the last data.The fourth input box inputs the
interval between data. The fifth input box inputs the label of the
curve.The following input boxes all enter data in this way.
7. Part 2 is the corrected
data input box, which is divided into CURVE1, CURVE2...Line. The number
of lines here is the value entered in the first line of the previous
interface.The first line in the data input box here serves as the
correcting curve data location(The first row of the two parts in the
experiment requires data from the experimental group at the same
concentration).
8. Part 3 has four
buttons.Button 1 is named “THE UNCORRECTED FILE”.You can select a file
with the XLS suffix for storing data by pushing this button. The data in
this file is selected as the data that will not be corrected in the
correcting function.
9. Button 2 is named
“PLOT”.You can graph the input data by pushing this button. This
function only provides drawing function and does not provide correction
function.
10. Button 3 is named
“Correct”. You can correcting the data and then graph the correcting
data by pushing this button.This function provides correcting function.
11. Button 4 is named “THE
CORRECTED FILE”. You can select a file with the XLS suffix for storing
data by pushing this button. The data in this file is selected as the
data that will be corrected in the correcting function.
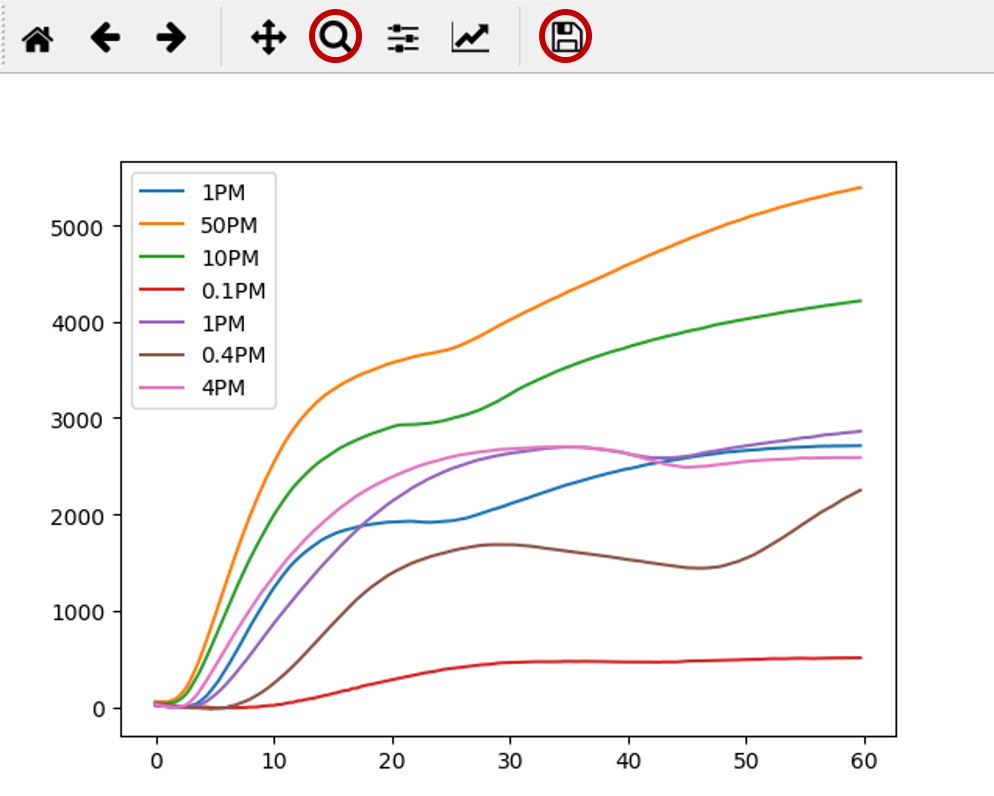
12. You can get something
like the image beneath by pushing the "Plot" or "Correct" button after
you have entered the data.The function key marked with red circle on the
left can be used to enlarge the image, and the function marked with red
circle on the right can be used to save the image.