Team:USTC/Model
Hello, Welcome to MODEL PAGE
Asymmetric PCR
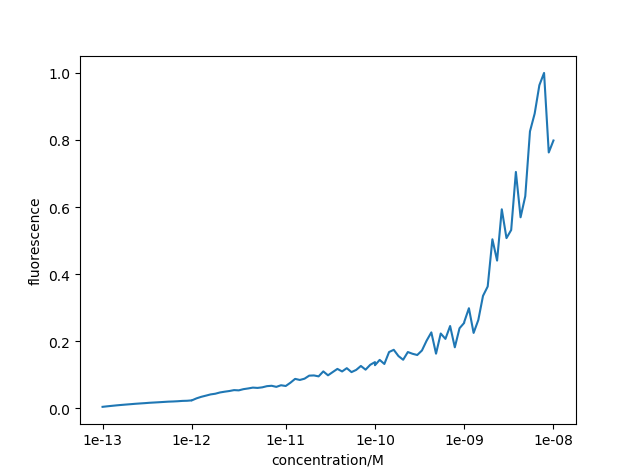
According to the Asymmetric PCR conducted in our project which is a preliminary experiment, we set the amount of template in the experiment as benchmark 1, and the ratio of the two primer quantities added to Asymmetric PCR as 20:1.By continuously adjusting the relative concentration of primers and templates, several groups of experiments with primer quantities of 20:1, 10:1/2, 5:1/4, 4:1/5 and so on were carried out. The largest output of ssDNA was measured in the group of 4:1/5. Based on this fact, we carried out the construction of its model to explore the relationship between ssDNA yield in Asymmetric PCR and the amount of primer added. Besides, clarifying this relationship is also helpful to produce ssDNA in Asymmetric PCR more efficiently(1).
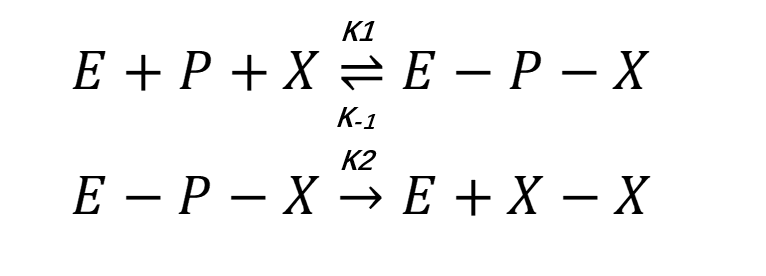
In the process of establishing an asymmetric PCR model, we build a theoretical PCR model firstly, in which we regard the combination of primer and template as a reversible chemical reaction(2, 3).
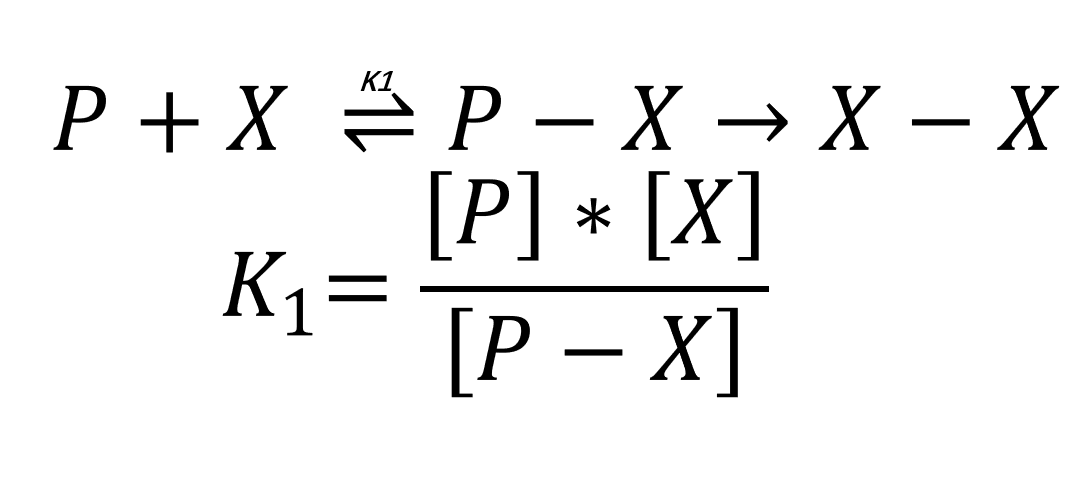
In this assumption, the amount of P-X is equal to the amount of X-X because P-X will be extended to X-X by DNA polymerase. After 25 rounds of PCR amplification, the amount of ssDNA generated by the primer of corresponding concentration can be calculated.
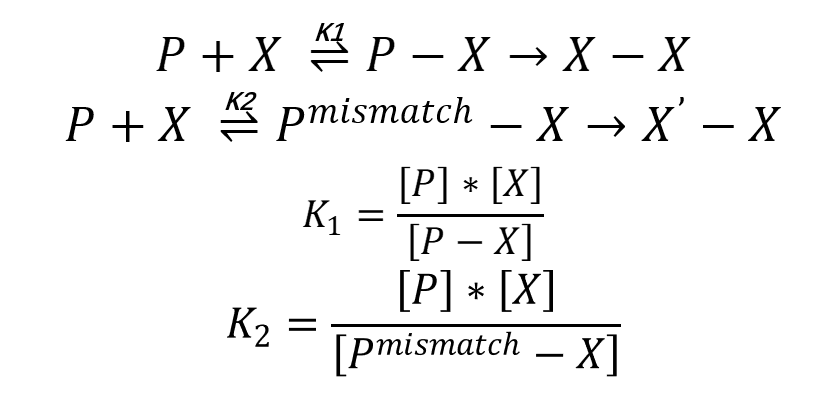
In our model, there are also side reactions in Asymmetric PCR and the main side reaction is primer mismatch which means primer binds the incorrect sites of template sequence. In primer mismatch, the product of the following amplification reaction has a different sequence from template. We use X’ to symbolize the undesired product here. Then, the model is modified to the following reaction.
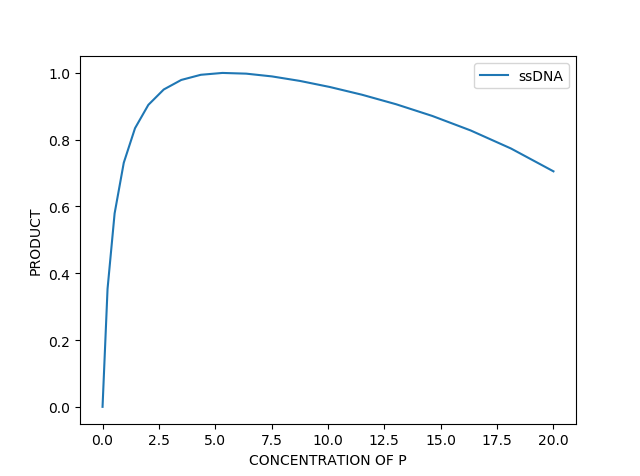
In addition, we assume that K2 is proportionate to the concentration of primer because of the properties of experimental results. After modulating, we plotted the relation between concentration of X( ssDNA) and concentration of P( former primer). We can see that ssDNA yield reaches the highest point when P is around 4.0 which conforms to experimental results we mentioned before.
RPA
The RPA model part consists of three progressive models. Starting from the ordinary RPA reaction without aptamer and tau protein, the RPA model is built step by step.
1. ordinary RPA model
We disassembled the RPA reaction process into chemical reactions(4).
Derived from chemical equilibrium theory, we use steady state approximation method adopted in Michaelis-Menten equation to simulate the catalysis of enzyme and deduce the rate equation.
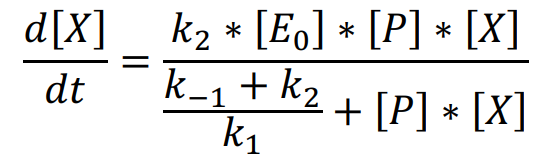
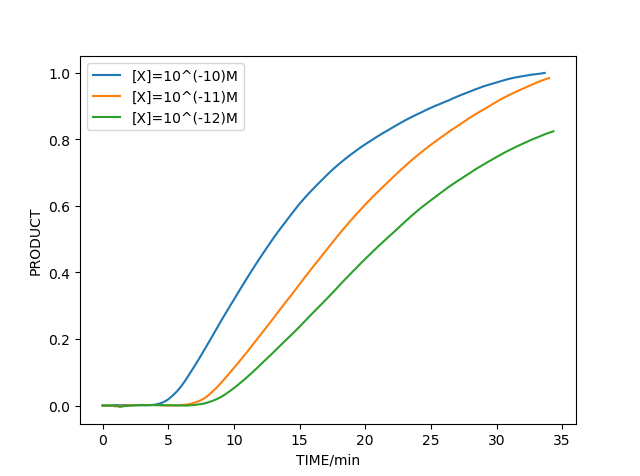
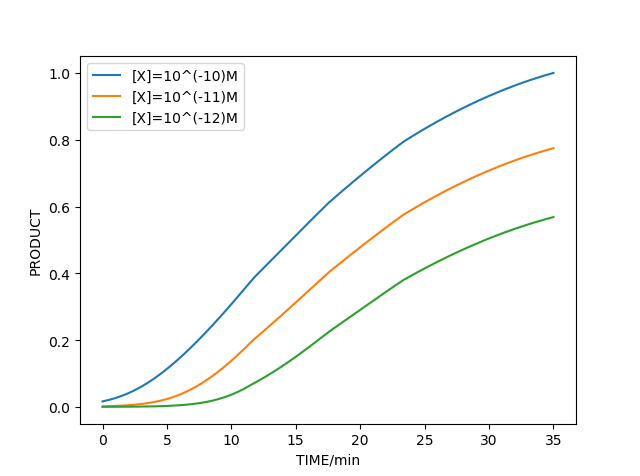
By fitting experimental results of reference group, we adjust some parameters and smoothen the curve. Using the parameters from references and experiments and considering the effects of side reactions, we plot the amplification process in different concentrations of template which is shown below, and the curve we plot can generally match the experimental results. This accordance supports our theory and proves the reasonability of predictions from the ordinary RPA model.
2. RPA with aptamer model
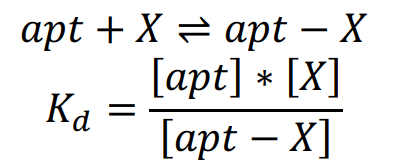
Based on the ordinary RPA model, we continue to build a model with aptamer. We still explain the mechanism from chemical equilibrium theory. So the combination of aptamer and template can be described as below equation.
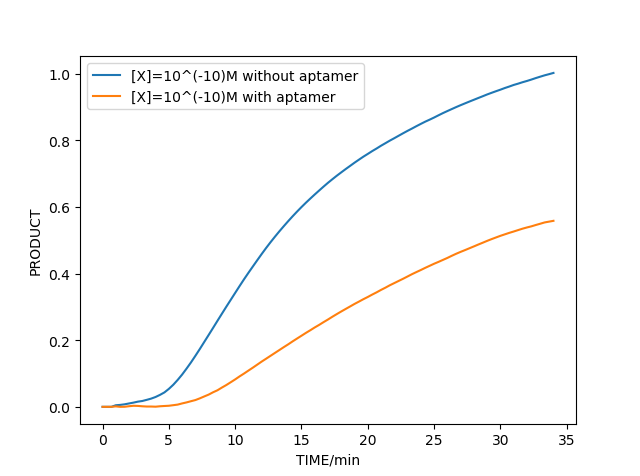
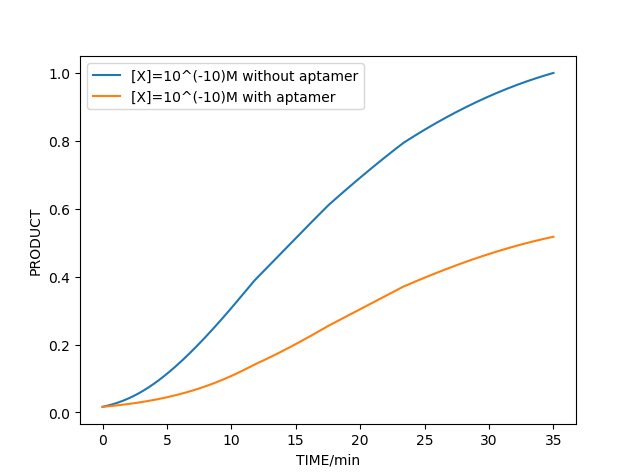
Combined with the methods and parameters in ordinary RPA model, we can simulate the amplification reaction as shown below which also matches experimental results.
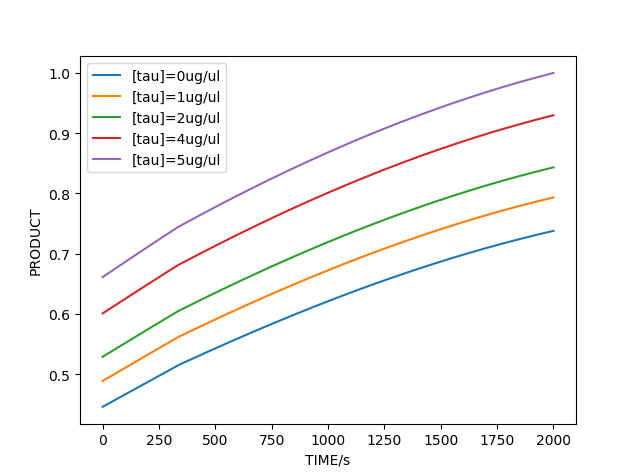
3.RPA with aptamer and tau protein model
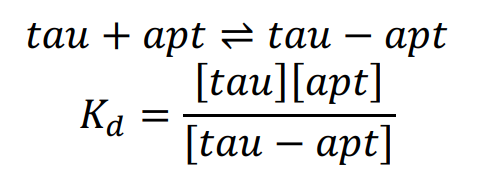
To optimize the model with aptamer and tau protein, we still describe it from chemical equilibrium theory.
Similarly, combined with the above model, we can simulate the amplification reaction with tau protein in different concentrations. According to the simulation,we can verify the feasibility of our early diagnosis of AD project successfully in our model.
Improvement of Experiment
During the experiment, the experimental group also encountered some wrong experimental results. According to these wrong experimental results, we also put forward some hypotheses, and analyzed the experimental results under these hypotheses through modeling analysis. Under these assumptions, the results of modeling analysis are exactly matched with the results of experimental errors. Therefore, we determined the cause of the experiment failure, modified the experiment according to the hypotheses in the modeling, and proposed a new experimental scheme.
We have written down the modeling process of this part in "Engineering Success".
The modeling analysis results are shown below: