Team:UM Macau/Model
Modeling
I. Description
1. Brief description of the issue
Using α-acids as a standard to estimate the shelf life of beer. Aging is the main problem in the preservation of beer. Beer aging is generally an oxidation process that causes off-flavors and darkened colors. α-acids are a class of compounds that provide the bitter taste of beer. While brewing α-acids may be isomerized to form the iso-α-acids due to the application of heat in solution. The two different kinds of α-acids in beer, trans-iso-α-acids, and cis-iso-α-acids, have a very similar structure but different in oxidated speed. Trans-iso-α-acids are much easier to be degraded while the cis- is more stable. Thus, the concentration ratio of trans- and cis- α-acids are different between fresh beer and aged beer. In Li, Huang & Lu’s research, the concentration of cis/trans-iso-A-acid was determined by high-performance liquid chromatography. The ratio of cis/trans-iso-A-acid decreased from 0.62 to 0.49. Therefore, calculate the average ratio of trans- and cis- α-acids in the oxidation progress, we may get this ratio as the shelf life bound of our products.
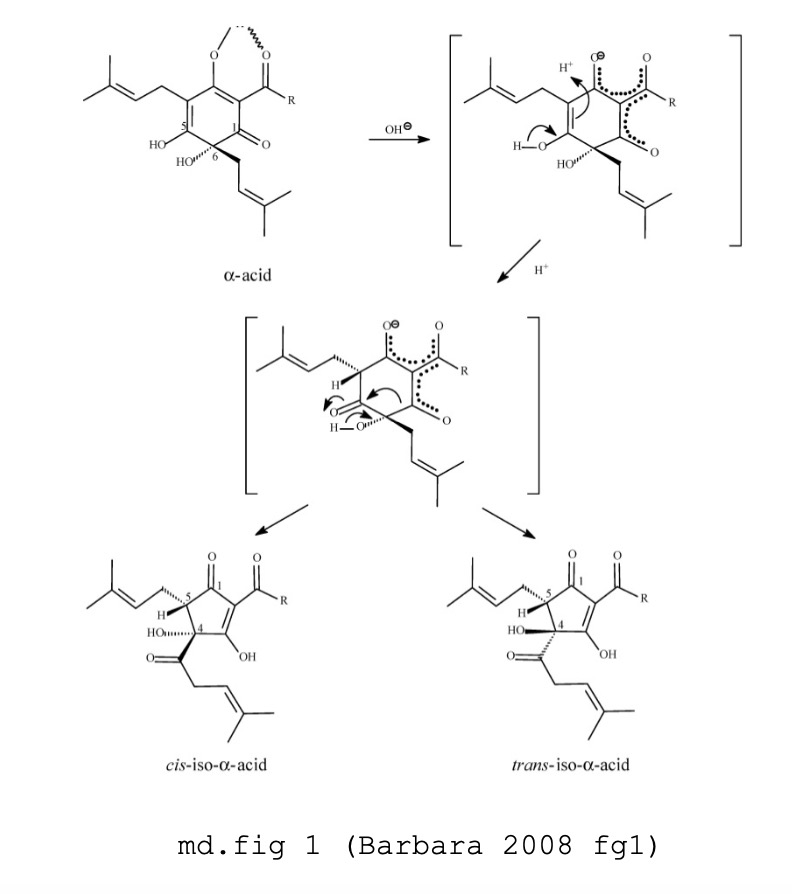
Here is the picture of iso-a-acid,cis-iso-a-acid and trans-iso-a-acid
2. Brief solution
On the basis of knowledge of ratio between trans- and cis- a-acids, using least squared method, we are able to build a fomular to estimate the shelf life of beer.
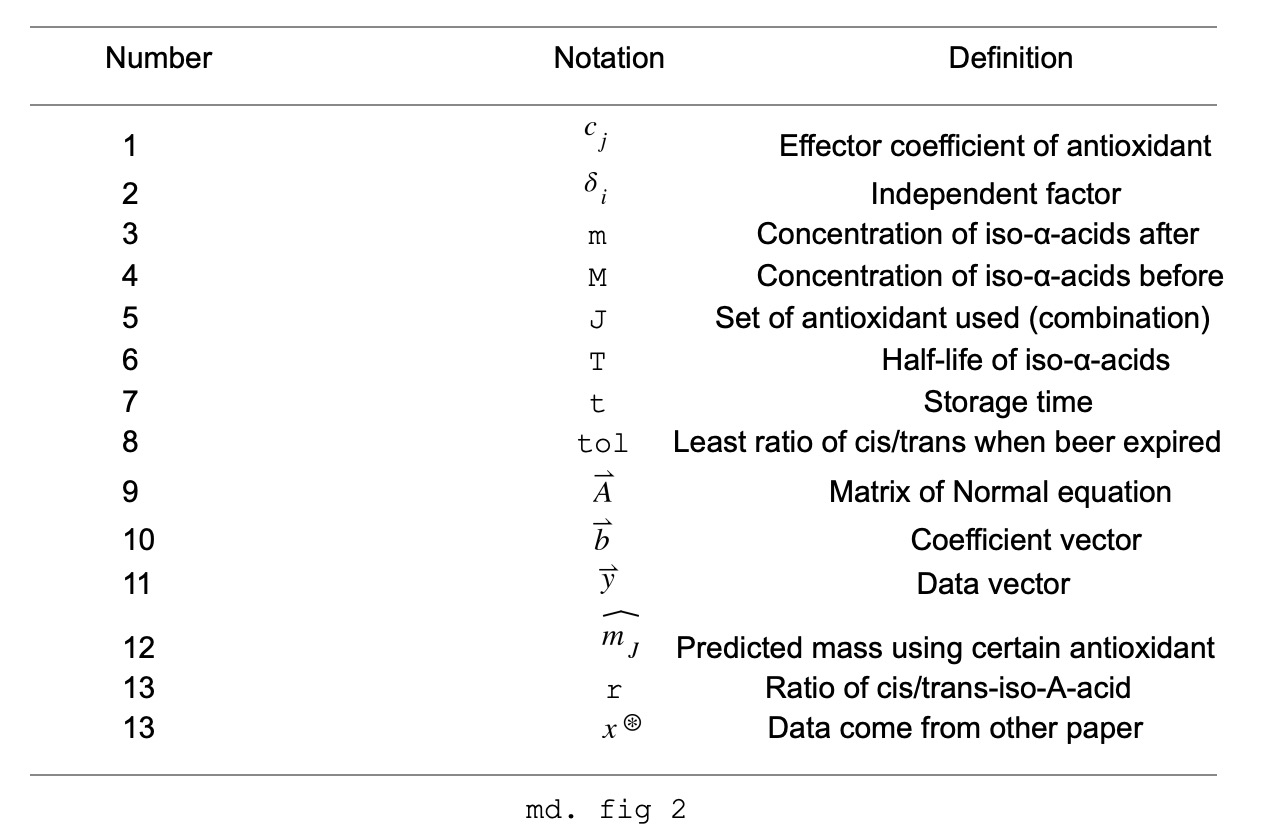
II. Definition of notation
III. Modeling
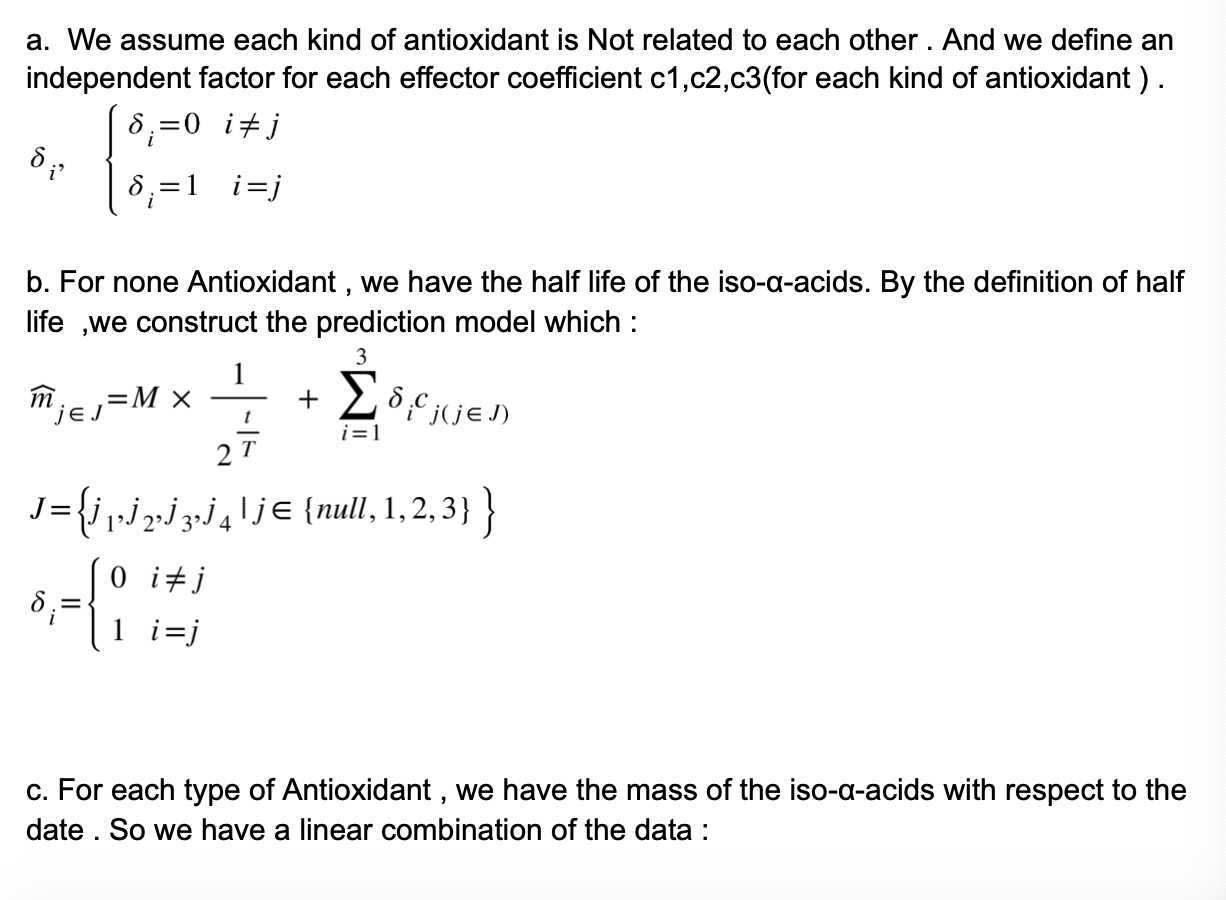
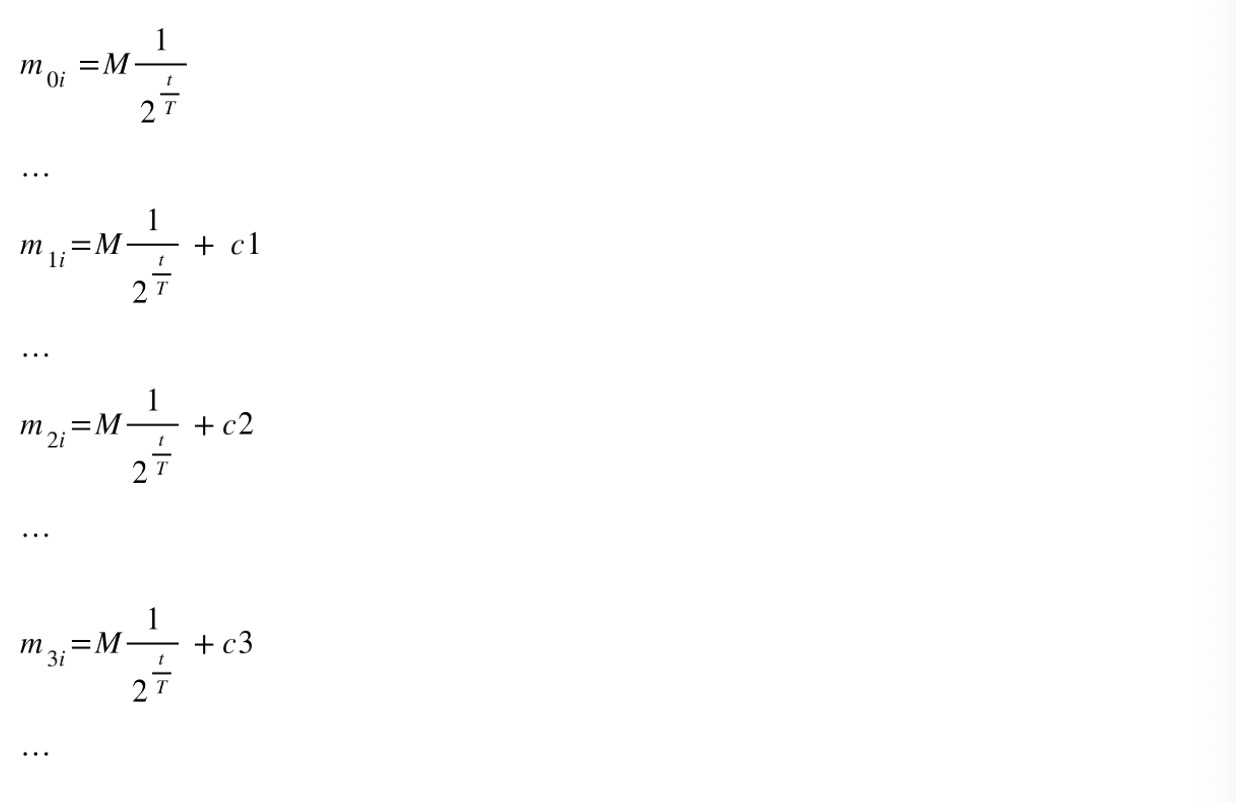
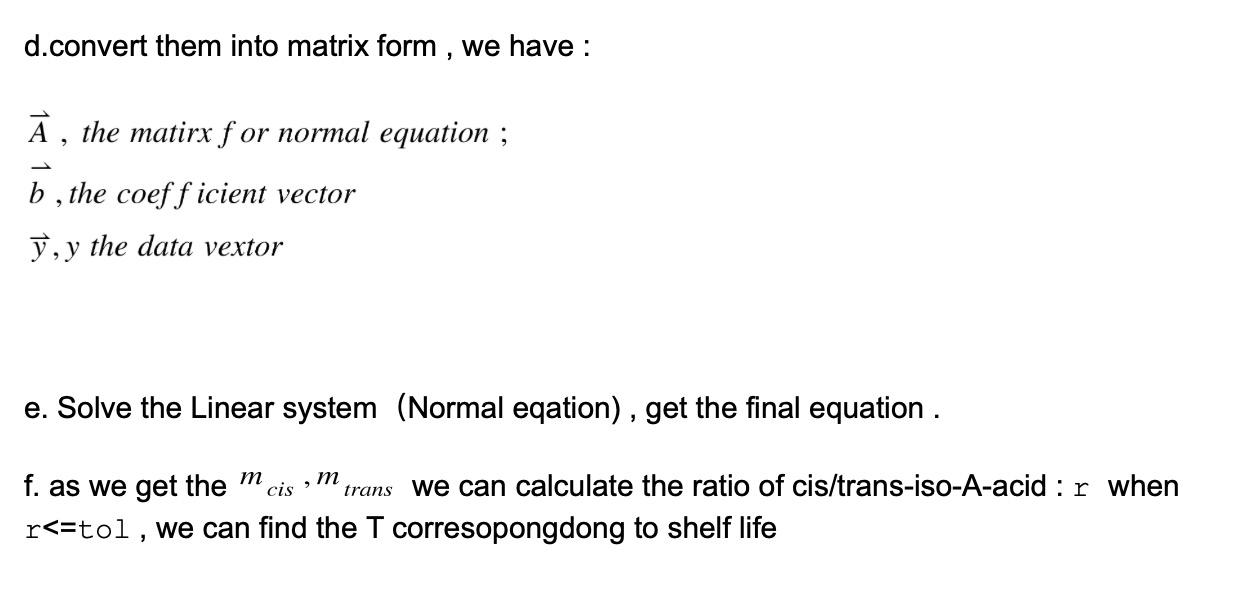
1. Definition of the linear system & Construction of the model.
Before we build the model , we collect the data of none Antioxidant, SOD, For none Antioxidant, we have the half life of the iso-α-acids. For each type of Antioxidant, we have the mass of the iso-α-acids with respect to the date. So, we can construct a model using least-approximation approach to deal with the data.
2. Data collected
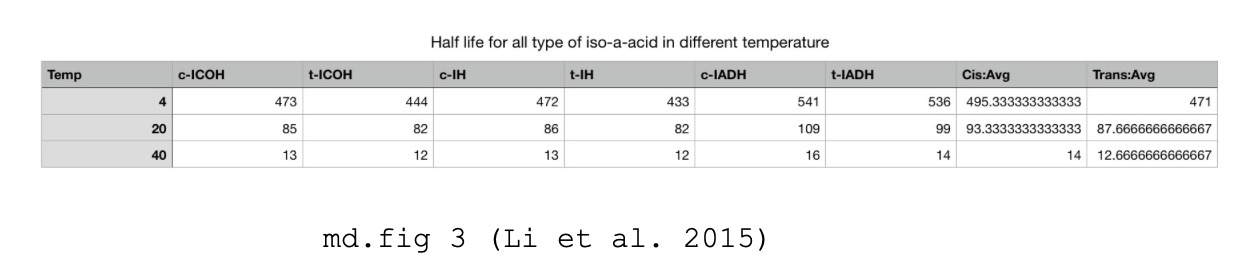
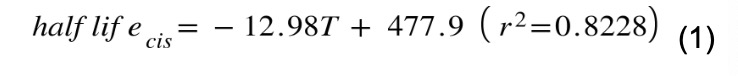
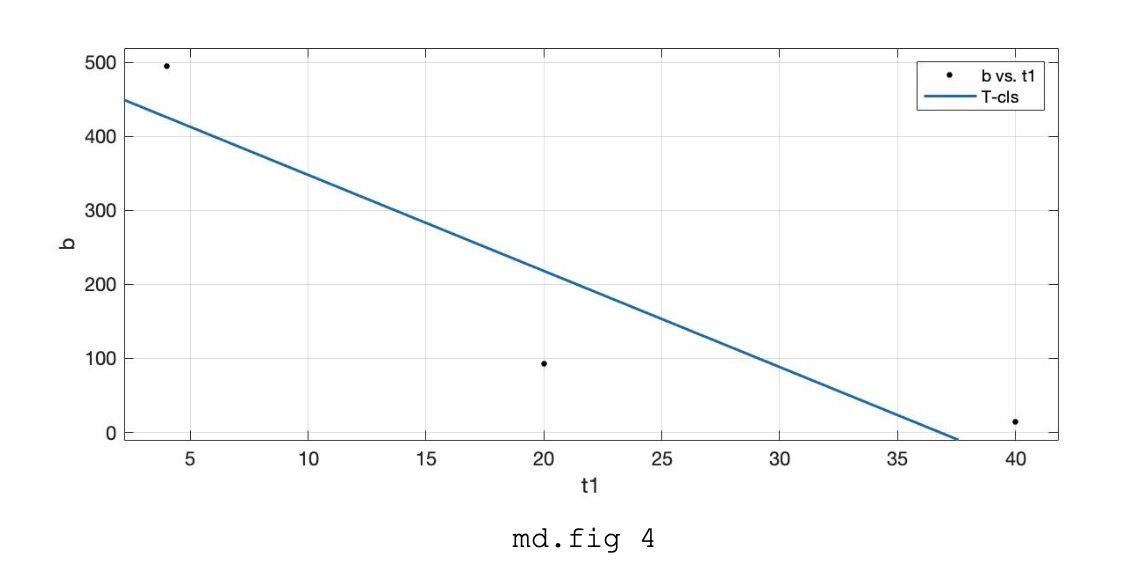
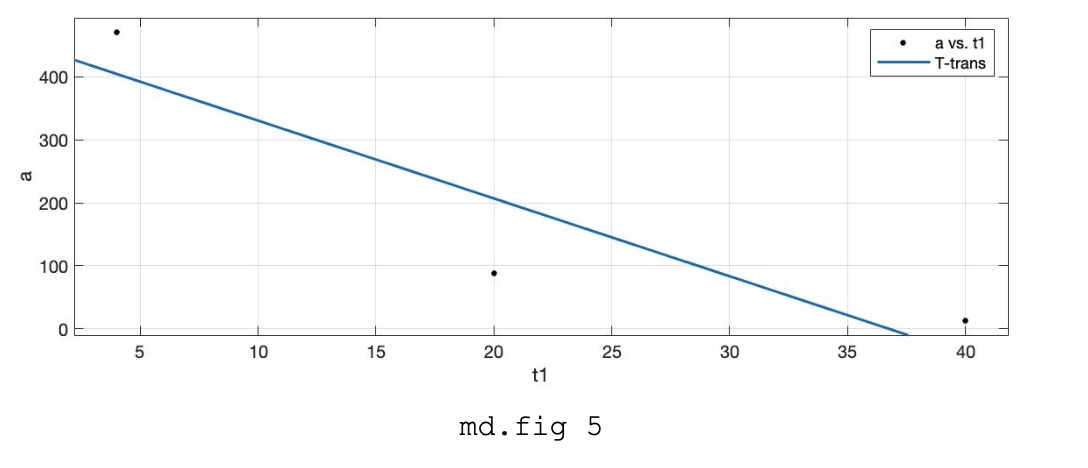
a. According to Li et al.’s research. We collect the half-life for iso-a-acid for constructing the half-life function. This table shows the average half-life for all types of iso-a-acid in different temperatures. We get the average value and use the least linear method ax+b. To get the approximate relation between Temperature T and half-life of iso-a-acid.
The result generated by MATLAB curve fitting toolbox :
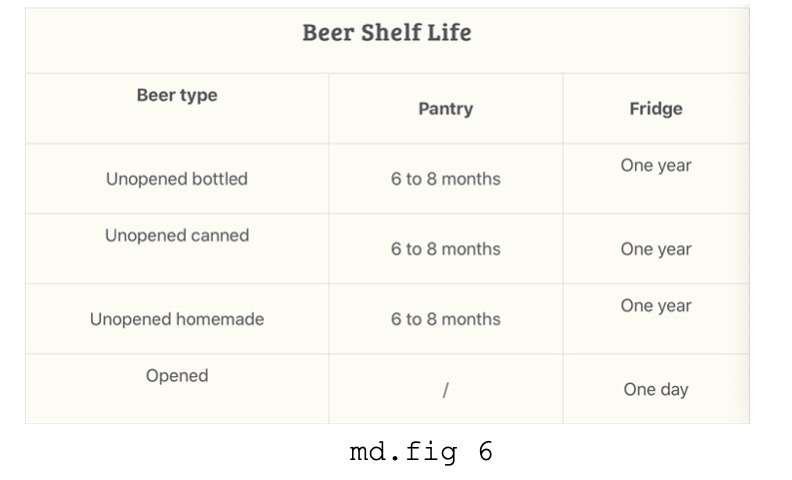
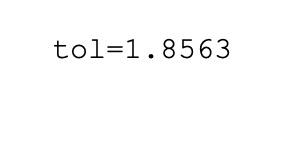
b. Assuming the storage temperature for the beer is 25 Celsius degrees. Here is the beer shelf life we collect on the internet. We can predict the tol using the half life function. According to table we assume the shelf life for normal beer is 7 months(7/12 year):
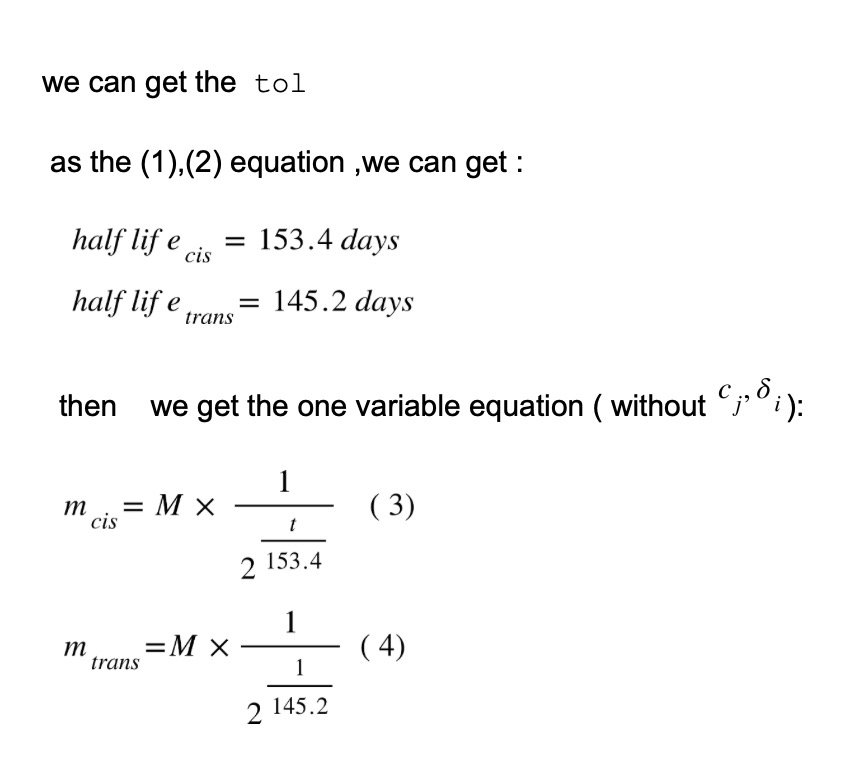
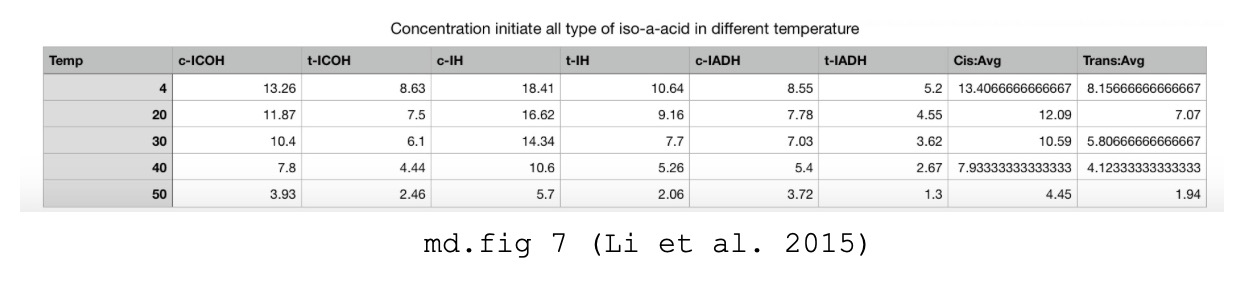
c. We use It’s Initially concentration for Lager beer as our Initially concentration of cis/trans iso-a-acid. According to Li et al. ’s research, they had shown iso-a-acid Contraction in certain temperature points. We samely use linear curve fitting by MATLAB:
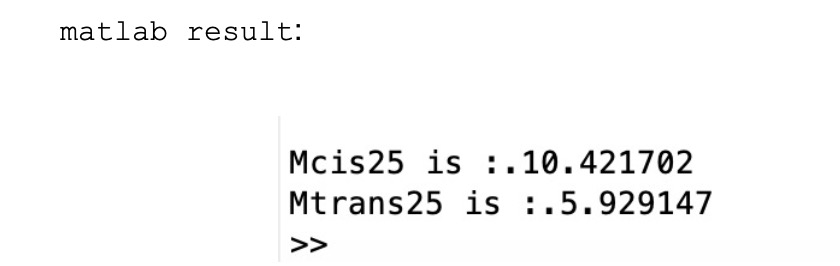
d. Finally let t=214 ,according to (3)(4) and above c, we can get the tol of r:
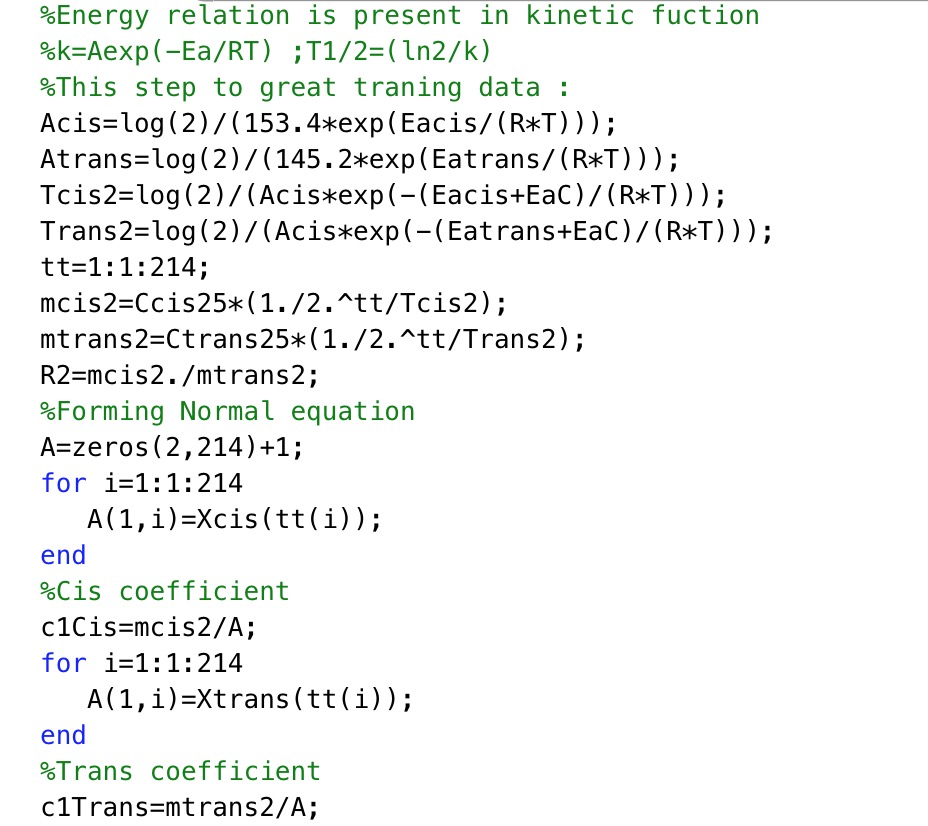
e. Using chitooligosaccharides data to construct normal equation:
Because no paper online had a quantitative analysis of iso-a-acid and chitooligosaccharides. So we used theatrical kinetic analysis and based on online data and wet lab approach.
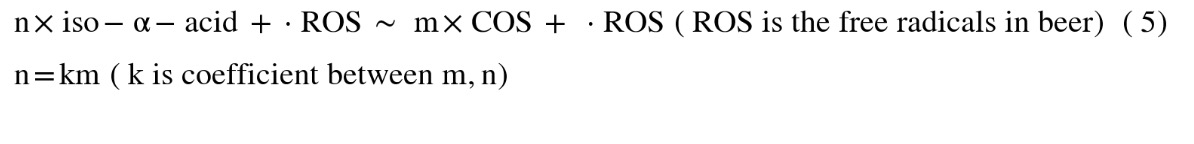
<1>. The iso-a-acid and chitooligosaccharides are all reducing agents. They all have reactions with ROS in beer. So, we have such relation :
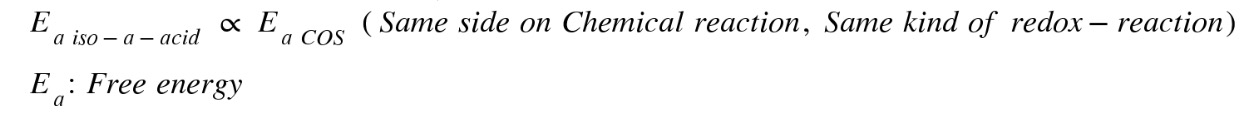
Suppose the total amount of energy in this redox-reaction system is the same amount. In that case, a relation between the amount of substance can be defined.
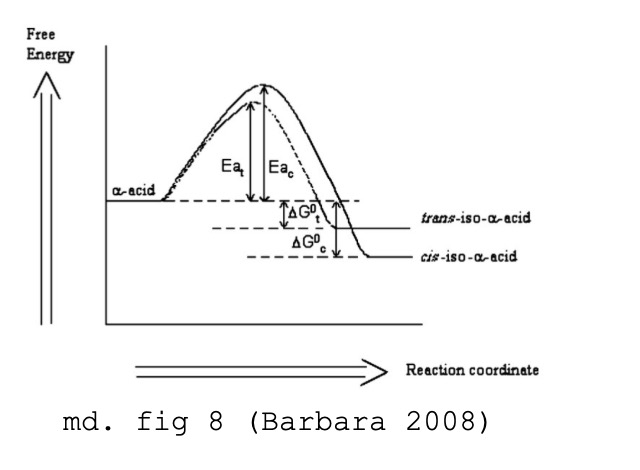
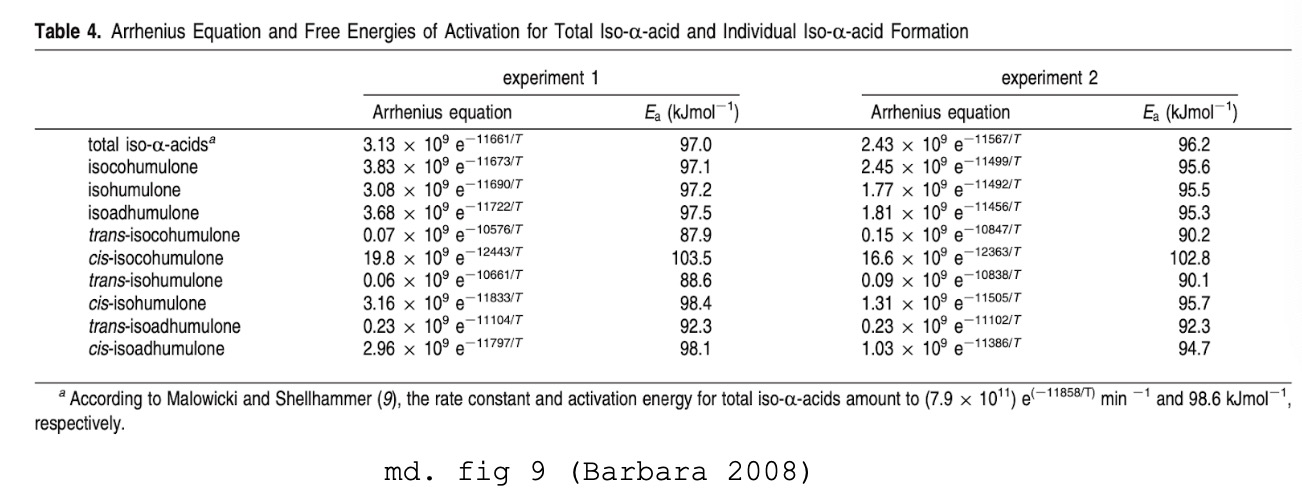
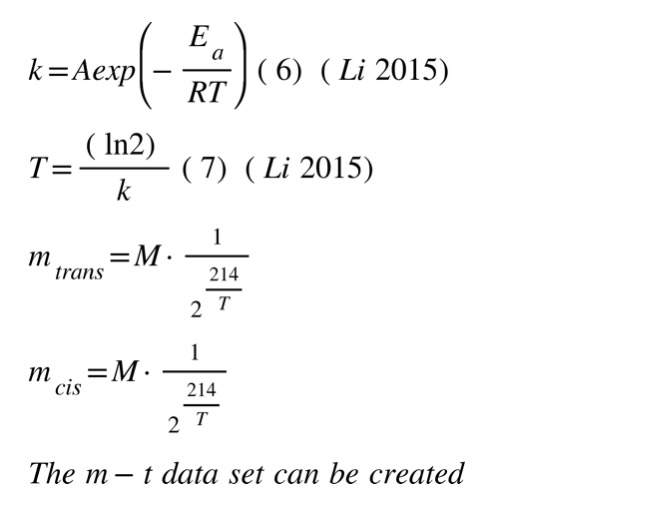
<2>. According to Barbara’s research, They have used the kinetic equation and experiments to get the Ea for all iso-a-acid:
<3>. According to another research about DPPH, combined with the Arrhenius equation (BondetW, 1997). And for the k value for the kinetic equation, we refer to another paper about DPPH-polysaccharides. Chitooligosaccharides indeed are polysaccharides.
Arrhenius equation:
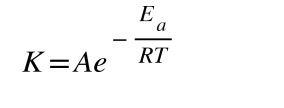
Another form:
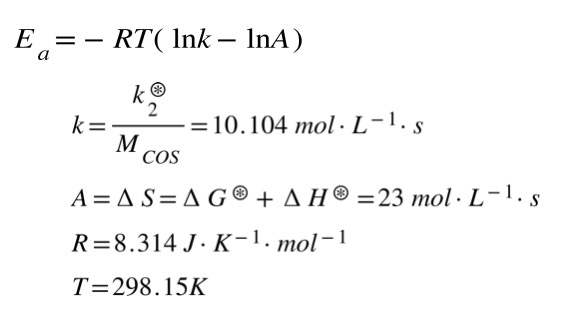
After calculation:
<4>. We could form a Normal matrix by the kinetic equation provided by Li, since the chitooligosaccharides are added. As (5) shows, more iso-a-acid can be counted. Their energy is 19.28 KJ.
f. For SOD data, SOD has a very short half-life which makes it hard to predict and prove its utility.
3. The final Modeling
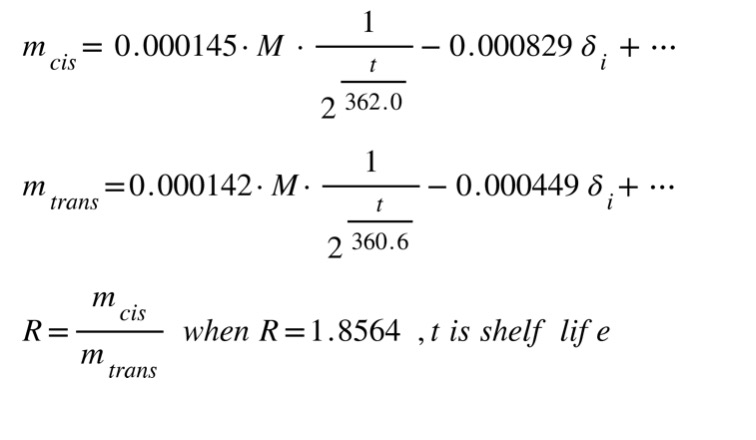
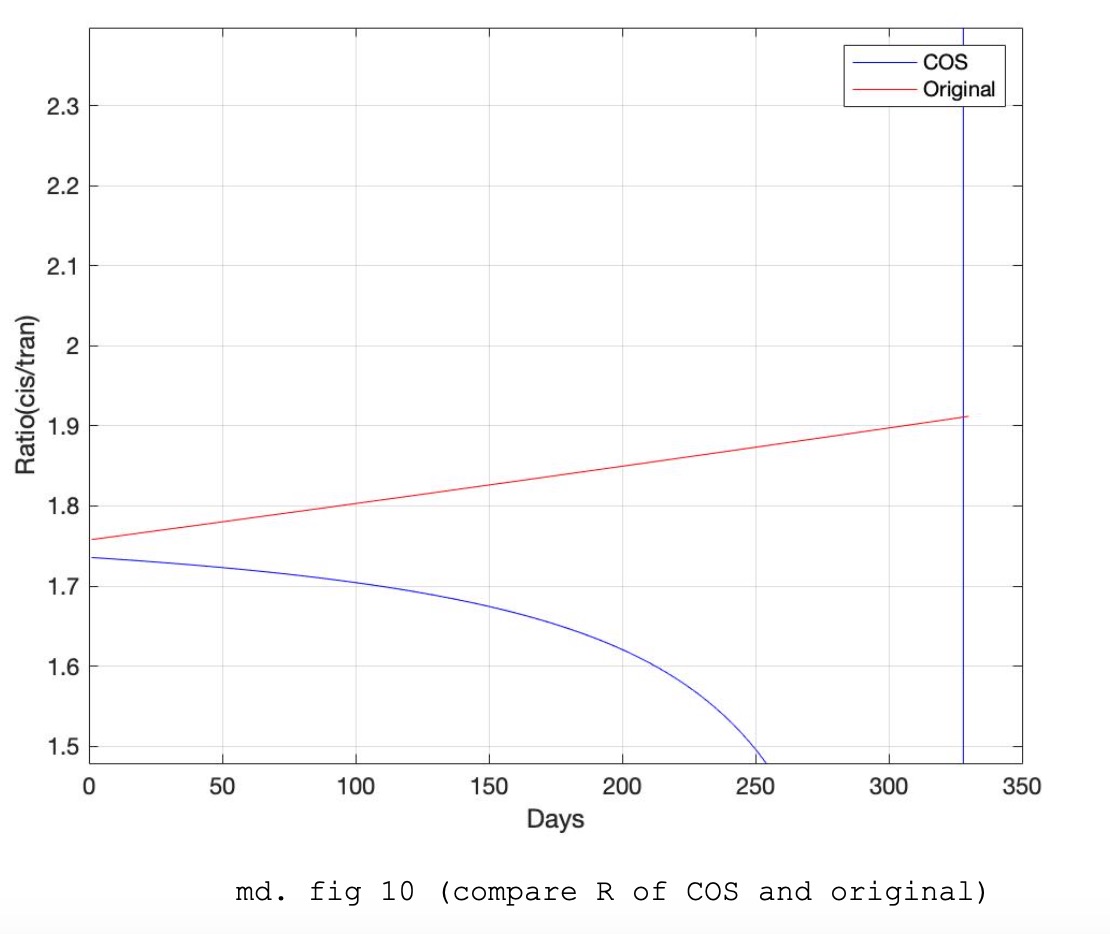
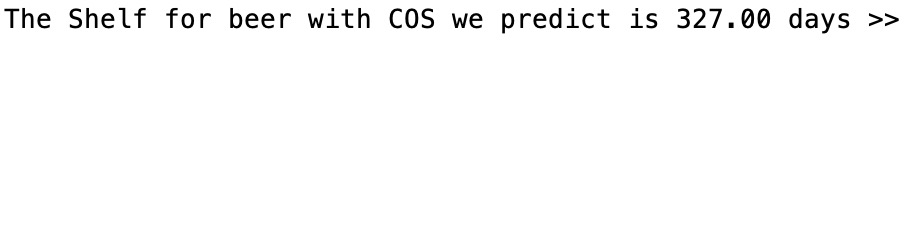
As matlab computation shows , The shelf life of beer added COS is 327 days !
IV. Conclusion and improvement
Conclusion:
a. We can briefly predict the shelf life of beer using our Yeast(chitooligosaccharides) through our model.
b. The model proved the chitooligosaccharides in beer can actually extend beer’s shelf life, increasing the antioxidant energy.
c. The model give an idea for further experiment which try to extend the shelf life of beer to get the training data. Also, further calculation could depend on the general model in 1.
Improvement:
a. The model relies on a huge amount of experiment datas. And, recent research about this field is lacking data. To improve it,we can do those experiments on our own.
b. The model only uses one approach to predict the data.Overfitting or poor fitting would occur. We should also test the accuracy ,either by using a new method(machine-learning) or doing experiments and collecting the testing data by ourselves.
c. Some overfitting would occur at our halflife equation since we only use 3 data to predict the relation. We only use the Linear model to prevent overfitting.
V. Code for our model
The overview of the code
View the source code
Click here to download the source code.m
Click here to download the source code include functions
VI. Reference
Barbara Jaskula, Pawel Kafarski, Guido Aerts,Luc de Cooman(2008)A Kinetic Study on the Isomerization of Hop α-Acids.Journal of Agricultural and Food Chemistry 56(15):6408-15
Li, J. Y., Huang, S. X., Lu, J. (2015). 根据异α-酸降解预测Lager啤酒的保质期, 啤酒科技 2015(04), 65-69.