Team:SCU-China/mRNA Stability Modeling

SCU-China

..
1. RNA Stability Factors

In the work of P. Cetnar et al, they construct 16 operons, each designed and inserted 5’ UTR sequences that contained between 0 and 40 polyA nucleotides, and used GFP as the report gene. During the characterizing experiments, they keep the promoter unchanged and maintain cells in the exponential growth phase for a long time period, so the changes in the mRNA levels can be primarily attributed to changes in mRNA stability[1].

The model focuses on the mRNA stability, considering that mRNA level is correlated with mRNA degradation rate, and thus, if we need to describe the RNA stability, we can assume the mRNA S’ stability is positively correlated with mRNA level T. We have

$$ S\mathrm{'}=kT $$

For simplicity, here k is 1

After constructing the relationship between mRNA stability and mRNA level, by modeling the mRNA level can help us describe mRNA stability.

Obtain the following data in the experiment

Sequence Name Relative mRNA Level
0nt_5p 0.397
1nt_5p 1.000
2nt_5p 0.995
4nt_5p 0.848
5nt_5p 0.550
6nt_5p 0.344
8nt_5p 0.261
10nt_5p 0.336
12nt_5p 0.311
15nt_5p 0.146
16nt_5p 0.135
20nt_5p 0.106
25nt_5p 0.145
30nt_5p 0.158
35nt_5p 0.164
40nt_5p 0.254

Table 1. length of ssRNA in 5’UTR affect the mRMA level

According to the mRNA degradation rate model provided in the literature[1]

$$ dgrad_{mRNA}\left( L \right) =C\left( L-N \right) \exp \!\:\left( -\frac{L}{P} \right) ,L>20 $$ $$ dgrad_{mRNA}\left( L \right) =C\left( L-N \right) ,L\le 20 $$ $$ dgrad_{mRNA}Max=dgrad\left( 20 \right) =9.5058 $$

Where L represents the length of ssRNA region, N represents the smallest possible binding site for RNases E/G[2]. P refers to the persistence length of ssRNA, which is a measure of its bending stiffness and normally ranging from 1 to 7 nm[3][4]. When the length of ssRNA region is less than 20, the activity coefficient C is 0.5281, and when it is greater than or equal to 20, C=0.975.

Considering that the length of the ssRNA sequence at 5’UTR is only one of the indicators to measure the stability of mRNA, in order to avoid the influence between different indicators, the obtained degradation needs to be dimensioned, that is, the relative degradation rate R is obtained.

$$ R_{UTR}\left( L \right) =\frac{dgrad_{mRNA}\left( L \right)}{dgrad_{mRNA}Max}\mathrm{ (}0\le R_{UTR}\left( L \right) \le 1) $$

Considering that this model focuses on the stability of mRNA, which needs to be described by relative stability, so there is relative stability S(L)

$$ S_{UTR}\left( L \right) =-R_{UTR}\left( L \right) $$

According to the above model and experimental data[1], the following results can be obtained:

length of ssRNA Stability length of ssRNA Stability
1 -0.05556 21 0.717063
2 0 22 0.719703
3 0.055556 23 0.720546
4 0.111111 24 0.719754
5 0.166667 25 0.717478
6 0.222222 26 0.713857
7 0.277778 27 0.709022
8 0.333333 28 0.703092
9 0.388889 29 0.696181
10 0.444444 30 0.688392
11 0.5 31 0.679821
12 0.555556 32 0.67056
13 0.611111 33 0.660689
14 0.666667 34 0.650286
15 0.722222 35 0.639423
16 0.777778 36 0.628163
17 0.833333 37 0.616568
18 0.888889 38 0.604692
19 0.944444 39 0.592588
20 1 40 0.580302

Table 2. mRNA stability based on the model (5’UTR)

Daniel P. Cetnar et al. carried out work similar to Part 1, constructing 16 operons and inserting 0-40 nt adenylate into the internal region of the gene. Similarly, after inserting the reporter gene, GFP, a series of characterization tests were performed.

Sequence Name Relative mRNA Level
0nt_I 1.000
1nt_I 1.192
2nt_I 1.406
4nt_I 1.151
5nt_I 1.045
6nt_I 1.097
8nt_I 1.091
10nt_I 1.217
12nt_I 0.839
15nt_I 0.872
16nt_I 0.898
20nt_I 0.705
24nt_I 0.622
30nt_I 0.747
35nt_I 0.613
40nt_I 0.601

Table 3. length of ssRNA in intergenic region affect the mRMA level

According to the mRNA degradation rate model provided in the literature[1]

Since the culture conditions of the experiment are the same as Part 1, so the changes in the mRNA levels can be primarily attributed to changes in mRNA stability, so there is also a positive correlation between mRNA stability S’ and mRNA level T.

$$ S^{\mathrm{'}}=kT\text{,}k=1 $$

According to the degradation rate model provided by the literature:

$$ dgrad_{mRNA}\left( L \right) =C\left( L-N \right) $$ $$ dgrad_{mRNA}Max=dgrad\left( 40 \right) $$

The meaning of each parameter is the same as in Part 1, where C , the activity coefficient is 0.018.

We can also have the relative degradation rate and relative stability

$$ R_{intergenic}\left( L \right) =\frac{dgrad_{mRNA}\left( L \right)}{dgrad_{mRNA}Max}\mathrm{ (}0\le R_{intergenic}\left( L \right) \le 1) $$ $$ S_{intergenic}\left( L \right) =-R_{intergenic}\left( L \right) $$

According to the above experimental data and model, the following results can be obtained:

length of ssRNA Stability length of ssRNA Stability
1 -0.02632 21 0.5
2 0 22 0.526316
3 0.026316 23 0.552632
4 0.052632 24 0.578947
5 0.078947 25 0.605263
6 0.105263 26 0.631579
7 0.131579 27 0.657895
8 0.157895 28 0.684211
9 0.184211 29 0.710526
10 0.210526 30 0.736842
11 0.236842 31 0.763158
12 0.263158 32 0.789474
13 0.289474 33 0.815789
14 0.315789 34 0.842105
15 0.342105 35 0.868421
16 0.368421 36 0.894737
17 0.394737 37 0.921053
18 0.421053 38 0.947368
19 0.447368 39 0.973684
20 0.473684 40 1

Table 4. mRNA stability based on the model (intergenic region)

In the experiment of Daneil et al., it was found that the first three nucleotides in the 5'UTR affects the activity of the RppH enzyme, thereby affecting the degradation rate of mRNA. After constructing the cistron under the same experimental conditions as part 1 and 2 for characterization experiments[1], the following mRNA level data was obtained

Sequence Name Relative mRNA Level
RppH_AAA 0.055
RppH_AAC 0.524
RppH_AAG 0.561
RppH_AAT 0.409
RppH_ACA 0.317
RppH_ACC 0.613
RppH_ACG 0.634
RppH_ACT 0.397
RppH_AGA 0.716
RppH_AGC 0.755
RppH_AGG 0.748
RppH_AGT 1.000
RppH_ATA 0.825
RppH_ATC 0.604
RppH_ATG 0.716
RppH_ATT 0.446

Table 5. mRNA stability based on the model (first three nucleotides in 5’UTR)

According to the mRNA degradation rate model provided in the literature[1]

Since the culture conditions of the experiment are the same as Part 1, the mRNA level is also only affected by the degradation rate of mRNA, so there is also a positive correlation between mRNA stability S’ and mRNA level T.

$$ S^{\mathrm{'}}=kT\text{,}k=1 $$

For simplicity, here k is 1

Therefore, the table data can be used as the relative stability value of mRNA.

After obtaining the RNA relative stability model under the influence of the three structural factors, which are 5′ untranslated region length, First Three Nucleotides in the 5′ Untranslated Region, Intergenic Region length, we plan to unify the three models into one model, so that the overall relative stability of the RNA can be estimated based on the various characteristics of the RNA.

According to the modeling rules, we observe that the relative stability of RNA affected by the three structural factors have a certain degree of contribution to the relative stability of the overall RNA, so we will build a model to assign weights to the relative stability of the three structural factors. Thus, the overall model is constructed as follows:

$$ Y=\sum_{i=1}^3{\mu _ix_i} $$

Among them, Y is the relative stability of the total RNA, $x_1$ is the RNA stability estimated by the 5'UTR length, $x_2$ is the RNA stability estimated by the RNA mid-end UTR length, and $x_3$ is the first 5'UTR Estimated RNA stability of triplets. $\mu_i$ are the estimated stability of each factor and then used to calculate the total stability parameters. How to calculate the respective contributions of the three structural factors to the total stability of RNA will be our main task in the next modeling.

We considered two schemes to model and predict the contribution. The first method is to predict the contribution of the three factors through the entropy weight method, and the second method is to fit the model parameters based on the existing experimental data.

..
2. Entropy

Entropy is a measure of the uncertainty of the system state, which can be used to measure the information contained in the index data in the evaluation index system and determine the weight of each index accordingly.

Before using the entropy method to find the relative weights, we need to normalize the existing index data from 0 to 1. There are two formulas as follows.

$$\begin{aligned} x_{i j}^{\prime} &=\frac{x_{i j}-\min \left(x_{j}\right)}{\max \left(x_{j}\right)-\min \left(x_{j}\right)} \\ x_{i j}^{\prime} &=\frac{\max \left(x_{j}\right)-x_{i j}}{\max \left(x_{j}\right)-\min \left(x_{j}\right)} \end{aligned}$$

If the indicator is positive, the first formula is chosen, and if the indicator is negative, the second formula is chosen. min(xj) is the minimum value of the jth indicator and max(xj) is the maximum value of the jth indicator. The normalized matrix is thus obtained.

First, calculate the weight of the jth indicator of the ith object:

$$y_{i j}=\frac{x_{i j}^{\prime}}{\sum_{i=1}^{m} x_{i j}^{\prime}}$$

According to the definition of information entropy, the information entropy of the jth indicator in the evaluation matrixY is:

$$E_{j}=-\frac{1}{\ln m} \sum_{i=1}^{m} y_{i j} \ln y_{i j}$$

Calculate the weigh of the jth indicator:

$$w_{j}=\frac{1-e_{j}}{\sum_{j} 1-e_{j}}$$

From this, we can get the contribution of the three structural factors

$$ \omega _1=0.524,\mathrm{ }\omega _2=0.0885,\mathrm{ }\omega _3=0.3876 $$
..
3. Linear Fit

we have obtained all the data of the experiment[1] to measure the influence of three structural factors on RNA stability.

In the case of having all the data of the three eigenvalues and the relative value of the corresponding RNA, we consider using these data for linear regression to predict the linear parameters of the relative content of the three eigenvalues and RNA, and then substitute them into the model.

Part of the data is as follows:

RNA features RNA level(y) Length of 5'UTR(x1) Length of innerUTR(x2) The first triplet codon(x3)
0nt_5p 0.397 1.0000 1.0000 0.755
1nt_5p 1.000 1.0000 1.0000 0.755
2nt_5p 0.995 1.0000 1.0000 0.561
4nt_5p 0.848 0.8889 1.0000 0.055
5nt_5p 0.550 0.8333 1.0000 0.055
6nt_5p 0.344 0.7778 1.0000 0.055
8nt_5p 0.261 0.6667 1.0000 0.055
10nt_5p 0.336 0.5556 1.0000 0.055
12nt_5p 0.311 0.4444 1.0000 0.055
15nt_5p 0.146 0.2778 1.0000 0.055
16nt_5p 0.135 0.2222 1.0000 0.055
20nt_5p 0.106 0.0000 1.0000 0.055
25nt_5p 0.145 0.2829 1.0000 0.055
30nt_5p 0.158 0.3116 1.0000 0.055
35nt_5p 0.164 0.3606 1.0000 0.055
40nt_5p 0.254 0.4197 1.0000 0.055
0nt_I 1.000 1.0000 1.0000 0.755
1nt_I 1.192 1.0000 1.0000 0.755
2nt_I 1.406 1.0000 1.0000 0.755
4nt_I 1.151 1.0000 0.9474 0.755
5nt_I 1.045 1.0000 0.9211 0.755
6nt_I 1.097 1.0000 0.8947 0.755
8nt_I 1.091 1.0000 0.8421 0.755
10nt_I 1.217 1.0000 0.7895 0.755
12nt_I 0.839 1.0000 0.7368 0.755
15nt_I 0.872 1.0000 0.6579 0.755
16nt_I 0.898 1.0000 0.6316 0.755
20nt_I 0.705 1.0000 0.5263 0.755
24nt_I 0.622 1.0000 0.3947 0.755
30nt_I 0.747 1.0000 0.2632 0.755
35nt_I 0.613 1.0000 0.1316 0.755
40nt_I 0.601 1.0000 0.0000 0.755
RppH_AAA 0.146 0.2778 1.0000 0.055
RppH_AAC 1.392 0.2778 1.0000 0.524
RppH_AAG 1.489 0.2778 1.0000 0.561
RppH_AAT 1.085 0.2778 1.0000 0.409
RppH_ACA 0.841 0.2778 1.0000 0.317
RppH_ACC 1.628 0.2778 1.0000 0.613
RppH_ACG 1.682 0.2778 1.0000 0.634
RppH_ACT 1.053 0.2778 1.0000 0.397
RppH_AGA 1.899 0.2778 1.0000 0.716
RppH_AGC 2.005 0.2778 1.0000 0.755
RppH_AGG 1.986 0.2778 1.0000 0.748
RppH_AGT 2.655 0.2778 1.0000 1.000
RppH_ATA 2.191 0.2778 1.0000 0.825
RppH_ATC 1.603 0.2778 1.0000 0.604
RppH_ATG 1.902 0.2778 1.0000 0.716
RppH_ATT 1.184 0.2778 1.0000 0.446

Table 6. various factors affect the mRNA level

According to the mRNA degradation rate model provided in the literature[1]

In this modeling process, we choose to establish a multivariate linear model based on the data characteristics, and use Octave to calculate the linear regression. The ultimate goal is to make the following formula reach the minimum.

$$ J\left( \theta _1,\theta _2,\theta _3 \right) =\sum_{i=1}^m{\left( y^{\left( i \right)}-\hat{y}^{\left( i \right)} \right) ^2} $$

Where $ y^{\left( i \right)} $ is the actual RNA level of the i-th group of data, and $ \widehat{\mathrm{ }y}^{\left( i \right)} $ is the predicted RNA level based on the characteristic value of the i-th group of data.

Calculated by Octave. The final result are as follow.

$$ \theta _1=-0.8124,\theta _2=0.8783,\theta _3=1.5902 $$

Two models are used to fit the experimental data respectively, and then compared with the actual data. The following figure is obtained:

Fig 1 result of two models compared with the actual data
(* Is entropy method, ⚪ is linear regression)

It is clear that when the fitted data is less than 0.5, the entropy weight method has a better fitting effect; otherwise, the linear regression has a better effect.

So, the final model result we get is:

$$ Y=\mathrm{ }k_1\sum_{i=1}^3{\omega _ix_i}+k_2\sum_{i=1}^3{\theta _ix_i} \\ k_1=1,\mathrm{ }k_2=0\mathrm{ (}\sum_{i=1}^3{\theta _ix_i}<0.5) \\ k_1=0,\mathrm{ }k2=1\mathrm{ (}\sum_{i=1}^3{\omega _ix_i}>0.5) $$
..
4. Translation Intensity Modeling

Previous studies have suggested that ribosomes can protect mRNA transcripts from RNase activity, possibly by covering RNase binding sites and limiting their accessibility[5][6].
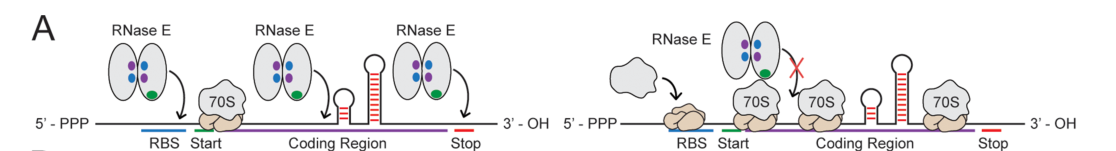
Fig 2 Schematics illustrating how a mRNA’s translation rate controls the accessibility of RNase binding sites in an operon’s coding regions.[1]

In order to quantify the relationship between the translation rate and the decomposition rate of mRNA, we constructed a relevant model to simulate the process.

The key to modeling is to calculate how many bases are not covered by ribosomes and are exposed to the catalytic range of the RNase. Here, we designated α as the ratio of the ribosome’s translation initiation rate over its elongation rate over its elongation rate. We also designated F as the physical footprint of each ribosome in units of trinucleotides (amino acids). According to a TASEP (totally asymmetric exclusion process) model of ribosome dynamics that includes the ribosome’s footprint on the mRNA[7].

When translation initiation is the rate-limiting step (α is less than one), the steady-state ribosome density ρr is

$$ \rho _{\mathrm{r}}=\min \left( \frac{F\alpha}{1+(F-1)\alpha},1 \right) \tag{a} $$

According to the definition,

$$ \rho r=\frac{\left( MF \right)}{N} $$

(M is the number of ribosomes on RNA, and N is the number of codons on RNA)

The relationship defined by eq illustrates how increasing a mRNA’s translation initiation rate results in higher ribosome densities, up until the maximum possible value.

Next, we define the unprotected distance between two adjacent ribosomes, the number of trinucleotides between the end of one ribosome and the beginning of the next ribosome. We call this unprotected RNA ‘hole’, so the hole density ρh=1-ρr. According to the TASEP model,the probability that a bound ribosome has m free trinucleotides.

$$ P(D=m)\propto \frac{\rho _{\mathrm{r}}}{\rho _{\mathrm{r}}+\rho _{\mathrm{h}}}\left( \frac{\rho _{\mathrm{h}}}{\rho _{\mathrm{r}}+\rho _{\mathrm{h}}} \right) ^m\tag{b} $$

The first half of the equation calculates the probability that a mRNA position is bound by a ribosome, whereas the second part calculates the probability that the next m adjacent positions on the mRNA all contain a hole, Substituting equation (a) and the definition of the hole density into equation (b), we get the probability distribution of the distance between ribosomes

$$ P(D=m)\propto \frac{\rho _{\mathrm{r}}\left( 1-F\rho _{\mathrm{t}} \right) ^m}{\left( 1+\rho _{\mathrm{r}}-F\rho _{\mathrm{r}} \right) ^{(m+1)}}\tag{c} $$

We then determined the ribosomes’ average headway distance by calculating the first moment of the probability distribution in eq(c), using

$$ \langle D\rangle =\frac{1}{Z}\sum_{m=1}^{m=L}{P}(D=m)m\tag{d} $$

Where $ Z=\sum\nolimits_{m=1}^{m=L}{P(D=m)} $

According to the model, we model the following results
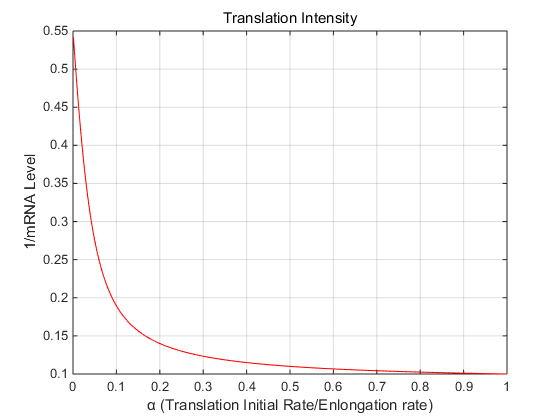
Fig 3 the translation initial rate affects the rate of RNA decomposition(1/mRNA level)

It can be seen that with the increase of translation intensity, the rate of RNA decomposition continues to decrease, verifying the hypothesis proposed in the literature[1].

Reference

  • 1. Cetnar DP, Salis HM. Systematic Quantification of Sequence and Structural Determinants Controlling mRNA stability in Bacterial Operons. ACS Synth Biol. 2021 Feb 19;10(2):318-332.
  • 2. Laurence TA, Kong X, Jäger M, Weiss S. Probing structural heterogeneities and fluctuations of nucleic acids and denatured proteins. Proc Natl Acad Sci U S A. 2005 Nov 29;102(48):17348-53.
  • 3. Chen, H., Meisburger, S. P., Pabit, S. A., Sutton, J. L., Webb, W. W., and Pollack, L. (2012) Ionic strength-dependent persistence lengths of single-stranded RNA and DNA. Proc. Natl. Acad. Sci. U. S. A. 109 (3), 799−804.
  • 4. Doose, S., Barsch, H., and Sauer, M. (2007) Polymer properties of polythymine as revealed by translational diffusion. Biophys. J. 93 (4), 1224−1234.
  • 5. Braun, F., Le Derout, J., and Regnier, P. (1998) Ribosomes ́ inhibit an RNase E cleavage which induces the decay of the rpsO mRNA of Escherichia coli. EMBO Journal 17 (16), 4790−4797.
  • 6. Yarchuk, O., Jacques, N., Guillerez, J., and Dreyfus, M. (1992) Interdependence of translation, transcription and mRNA degradation in the lacZ gene. J. Mol. Biol. 226 (3), 581−596.
  • 7. Shaw, L. B., Zia, R. K. P., and Lee, K. H. (2003) Totally asymmetric exclusion process with extended objects: A model for protein synthesis. Phys. Rev. E: Stat. Phys., Plasmas, Fluids, Relat. Interdiscip. Top. 68 (2), 021910.

Ackhowledgement

Contact Information