Team:SCU-China/Cas-based iFFL

SCU-China

..
1. Introduction

Incoherent feedforward loop(iFFL) is a regulatory pattern in which an activator X controls a target gene Z and also activates a repressor of that target gene, Y. Here we assume that activator X is the copy number of a plasmid. And target gene Z and repressor Y are both located on the plasmid.

Figure 1.The schematic of the iFFL is shown. Copy number(X) influences both repressor(Y) and target gene(Z) expression. The repressor counteracts the effect on target gene expression.

We want to build an iFFL system in Vibrio natriegens, in order to achieve the goal that stabilized promoters incorporate additional elements to decouple gene expression from copy number.

The use of iFFL has been validated in other systems - in the range of 3 to 100 copies in the cell, the expression of target gene remained stable [1]. However, since the repressor chosen in that literature, the TALE regulatory cassette, was nearly 3000 bps in length and added too much burden to our chassis organisms, we decided to replace the repressor. Recent literature has found that the CRISPRi to genes can use the CRISPR-CasF system,but with a molecular weight half that of Cas9 and Cas12a genome-editing enzymes, CasF offers advantages for cellular delivery that expand the genome editing toolbox [2]. We decided to try to use CasF as a repressor in our system for incoherent feed-forward loop.

Fig. 2. iFFL process in bacterium

..
2. Background Knowledge

A detailed modeling analysis of the iFFL process is available in the relevant literature [1],

$$ G\propto c^{1-n} $$

where $c$ is the copy number and n is the cooperativity of repression.

We quickly know that the cooperativity coefficient of CRISPRi is 1 (repression is non-cooperative). When using the CRISPRi system as a repressor, we can achieve the separation of the relationship between the target gene expression and the copy numbers. Therefore, we wish to model the CRISPR-CasF integrated iFFL process to analyze the feasibility of the whole system, modify the model, and guide the wet experiments based on the model analysis results.

To facilitate calculation, in the following model, we assume that there is an adequate supply of RNA polymerase, ribosome and energy.

Models of transcription and translation in prokaryotes:

According to the Michaelis-Menten equation [5], we have known:

$$ v_0=\frac{V_{max}\left[ S \right]}{K_m+\left[ S \right]} $$

We can describe the transcription and translation processes in prokaryotic cells [5].

$$ \begin{aligned} \frac{d}{dt}\left[ m \right] &=K_{cat,m}[P]\frac{\left[ E \right]}{K_{M,E}+\left[ E \right]}-K\left[ R_{nase} \right] \frac{\left[ m \right]}{K_{M,m}+\left[ m \right]}\\ &\approx K_{cat,m}\left[ P \right] -K_{deg,m}\left[ m \right] \left( K_{M,E}\ll \left[ E \right] ,K_{M,m}\gg \left[ m \right] ,\frac{K\left[ R_{nase} \right]}{K_{M,m}}=K_{deg,m} \right)\\ \end{aligned}\,\,\,\, \left( 1 \right) $$

Where $\left[ m \right] $ is the concentration of transcribed mRNA, $\left[ P \right] $ is the promoter concentration, $\left[ E \right] $ is the concentration of intracellular RNA polymerase, $ \left[ R_{nase} \right] $ is the concentration of RNAase, $ K_{M,E} $ and $ K_{M,m} $ are the Michaelis-Menten constants for transcription and mRNA degradation, $ K_{cat,m} $ is the catalytic constant of transcription and $ K $ is the catalytic constant of RNA degradation.

Since $ K_{M,E}\ll \left[ E \right] $ and $ K_{M,m}\gg \left[ m \right] $, we rewrite $ \frac{K\left[ R_{nase} \right]}{K_{M,m}} $ as the constant $ K_{deg,m} $ to obtain the above equation.

$$ \begin{aligned} \frac{d}{dt}\left[ Y \right] &=K_{cat,p}[m]\frac{\left[ R_0 \right]}{K_{M,R}+\left[ R_0 \right]}-K\left[ R_{deg} \right] \frac{\left[ Y \right]}{K_{M,Y}+\left[ Y \right]}\\ &\approx K_{cat,p}\left[ m \right] -K_{deg,p}\left[ Y \right] \left( K_{M,R}\ll \left[ R_0 \right] ,K_{M,Y}\gg \left[ Y \right] ,\frac{K\left[ R_{deg} \right]}{K_{M,Y}}=K_{deg,p} \right)\\ \end{aligned}\,\,\,\, \left( 2 \right) $$

Where $ \left[ Y \right] $ is the intracellular target protein concentration, $ [m] $ is the mRNA concentration, $ \left[ R_0 \right] $ is the intracellular ribosome concentration, $ \left[ R_{deg} \right] $ is the protease concentration, $ K_{M,R} $ , and $ K_{M,Y} $ are the Michaelis-Menten constants for transcription and protein degradation, $ K_{cat,p} $ is the catalytic constant of translation and K is the catalytic constant of protein degradation.

Similarly, since $ K_{M,R}\ll \left[ R_0 \right] $ and $ K_{M,Y}\gg \left[ Y \right] $, the above simplified ordinary differential equation is obtained by rewriting $ \frac{K\left[ R_{deg} \right]}{K_{M,Y}} $ as the constant $ K_{deg,p} $.

When the cell growth is stable, the intracellular RNA and protein contents remain relatively stable. Based on the above ordinary differential equations, we can derive the concentrations of RNA and protein $ \left( \left[ m \right] _{SS}, \left[ Y \right] _{SS} \right) $ after the cell growth is stabilized as follows:

$$ \begin{array}{c} \left[ m \right] _{SS}=\frac{K_{cat,m}}{K_{deg,m}}\left[ P \right] \tag{3}\\ \end{array} $$ $$ \left[ Y \right] _{SS}=\frac{K_{cat,P}}{K_{deg,P}}\left[ m \right] _{SS}\tag{4} $$ $$ \therefore \mathrm{ }\left[ Y \right] _{SS}=\frac{K_{cat,m}}{K_{deg,m}}\cdot \frac{K_{cat,P}}{K_{deg,P}}\left[ P \right] \tag{5} $$
..
3. Models without Leakage

First, we wish to simulate the complete iFFL process and explore the feasibility of using the CRISPR-CasF system as a repressor in the iFFL process.

However, since we still do not know much about CasF, we decided to model CasF using dCas9, the most commonly used CRISPRi system. Existing studies have measured the metrics of dCas9, which will facilitate our modeling.

The complete iFFL regulatory process concerning target gene expression is shown below.
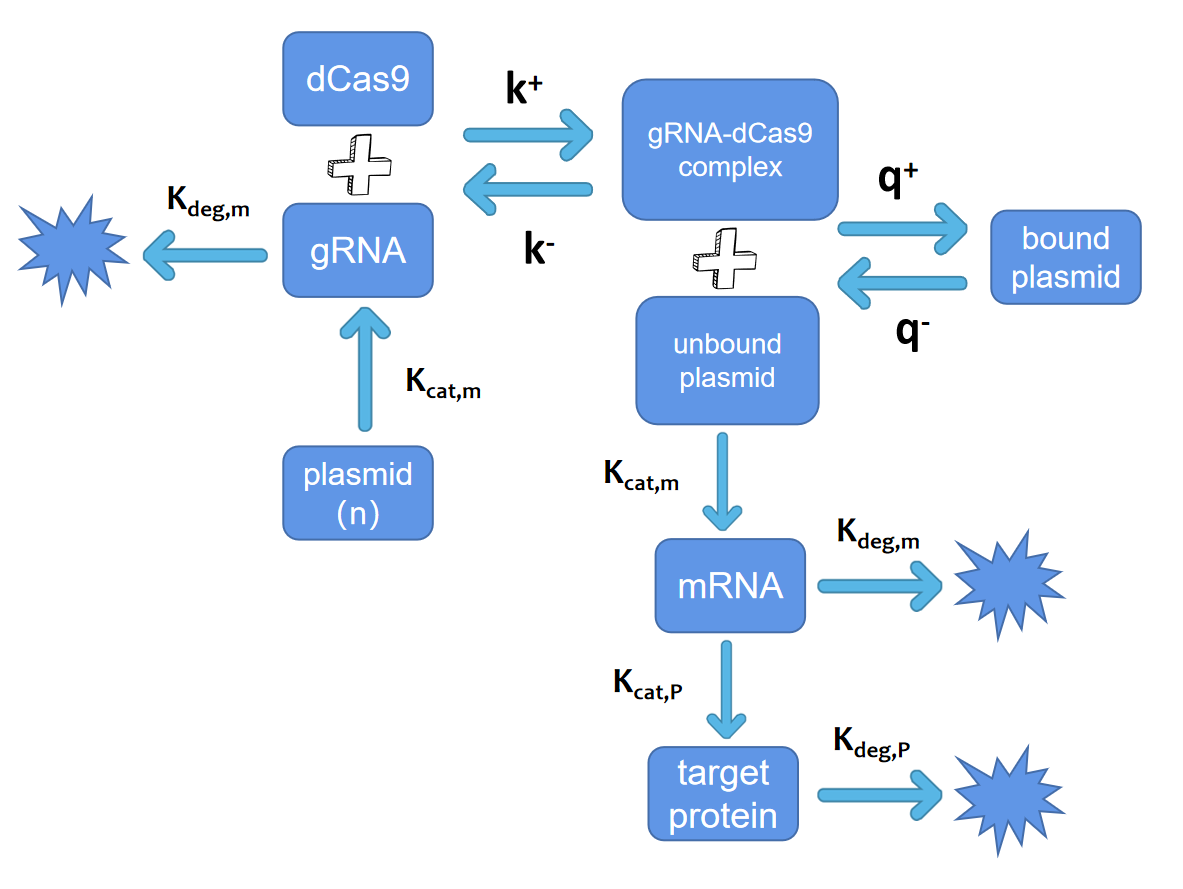
Fig. 3. Elucidation of the primary reactions in iFFL system

The above process is expressed in the assumption that we use the following ordinary differential equation:

$$ \frac{d}{dt}\left[ g \right] =\left[ n \right] u+K^-\left[ c \right] -K^+\left[ d \right] \left[ g \right] -\frac{K_{d,m}\left[ g \right]}{K_{M,m}+\left[ g \right]}\tag{6} $$ $$ \frac{d}{dt}\left[ c \right] =K^+\left[ d \right] \left[ g \right] -K^-\left[ c \right] +q^-\left[ C \right] -q^+\left[ c \right] \left[ D \right] \approx K^+\left[ d \right] \left[ g \right] -K^-\left[ c \right] \tag{7} $$ $$ \frac{d}{dt}\left[ C \right] =q^+\left[ c \right] \left[ D \right] -q^-\left[ C \right] \tag{8} $$ $$ \begin{aligned} \frac{d}{dt}\left[ m \right] &=\frac{K_{cat,m}\left[ D \right] \left[ E_{70} \right]}{K_{M,70}+\left[ E_{70} \right]}-\frac{K_{d,m}\left[ m \right]}{K_{M,m}+\left[ m \right]}\\ &\approx K_{cat,m}\left[ D \right] -K_{deg,m}\left[ m \right] \left( K_{M,70}\ll \left[ E_{70} \right] ,\mathrm{ }K_{M,m}\gg \left[ m \right] \right)\\ \end{aligned}\tag{9} $$ $$ \frac{d}{dt}\left[ Y \right] =\frac{K_{cat,P}\left[ m \right] \left[ R_0 \right]}{K_{M,R}+\left[ R_0 \right]}-K_{deg,p}\left[ Y \right] \approx K_{cat,P}\left[ m \right] -K_{deg,p}\left[ Y \right] \left( K_{M,R}\ll \left[ R_0 \right] \right) \tag{10} $$

Where $ \left[ n \right] $ is the plasmid concentration, $u$ is the gRNA transcription rate, $ \left[ d \right] $ is the dCas9 concentration, $ \left[ g \right] $ is the gRNA concentration, $ \left[ c \right] $ is the gRNA and dCas9 complex concentration, $ \left[ C \right] $ is the concentration of the Cas protein complex bound to the target sequence, $ \left[ D \right] $ is the unbound target gene concentration, $ \left[ m \right] $ is the mRNA concentration transcribed by target gene, $ \left[ Y \right] $ is the concentration of the target protein, $ K_{d,m}=K\left[ R_{nase} \right] $, $ k^+ $ and $ k^- $ are decomposition and binding rate of gRNA and Cas protein, $ q^+ $ and $ q^- $ are are decomposition and binding rate of gRNA-Cas complex and target sequence.

According to our definition:

$$ \left[ n \right] =\left[ D \right] +\left[ C \right] \tag{11} $$ $$ \left[ D \right] =\left[ P \right] \tag{12} $$

When the cell growth is stable, the gRNA concentration, gRNA-dCas9 complex concentration, gRNA-dCas9 complex and target gene binder concentration, unbound target gene concentration, mRNA concentration, and target protein concentration all reach a steady-state. Solving equations $ (6) $ and $ (7) $:

$$ \left[ c \right] =\frac{\left[ d \right] \left[ g \right]}{K}\tag{13} $$ $$ \left[ C \right] =\frac{\left[ d \right] \left[ g \right] \left[ D \right]}{KQ}\tag{14} $$

Where $ K=\frac{k^+}{k^-},Q=\frac{q^+}{q^-} $.

Relating to equation $ (10) $, it follows that:

$$ \left[ D \right] =\frac{\left[ n \right]}{1+\frac{\left[ d \right] \left[ g \right]}{KQ}}\tag{15} $$

Taking equation $(11)$ back to equation $(5)$:

$$ \frac{d}{dt}\left[ g \right] =\left[ n \right] u-\frac{K_{d,m}\left[ g \right]}{K_{M,m}+\left[ g \right]}\tag{16} $$

Solving this equation, we get:

$$ \left[ g \right] _{SS}=\frac{\left[ n \right] u}{K_{deg,m}}\tag{17} $$

Substituting equation $(15)$ into equation $(13)$:

$$ \left[ D \right] _{SS}=\frac{\left[ n \right]}{1+\frac{\left[ d \right] \left[ n \right] u}{KQK_{deg,m}}}=\frac{1}{\frac{1}{\left[ n \right]}+\frac{\left[ d \right] u}{KQK_{deg,m}}}\tag{18} $$

Substituting equation $(16)$ into equation $(13)$, the final stable concentration of the target protein:

$$ \left[ Y \right] _{SS}=\frac{K_{cat,m}}{K_{deg,m}}\cdot \frac{K_{cat,P}}{K_{deg,P}}\left[ D \right] =\frac{K_{cat,m}}{K_{deg,m}}\cdot \frac{K_{cat,P}}{K_{deg,P}}\cdot \frac{1}{\frac{1}{\left[ n \right]}+\frac{\left[ d \right] u}{KQK_{deg,m}}}\,\tag{19} $$
..
4. Model with Leakage

The above model is based on the assumption that CRISPRi can inhibit the expression effect of all target genes in the cell. But according to the existing findings [5], the binding of Cas proteins to target sequences in the CRISPR/Cas system is not 100% effective, and there are usually 0% - 20% of targeting sequences will escape Cas protein binding and remain in standard form. This proportion of escaped targeting sequences we call the leakage rate ($\alpha$).

Once we have taken the leakage rate into account in our model, we need to change the original model. And the main point of change is in equation $(9)$:

$$ \begin{aligned} \frac{d}{dt}\left[ m \right] &=\left( 1-\alpha \right) \cdot \frac{K_{cat,m}\left[ D \right] \left[ E_{70} \right]}{K_{M,70}+\left[ E_{70} \right]}-\frac{K_{d,m}\left[ m \right]}{K_{M,m}+\left[ m \right]}+\alpha \cdot \frac{K_{cat,m}\left( \left[ n \right] -\left[ D \right] \right) \left[ E_{70} \right]}{K_{M,70}+\left[ E_{70} \right]}\\ &\approx K_{cat,m}\left\{ \left( 1-\alpha \right) \cdot \left[ D \right] +\alpha \cdot \left[ n \right] \right\} -\frac{K_{d,m}\left[ m \right]}{K_{M,m}}\mathrm{ }\left( K_{M,70}\ll \left[ E_{70} \right] ,\mathrm{ }K_{M,m}\gg \left[ m \right] \right)\\ \end{aligned}\,\,\,\, \left( 20 \right) $$

Solving equation $(3)$ and $(19)$:

$$ \left[ m \right] _{SS}=\frac{K_{cat,m}}{K_{deg,m}}\left\{ \left( 1-\alpha \right) \cdot \frac{\left[ n \right]}{1+\frac{\left[ d \right] \left[ n \right] u}{KQK_{deg,m}}}+\alpha \cdot \left[ n \right] \right\} \tag{21} $$ $$ \left[ Y \right] _{SS}=\frac{K_{cat,m}}{K_{deg,m}}\cdot \frac{K_{cat,P}}{K_{deg,P}}\cdot \left\{ \left( 1-\alpha \right) \cdot \frac{\left[ n \right]}{1+\frac{\left[ d \right] \left[ n \right] u}{KQK_{deg,m}}}+\alpha \cdot \left[ n \right] \right\} \tag{22} $$
..
5. Modeling Results and Analysis

According to the unleaked model, the stable intracellular protein concentration remains somewhat correlated with copy number n. However, the association with copy number becomes weaker if the dCas9 concentration and gRNA transcription rate are more significant. We can understand that when the CRISPRi effect is more robust, the more the target gene expression is suppressed with increasing copy number, so the more the expression of the target protein is not positively correlated with the copy number.

To quantify how successful an iFFL is at reducing the impact of copy number, we calculate the stabilization error $ \mathrm{E} $ as the relative change in GOI expression as the copy number increases from a minimum copy number $ \left[ n \right] _{min} $ to \infty(engineered promoters enable constant gene expression at any copy number in bacteria):

$$ \mathrm{E}=\frac{\lim_{\left[ n \right] \rightarrow \infty} \!\:\left[ Y \right] _{SS}}{\lim_{\left[ n \right] \rightarrow \left[ n \right] _{min}} \!\:\left[ Y \right] _{SS}}-1=\frac{\frac{1}{\frac{\left[ \mathrm{d} \right] \mathrm{u}}{KQK_{deg,m}}}}{\frac{1}{\frac{1}{\left[ n \right] _{min}}+\frac{\left[ \mathrm{d} \right] \mathrm{u}}{KQK_{deg,m}}}}-1=\frac{KQK_{deg,m}}{\left[ \mathrm{d} \right] \mathrm{u}}\cdot \frac{1}{\left[ n \right] _{min}}\tag{23} $$

Thus, as $ \left[ \mathrm{d} \right] \cdot \mathrm{u} $ (the intensity of CRISPRi) increases, the stability of the target gene expression increases. However, enhancing the effect of CRISPRi decreases the expression of the target gene compared to the common expression process. The degree of reduction can be quantified using the calculation of the relative expression intensity $ \mathrm{S} $. $ \mathrm{S} $ is equal to the concentration of the target protein at the lowest copy number under iFFL regulation divided by the concentration of the target protein at the same copy number not regulated with iFFL:

$$ \mathrm{S}=\frac{\left[ \mathrm{Y} \right] _{\mathrm{SS}}^{\left[ \mathrm{n} \right] \rightarrow \left[ n \right] _{min}}}{\left[ \mathrm{Y} \right] _{\mathrm{SS}}^{\left[ \mathrm{n} \right] \rightarrow \left[ n \right] _{min},\mathrm{ }u=0}}=\frac{\frac{1}{\frac{1}{\left[ n \right] _{min}}+\frac{\left[ \mathrm{d} \right] \mathrm{u}}{KQK_{deg,m}}}}{\frac{1}{\frac{1}{\left[ n \right] _{min}}\mathrm{ }+0}}=\frac{KQK_{deg,m}}{KQK_{deg,m}+\left[ \mathrm{d} \right] \mathrm{u}\left[ \mathrm{n} \right] _{\min}}\tag{24} $$

According to the expression of $ \mathrm{S} $, it is known that the relative expression intensity $ \mathrm{S} $ decreases as $ \left[ \mathrm{d} \right] \cdot \mathrm{u} $ (intensity of CRISPRi) increases. Since both the target protein expression intensity and the stabilization error are essential in our experiments, we must carefully weigh between the target protein expression intensity and the stabilization error to choose the appropriate CRISPRi intensity.

..
6. Modeling Results

Based on the experiments in the literature and some reasonable hypotheses, we can obtain the parameters as shown following:

Parameters Value Units Reference
$K_{deg,P}$ $9.4\times 10^{-6}$ $s^{-1}$ [6]
$K_{deg,m}$ $8.25\times 10^{-4}$ $s^{-1}$ [4]
$K_{cat,m}$ $6.5\times 10^{-2}$ $s^{-1}$ [4]
$u$ $6.5\times 10^{-2}$ $s^{-1}$ [4]
$K_{cat,P}$ $6.0\times 10^{-3}$ $s^{-1}$ [4]
$d$ $0.001$ nM Set
$K$ $0.01$ nM [7]
$Q$ $0.5$ nM [8]
$\alpha$ $0.1$ Set

Table 1. parameter list

We plotted an image of the increase in target protein concentration with increasing copy number, assuming no energy supply constraints, no leakage of Cas protein binding, and a constant concentration of DNA, ribosomes, and various enzymes in the system, with the results shown below(one with iFFL, one without iFFL):

Fig. 4. Comparison of protein production with iFFL system or not

We can observe that in the absence of leakage, the final concentration of the target protein remains stable throughout. Our modeling results show that the idea of our experimental design is theoretically feasible in prokaryotes.

Fig. 5. Comparison of protein production with different CRISPRi leakage rate

Observations show that the presence of leakage will severely affect the effectiveness of the iFFL system. However, compared to the unregulated case, the iFFL system can also substantially reduce the protein concentration change and stabilize the protein concentration.

Reference

  • 1. Segall-Shapiro TH, Sontag ED, Voigt CA. Engineered promoters enable constant gene expression at any copy number in bacteria. Nat Biotechnol. 2018.
  • 2. Pausch P, Al-Shayeb B, Bisom-Rapp E, et al. CRISPR-CasΦ from huge phages is a hypercompact genome editor. Science. 2020.
  • 3. HOMMES FA. The integrated Michaelis-Menten equation. Arch Biochem Biophys. 1962.
  • 4. Marshall R, Noireaux V. Quantitative modeling of transcription and translation of an all-E. coli cell-free system. Sci Rep. 2019.
  • 5. Hsu PD, Scott DA, Weinstein JA, et al. DNA targeting specificity of RNA-guided Cas9 nucleases. Nat Biotechnol. 2013.
  • 6. https://2014.igem.org/Team:Waterloo/Math_Book/CRISPRi
  • 7. Wright AV, Sternberg SH, Taylor DW, et al. Rational design of a split-Cas9 enzyme complex. Proc Natl Acad Sci U S A. 2015.
  • 8. Sternberg SH, Redding S, Jinek M, Greene EC, Doudna JA. DNA interrogation by the CRISPR RNA-guided endonuclease Cas9. Nature. 2014.

Ackhowledgement

Contact Information