Team:GreatBay SZ/Model


Modeling
Modeling can help us better understand the process of the reaction and is a very powerful tool. With its help, we are able to simulate experiments by combining actual data results, reviewing literature, and making predictions of key parameters. In this way, we are able to quickly estimate the possible results of the reaction, thus saving a lot of time. Better still, we can use our model to optimize the experimental design plan and avoid unnecessary waste.
Optimization of experimental design
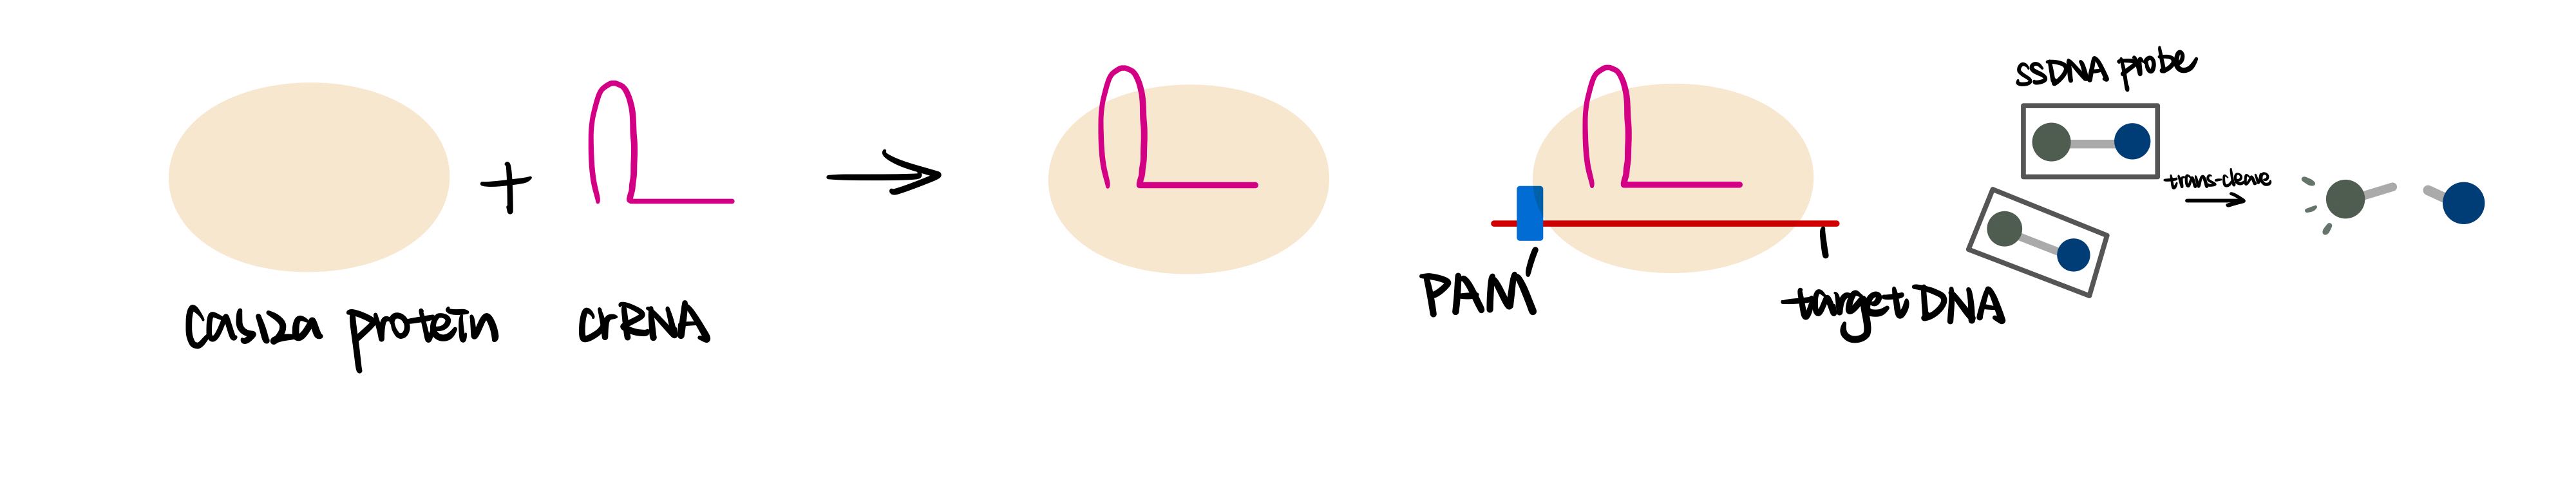
In our project, we used CRISPR Cas12a to detect the barcode, which is a segment of DNA in yeast spores. Using our kinetic data, we estimated the rate constants for the different reactions to create a simple ODE model. We use Michaelis-Menten equation to simulate the rate of reaction of the enzyme, and find out the best condition for Cas12a enzyme to react. After using Michaelis-Menten equation , we utilized the ordinary differential equation for every equation to display the relationship between concentration of substrate and the rate of reaction.
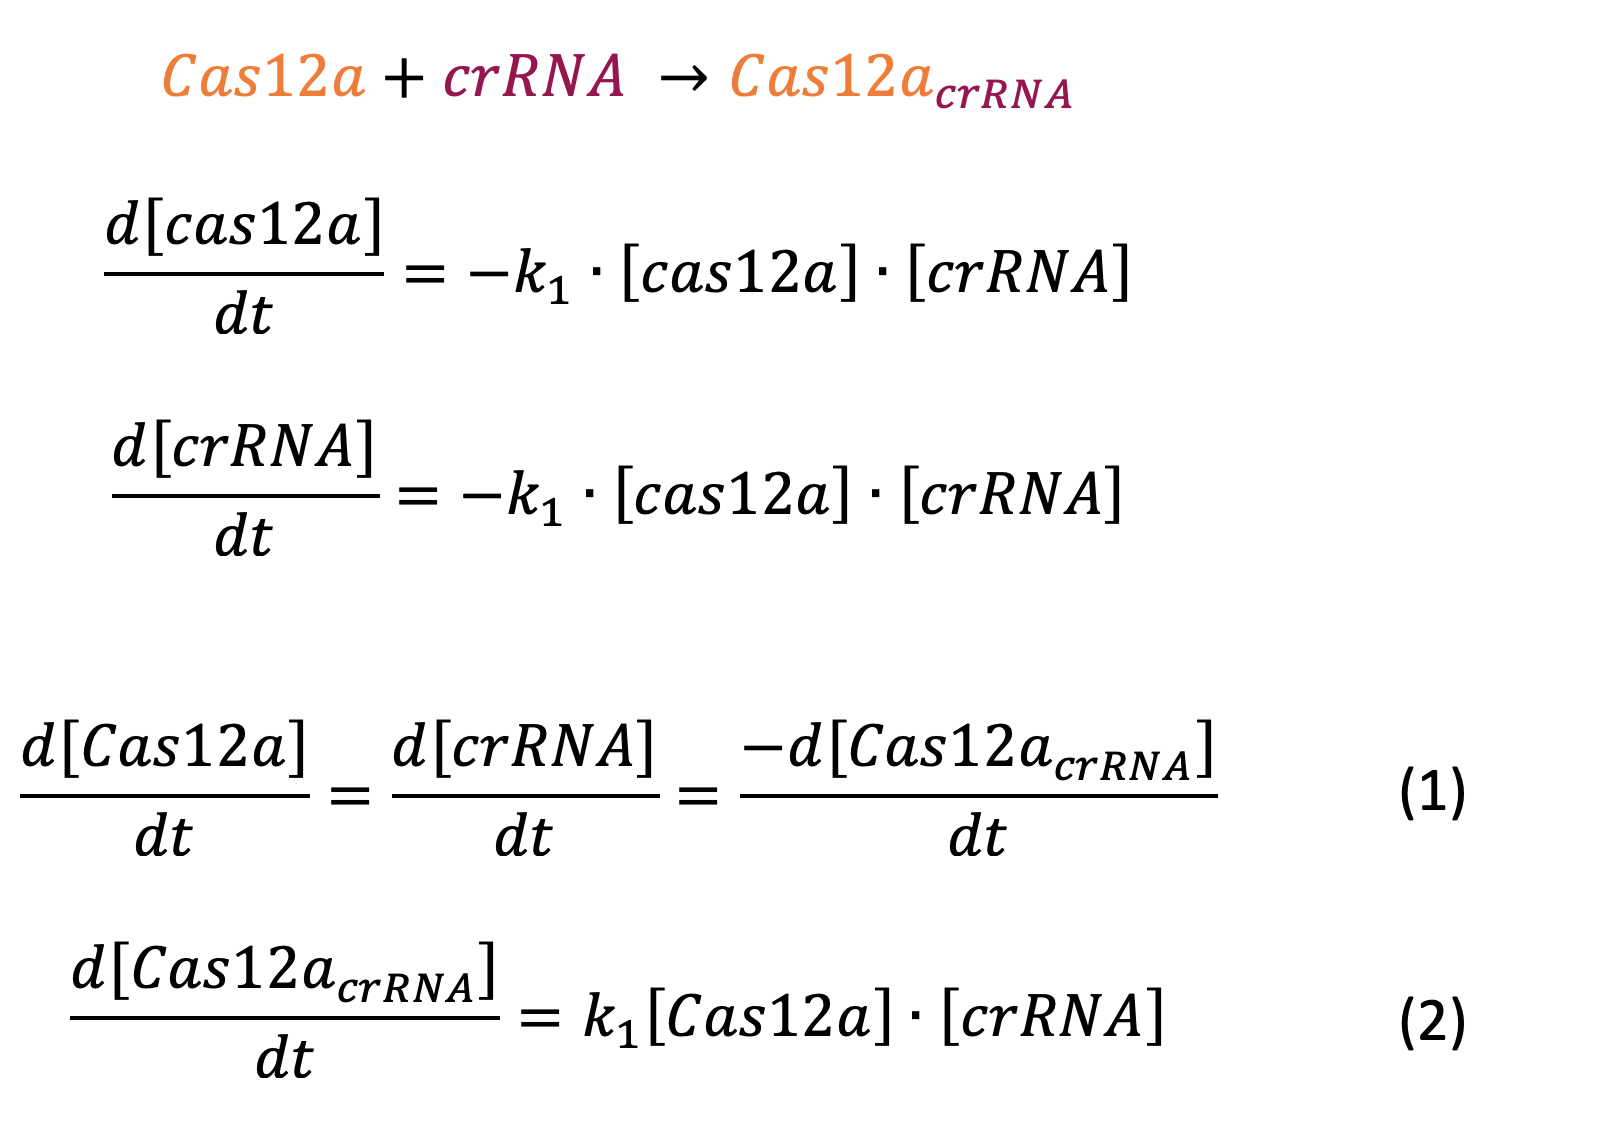
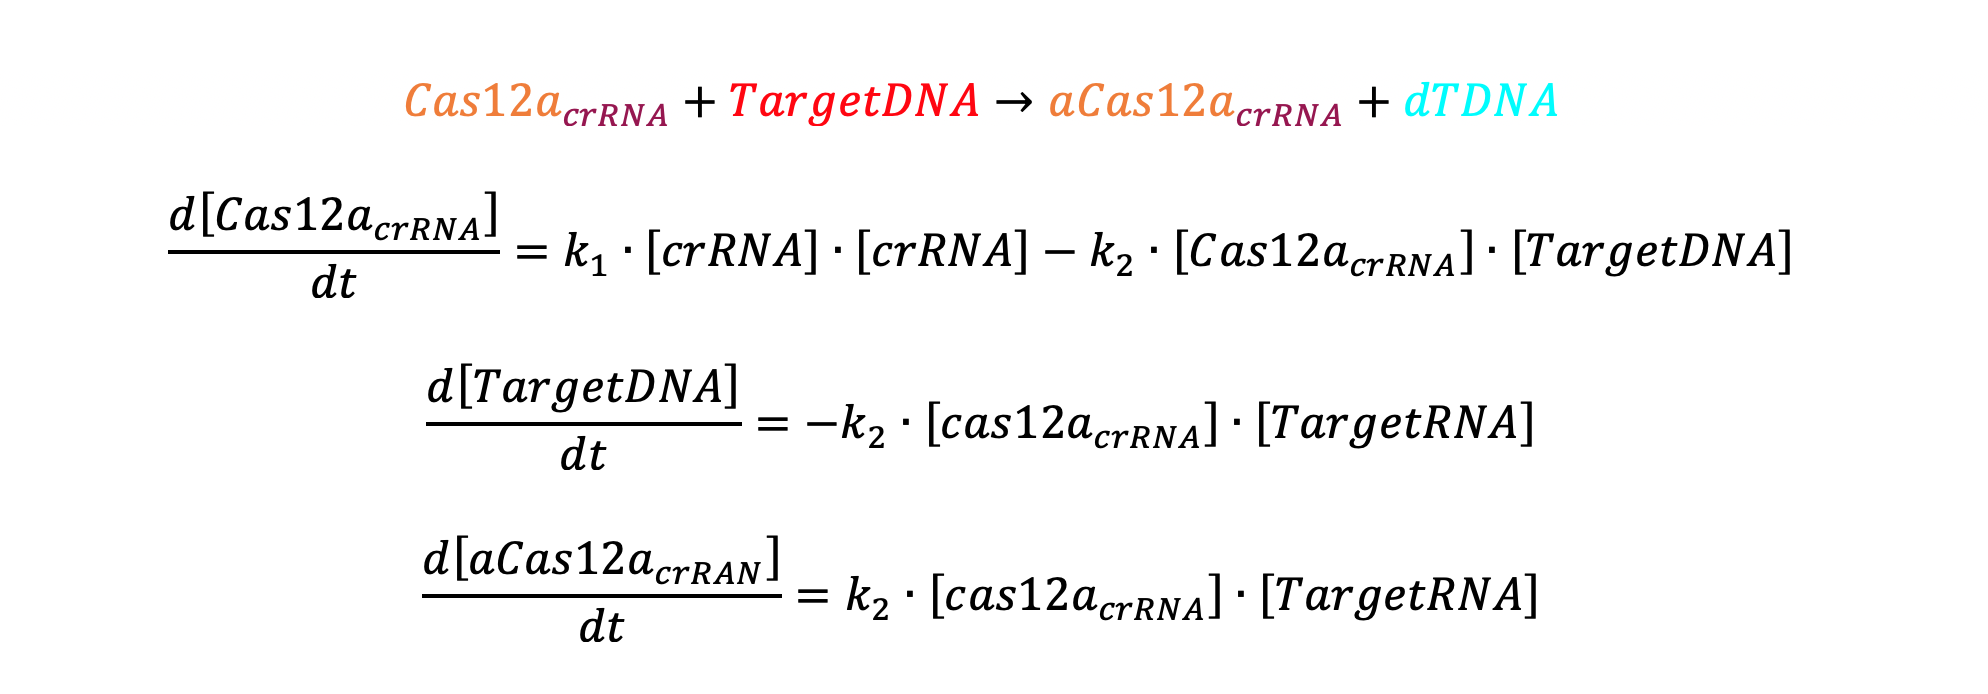
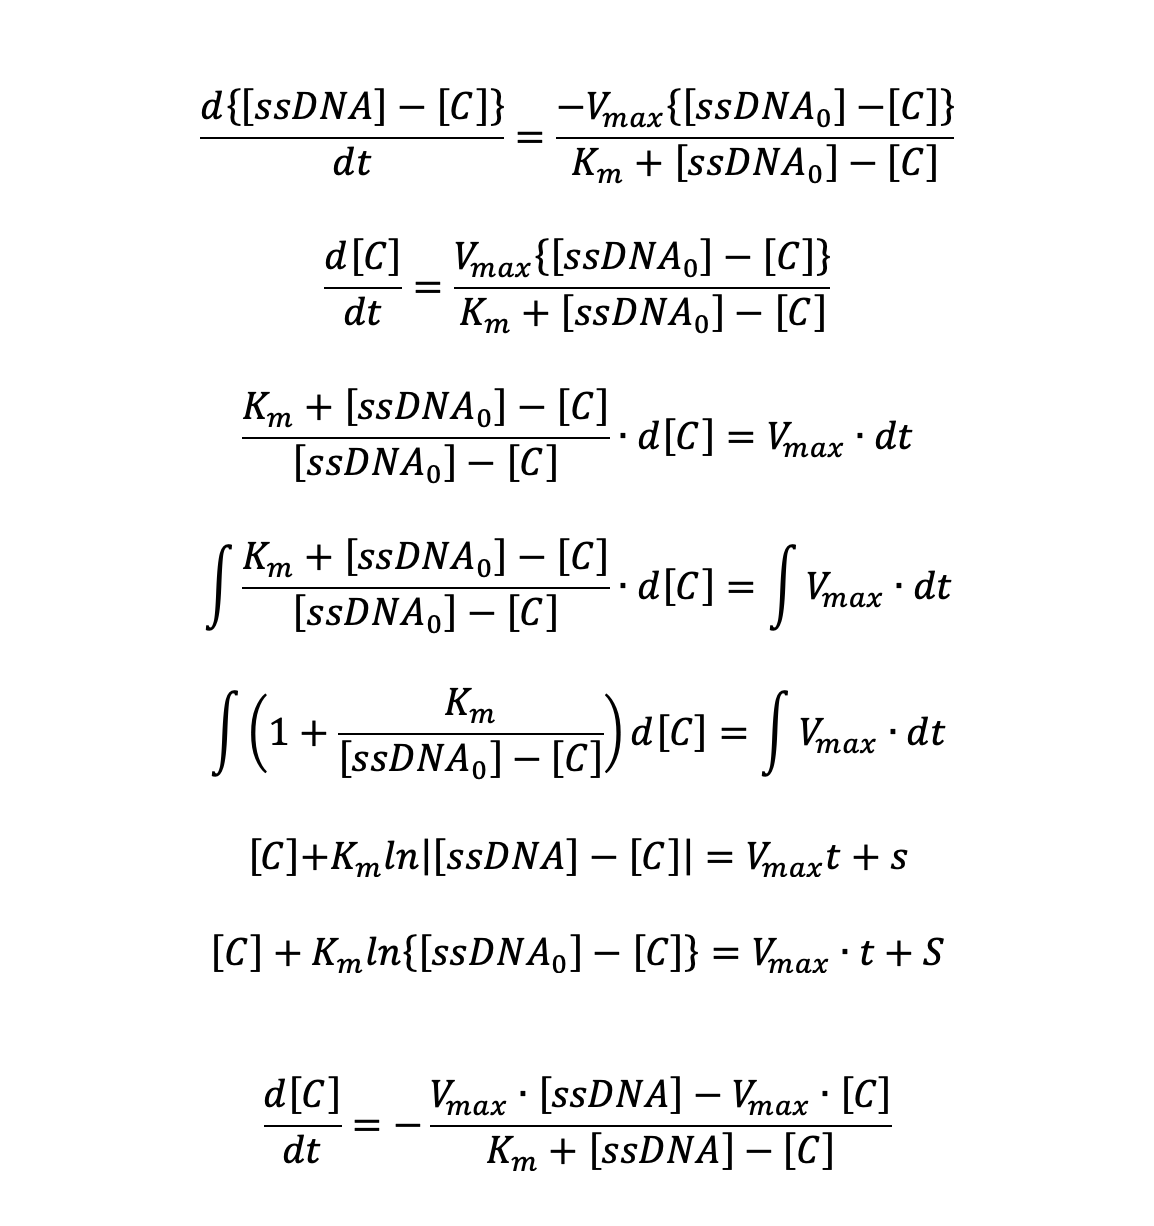
Chemical and differential equations are shown below:
The components of different colors in the reaction formula represent substances labeled with the same color during the reaction.
Reaction 1
Reaction 2
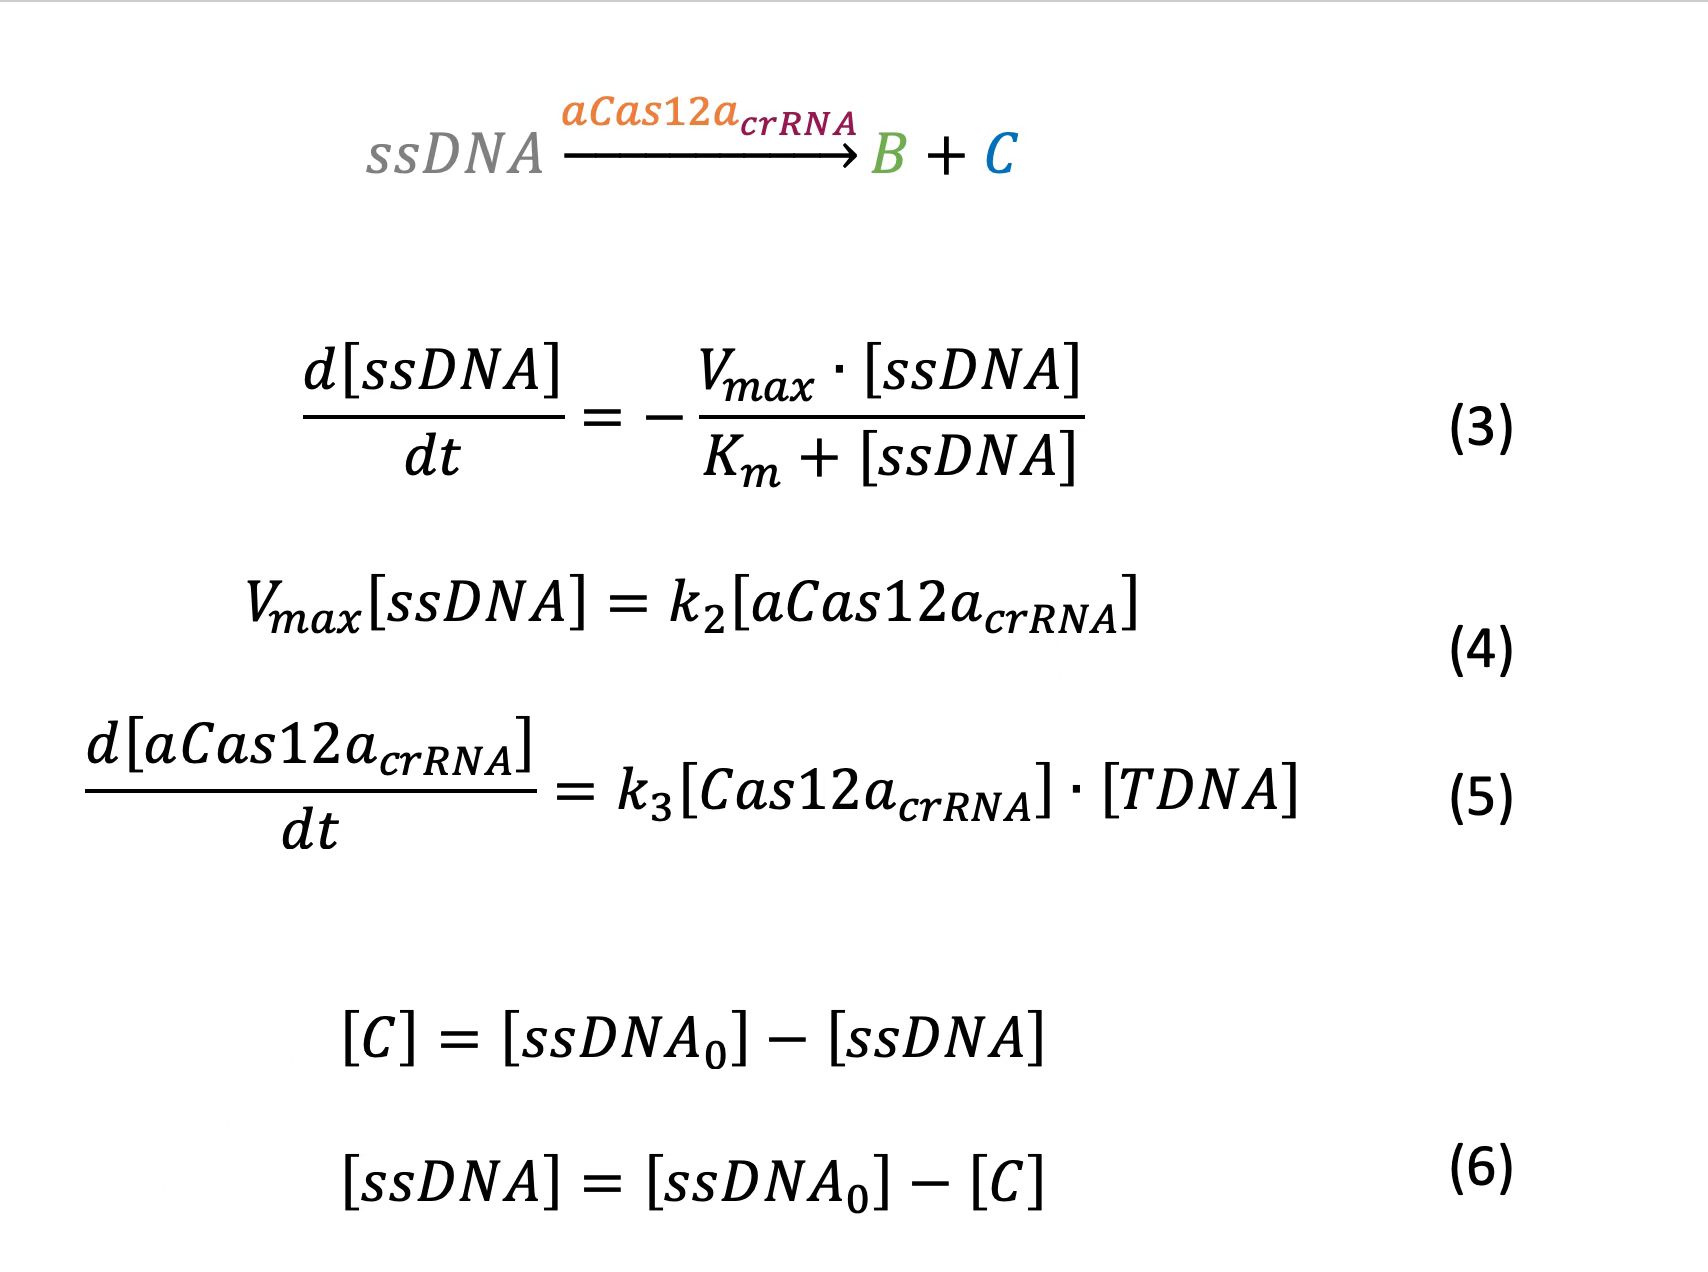
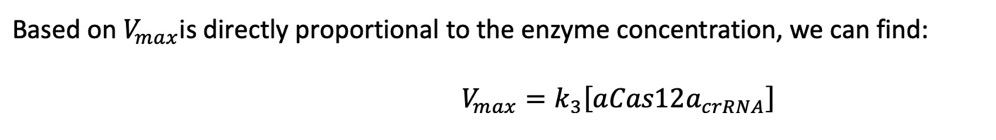
According to (3) and (6), we deduce that:
| rate constant | value | reference or rationale |
| K1 | 1.1(1/min) | Weitz et al., 2014. |
| K3 | 0.1(1/min) | Strohkendl, et al. 2018 |
Determine the value of Km
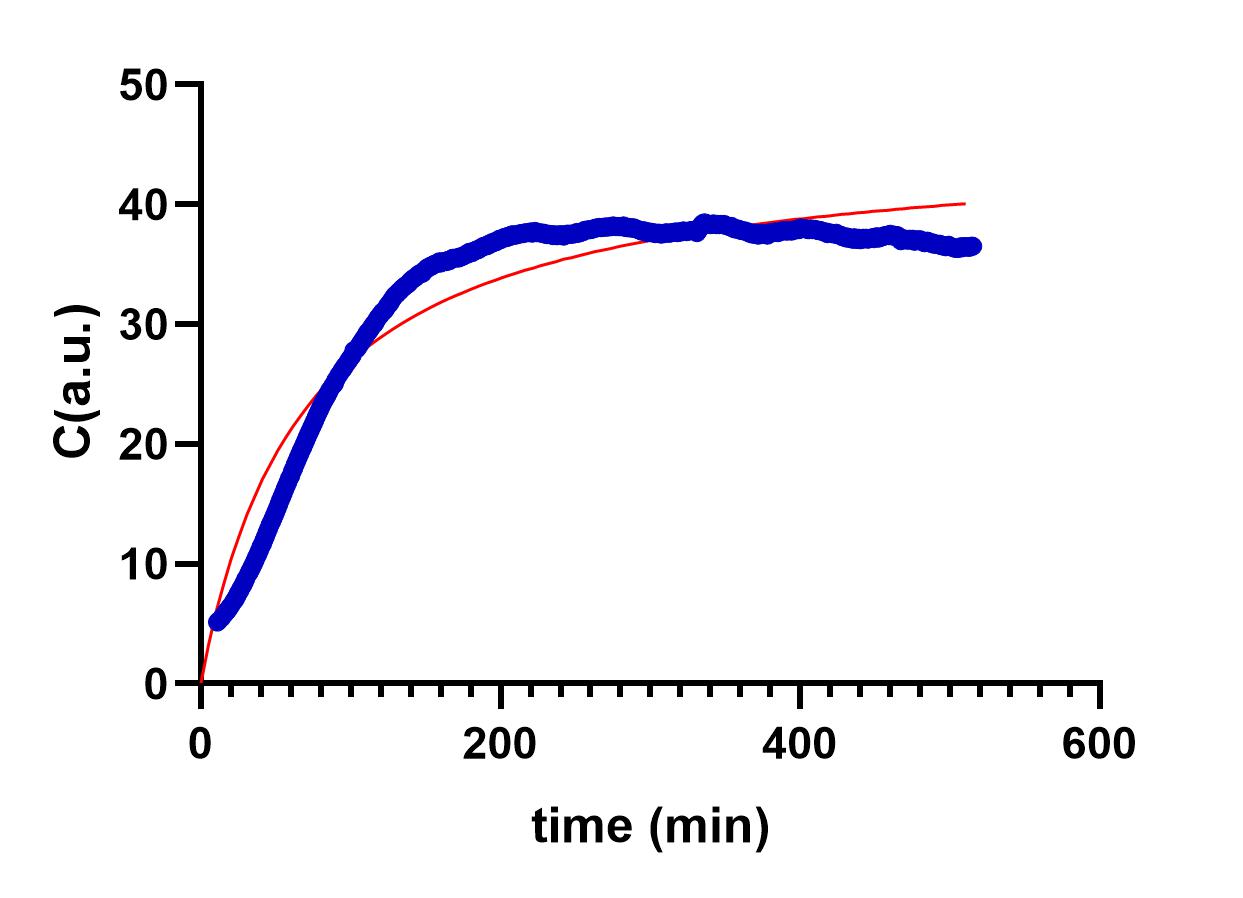
Based on the actual measurement data, we fitted the data by Michaelis equation and obtained Km value of about 28nM.
Determine the value of K2
According to the values of K1 and K3, which we found from articles, and the model from Munich[1][2], we find that the value of K2 is around 0.001.
In order to speculate the value of K2, we process out the equation using Matlab; and the graph below shows the
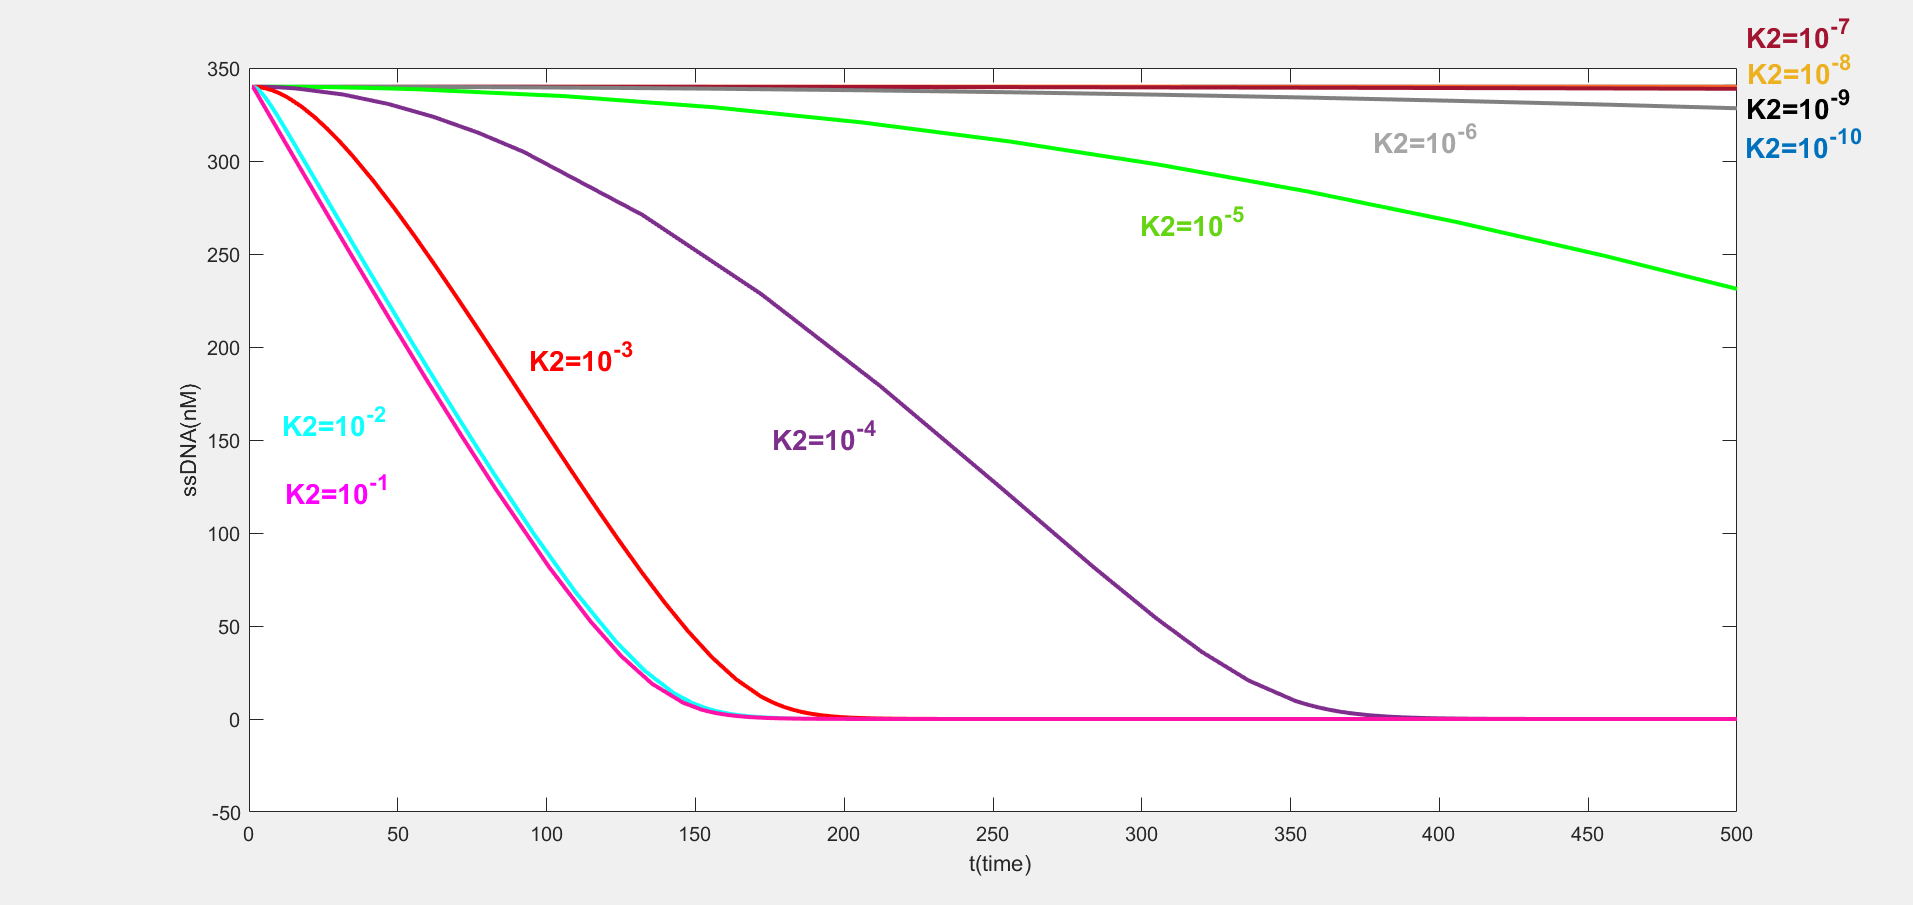
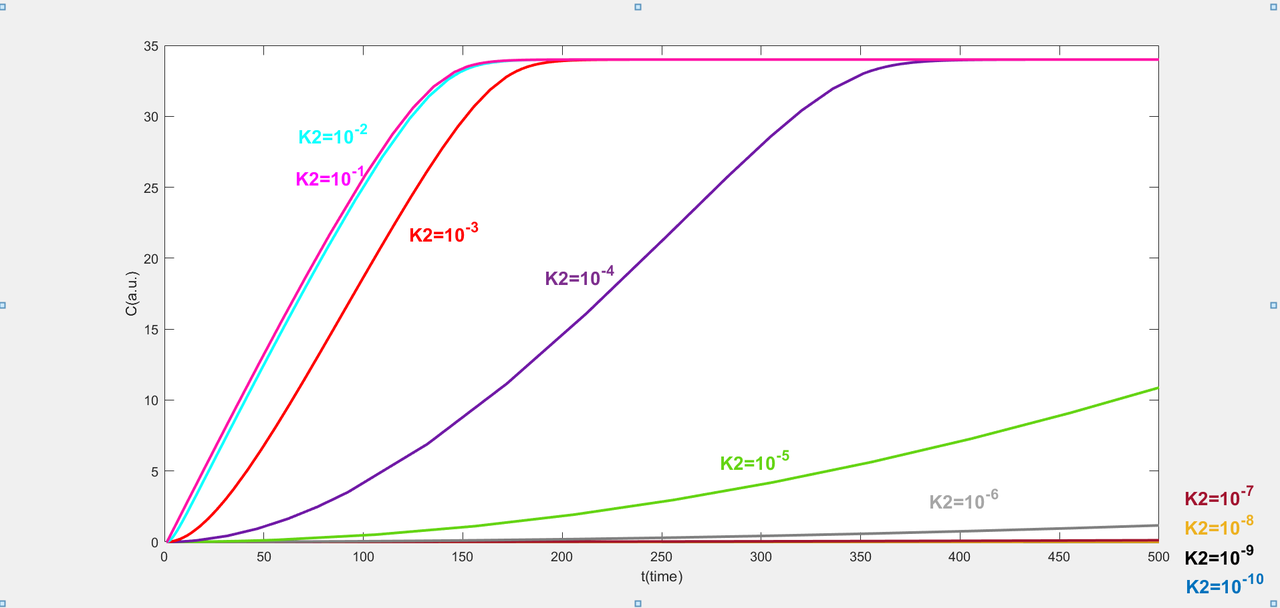
According to matlab, we find that the fluorescence values increase as K2 values increase. As the fluorescence intensity increases, ssDNA is consumed, so its concentration decreases. When K2 values are ten to the power of minus three, ten to the power of minus two and ten to the power of minus one, the shape of each curve tends to flatten out. But in our Cas12a fluorescence detection experiment, fluorescence values reach the platform period after 5000 cycles. The shape of curves of the different K2 values are very similar. In conclusion, when other conditions are held constant, the value of K2 may not have a significant effect on the modeling results. Therefore, we choose K2 to be 0.001 for the next data analysis.
Determine the concentration ratio of Cas12a, crRNA and target DNA
Next, the amount of crRNA we added is also a crucial factor that influences the Cas12a fluorescence detection. We select 13 values equidistantly between ten to the power of minus zero point five and ten to the power of minus three point five.
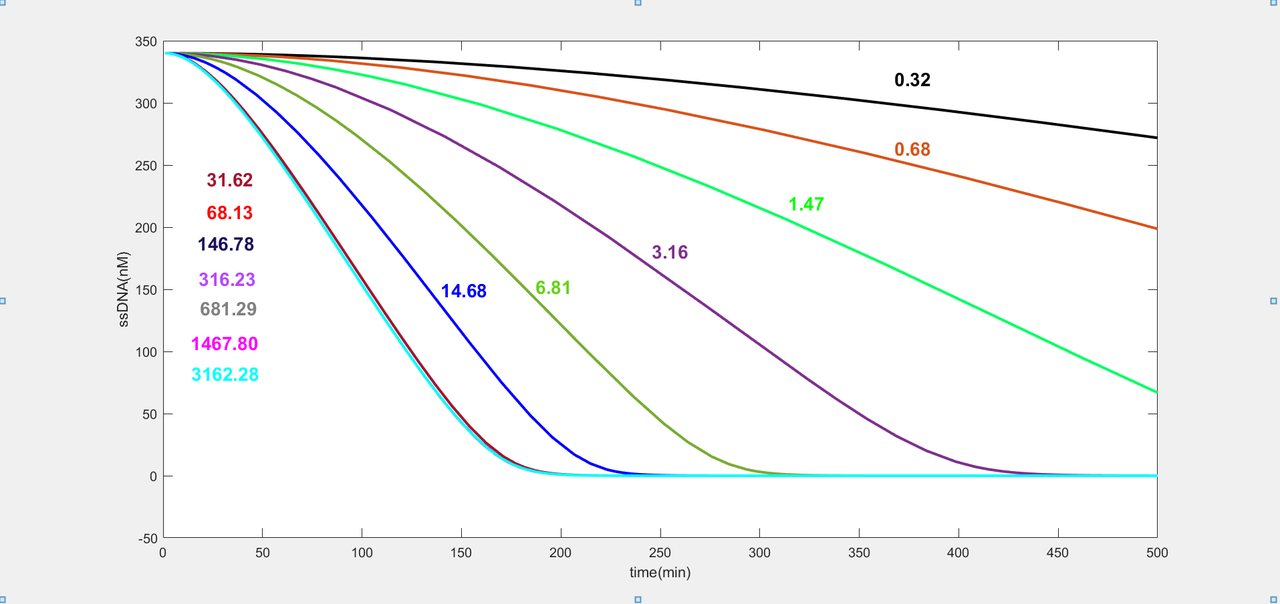
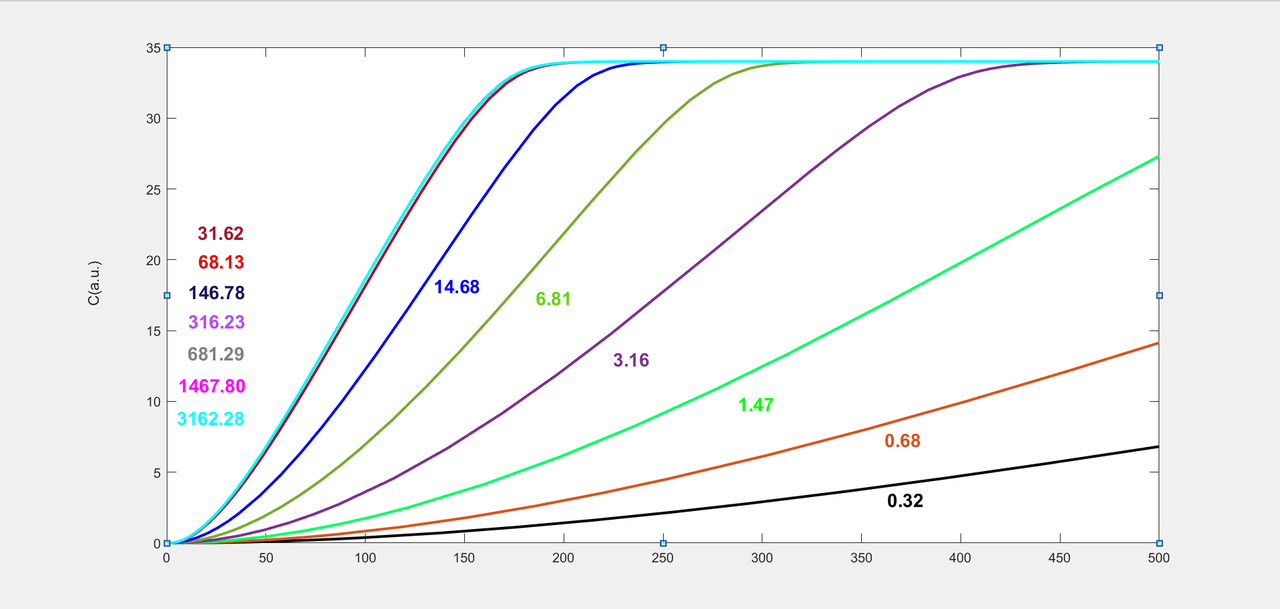
We find the conclusion from the graph. As the fluorescence intensity increases, ssDNA is consumed, so its concentration decreases. When the concentration of crRNA is lower than 31.62nM, the rate of fluorescence values increases as the concentration of crRNA increases. When the concentration of crRNA is higher than 31.62nM, the fluorescence value reaches the platform period. Therefore, it will no longer increase though the concentration of crRNA increases. So we speculate that an excessive increase in the concentration of crRNA is not the most efficient way to detection efficiency. On the other hand, this also increases the cost of our product. We deduce that when the concentration of Cas12a enzyme is 32nM, the concentration of target DNA is 3nM, 31.62nM may be a critical node for the initial concentration of crRNA. The concentration ratio of these three is 10: 10: 1.
In order to prove this deduction, we adjusted the concentration(1000nM) of crRNA that we used at the beginning of our experiment to 32nM and repeated the experiment without changing other conditions. From the result, we find that the rate of fluoresces does not have a significant decrease. This phenomenon is consistent with the expected results of the modelling.
In conclusion, by using dynamics data, we construct a set of mathematical models of fluorescence intensity with time which can be used in analyzing Cas12a detection efficiency. According to these models, the detection is most efficient and cheap when the concentration of ratio of Cas12a enzyme, crRNA and target DNA is 10: 10: 1. This scheme was also proven by our experiment.
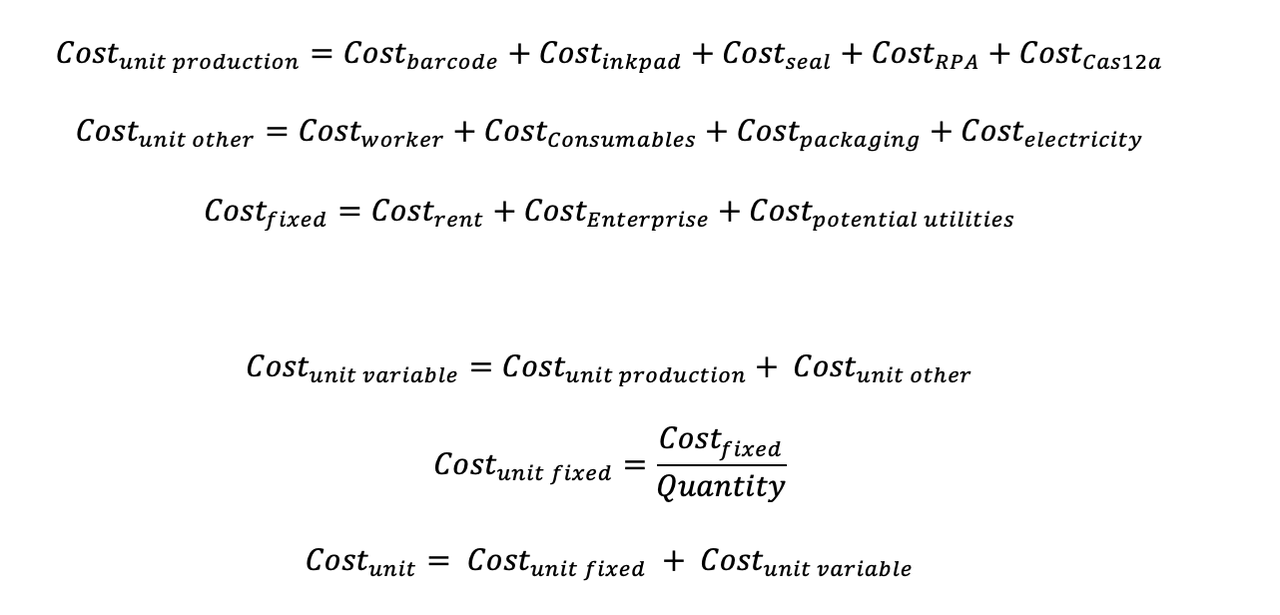
Constructive Cost Models
In addition, we also created two Constructive Cost Models to estimate the costs of two types of products. Click (entrepreneurship page) for more information.
Firstly, for the product that we sell to customers(2c), we estimate the cost for each ingredient (shows in the table below) and put them into the equation to find the total cost of spores using the equation below.
Personal customization - Self-test version
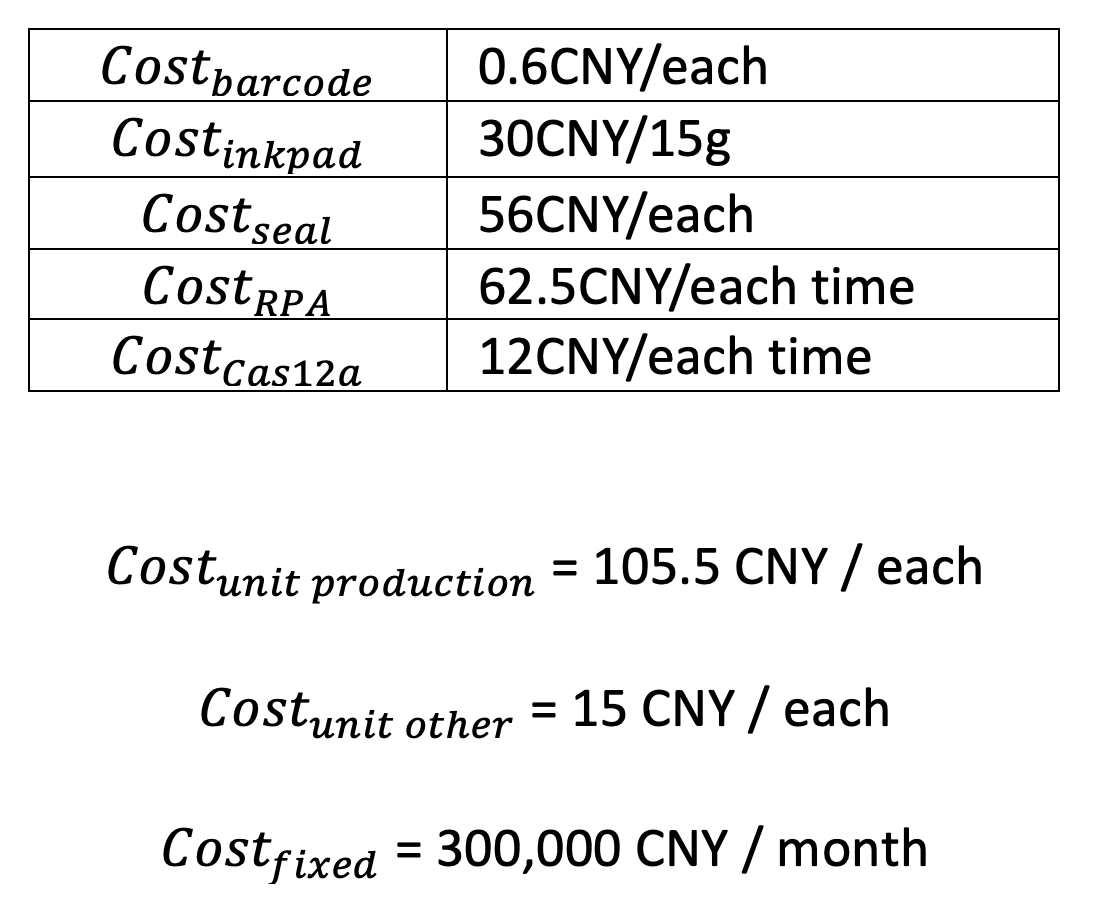
According to Constructive Cost Models, the cost of a whole set detective and tracing system (our product), which include producing spore and detection of barcodes, is 105.5CNY/each. The fixed cost for the company is 300,000CNY per month.
Next, we estimate the cost for batch production of spores. We use this type of production to reach the business cooperation. This can save the additional cost for business, as fixed and unit costs are lower.
Business cooperation – provide inkpad only
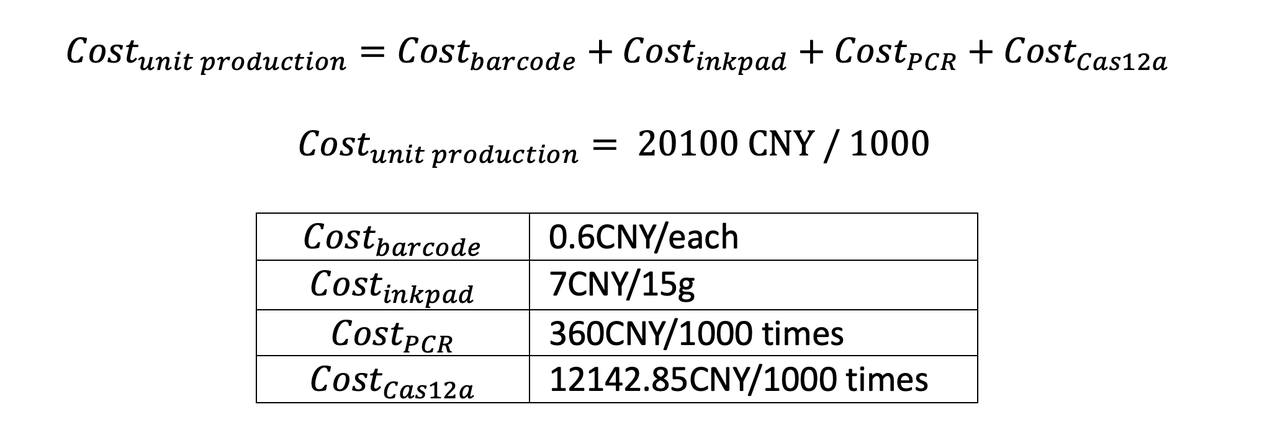
By using the data and model above, we estimate that the cost of producing and detecting 1000 spores is 20100CNY.
Reference
- Weitz, M., Kim, J., Kapsner, K., Winfree, E., Franco, E., & Simmel, F. C. (2014). Diversity in the dynamical behaviour of a compartmentalized programmable biochemical oscillator. Nature chemistry, 6(4), 295–302.https://doi.org/10.1038/nchem.1869
- Strohkendl, I., Saifuddin, F. A., Rybarski, J. R., Finkelstein, I. J., & Russell, R. (2018). Kinetic Basis for DNA Target Specificity of CRISPR-Cas12a. Molecular cell, 71(5), 816–824.e3.https://doi.org/10.1016/j.molcel.2018.06.043