Team:KUAS Korea/Model

Modeling
Introduction
We have devised a model that allows frogs to effectively respond to B.dendrobatidis by allowing the design E.coli to produce Violacein when frogs are exposed to B.dendrobatidis in normal life. Therefore, we selected the presence of light and the IPTG emitted after detecting the chitin of fungi as input to output that produces violacein. In order to model to produce violacein when both of these conditions are satisfied, the light induction model produces violacein A and the IPTG induction model produces violacein B,E, so that complete violacein is formed only when both conditions are satisfied. Through the two modeling, we checked how effectively the violacein A, B, and E can be produced under each condition.
1. Light induction Violacein modeling
Model overview
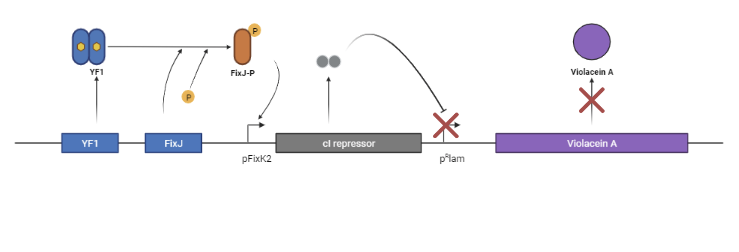
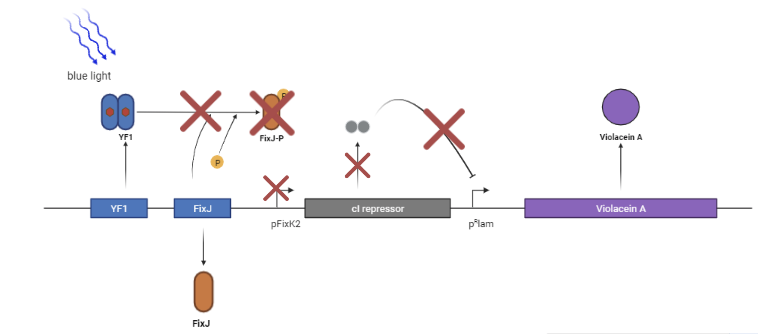
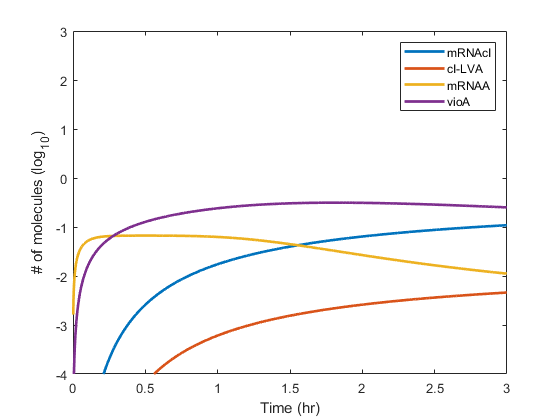
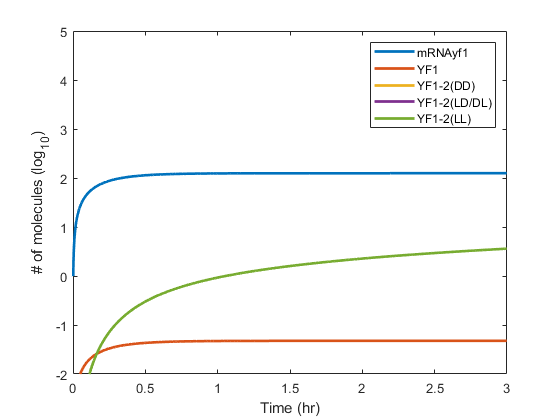
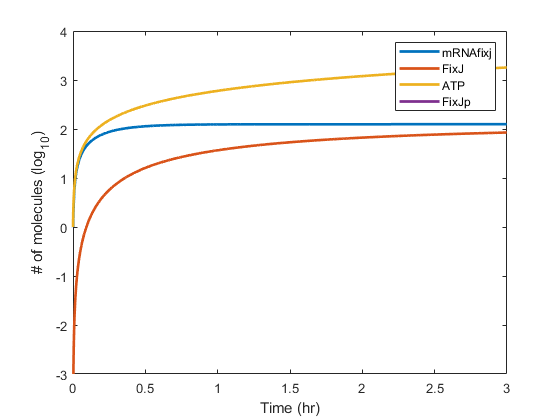
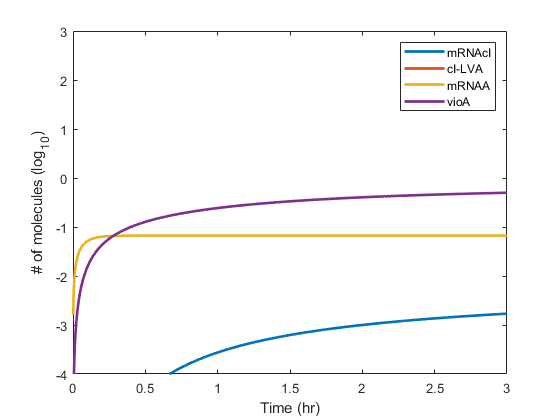
The key point of the light induction model is to effectively produce violacein A when exposed to blue light. Therefore, we selected YF1/FixJ as an optogenetic system for blue light, but YF1/FixJ inhibits expression when exposed to blue light, so we add cI repressors and pRlam promoter regulated by cI repressors as an inverter. Finally, light induction model express violacein A progresses when exposed to blue light.
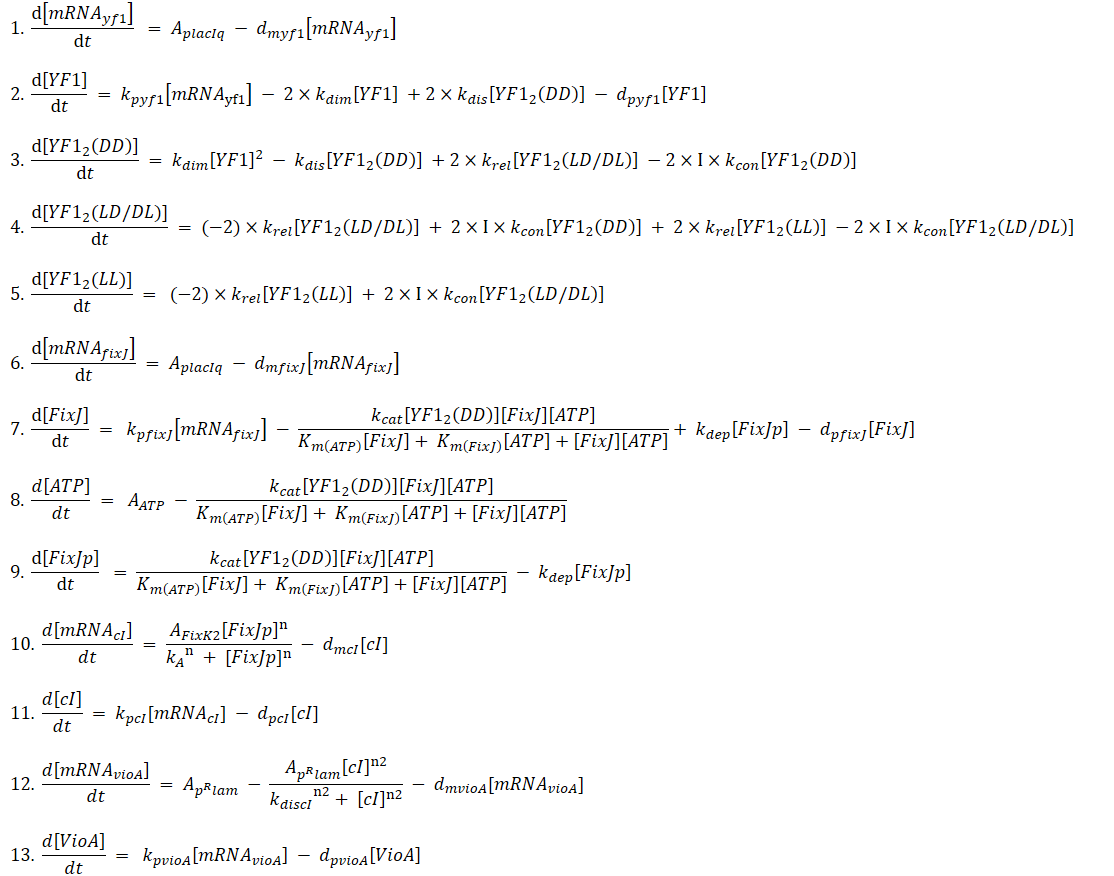
ODEs of light induction violacein model
Results
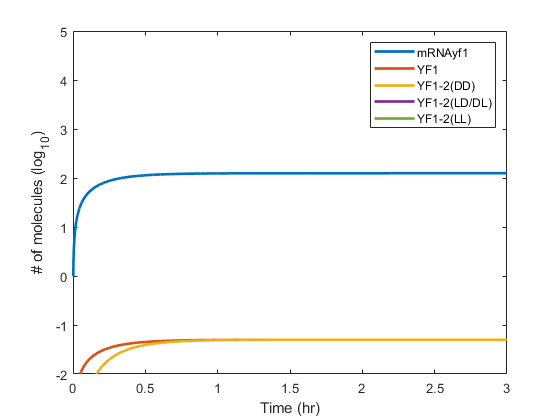
1) No Blue light (I=0)
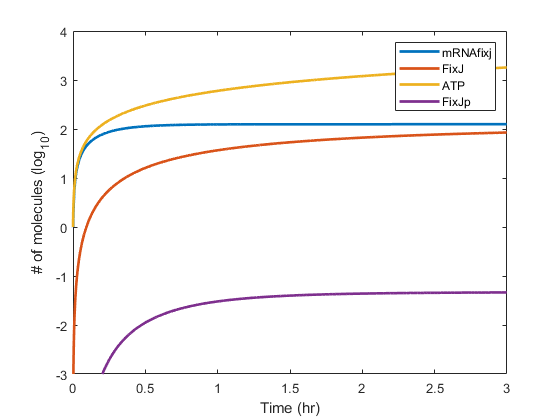
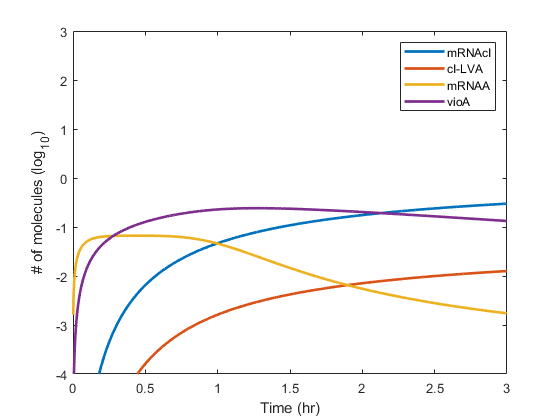
2) Small intensity of Blue light (I=1)
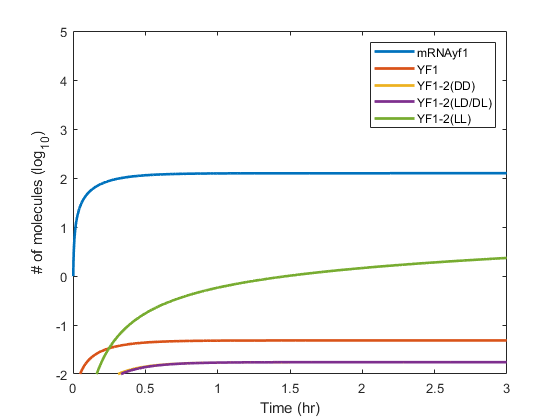
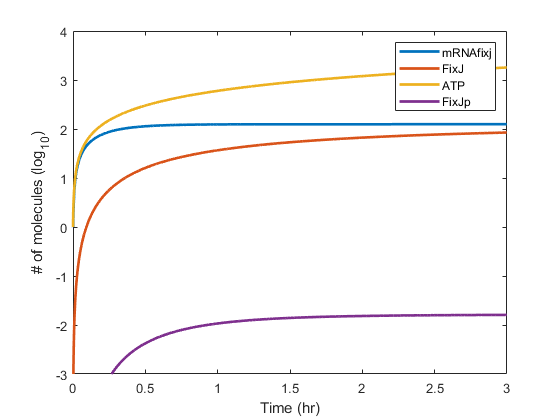
3) Large intensity of Blue light (I=100)
Parameters & matlab codes
Model_Light_induction.zip2. IPTG induction Violacein modeling
Model overview
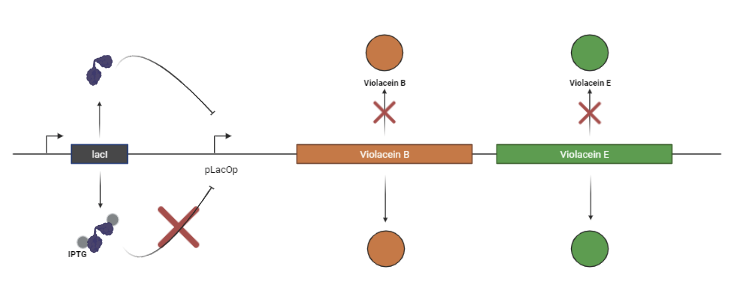
ODEs of IPTG induction violacein model
Simplification
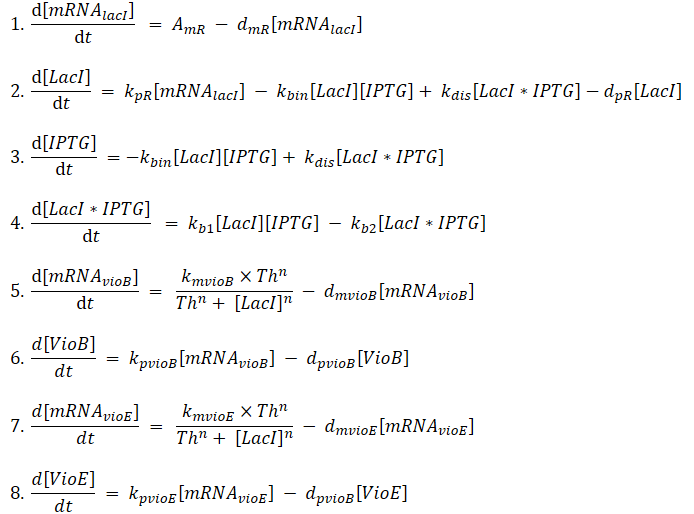
Complexity
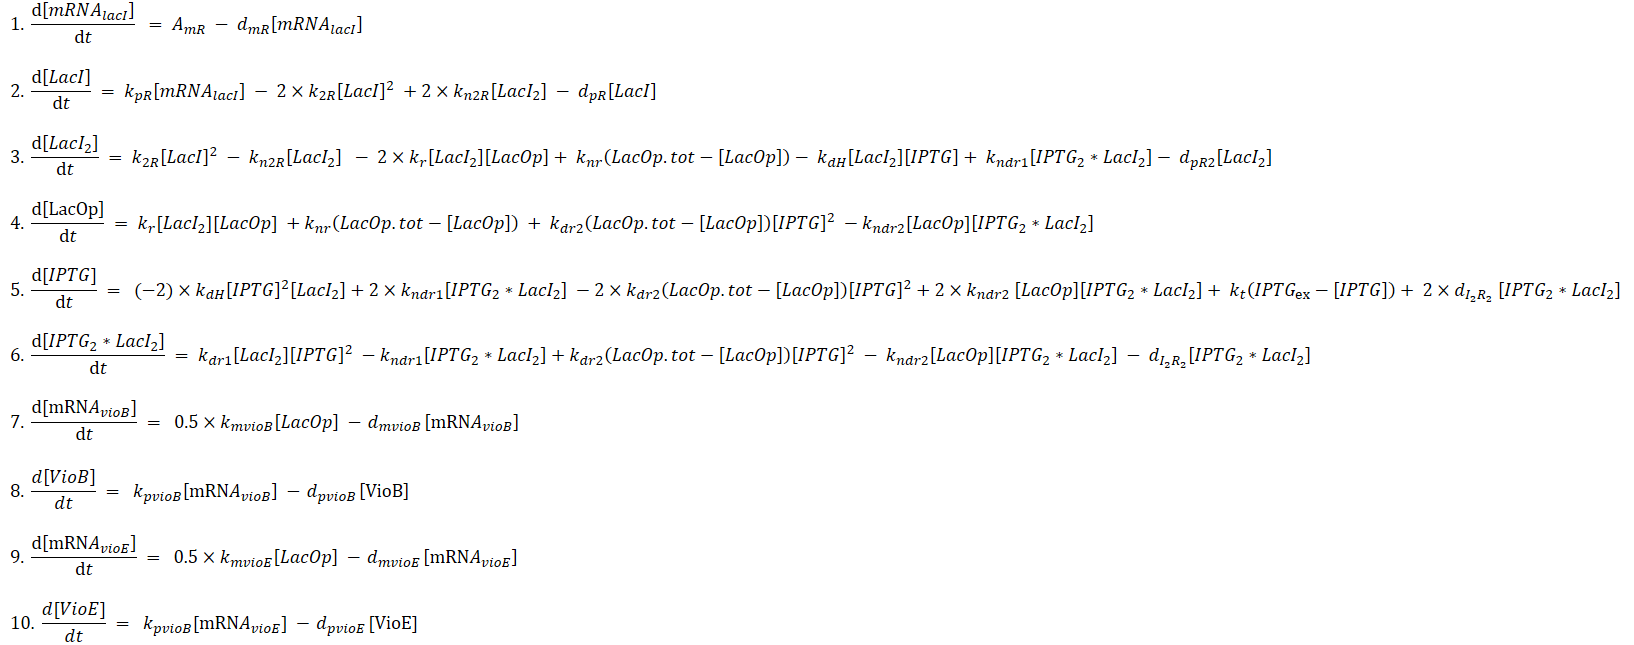
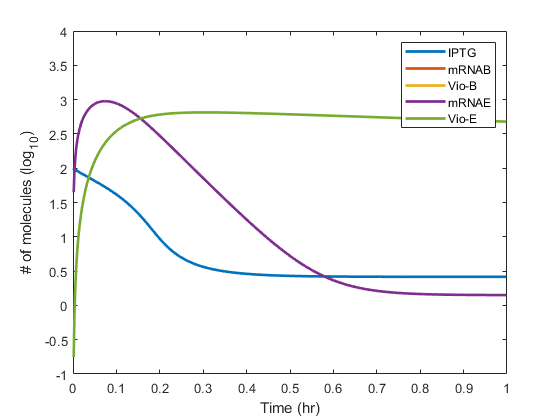
Results
Simplification
1) [IPTG]init=10
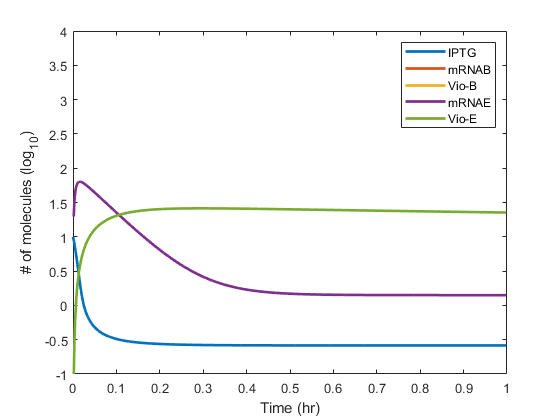
2) [IPTG]init=100
Complexity
Parameters & matlab code
Model_IPTG_induction.zip3. Kill switch construct
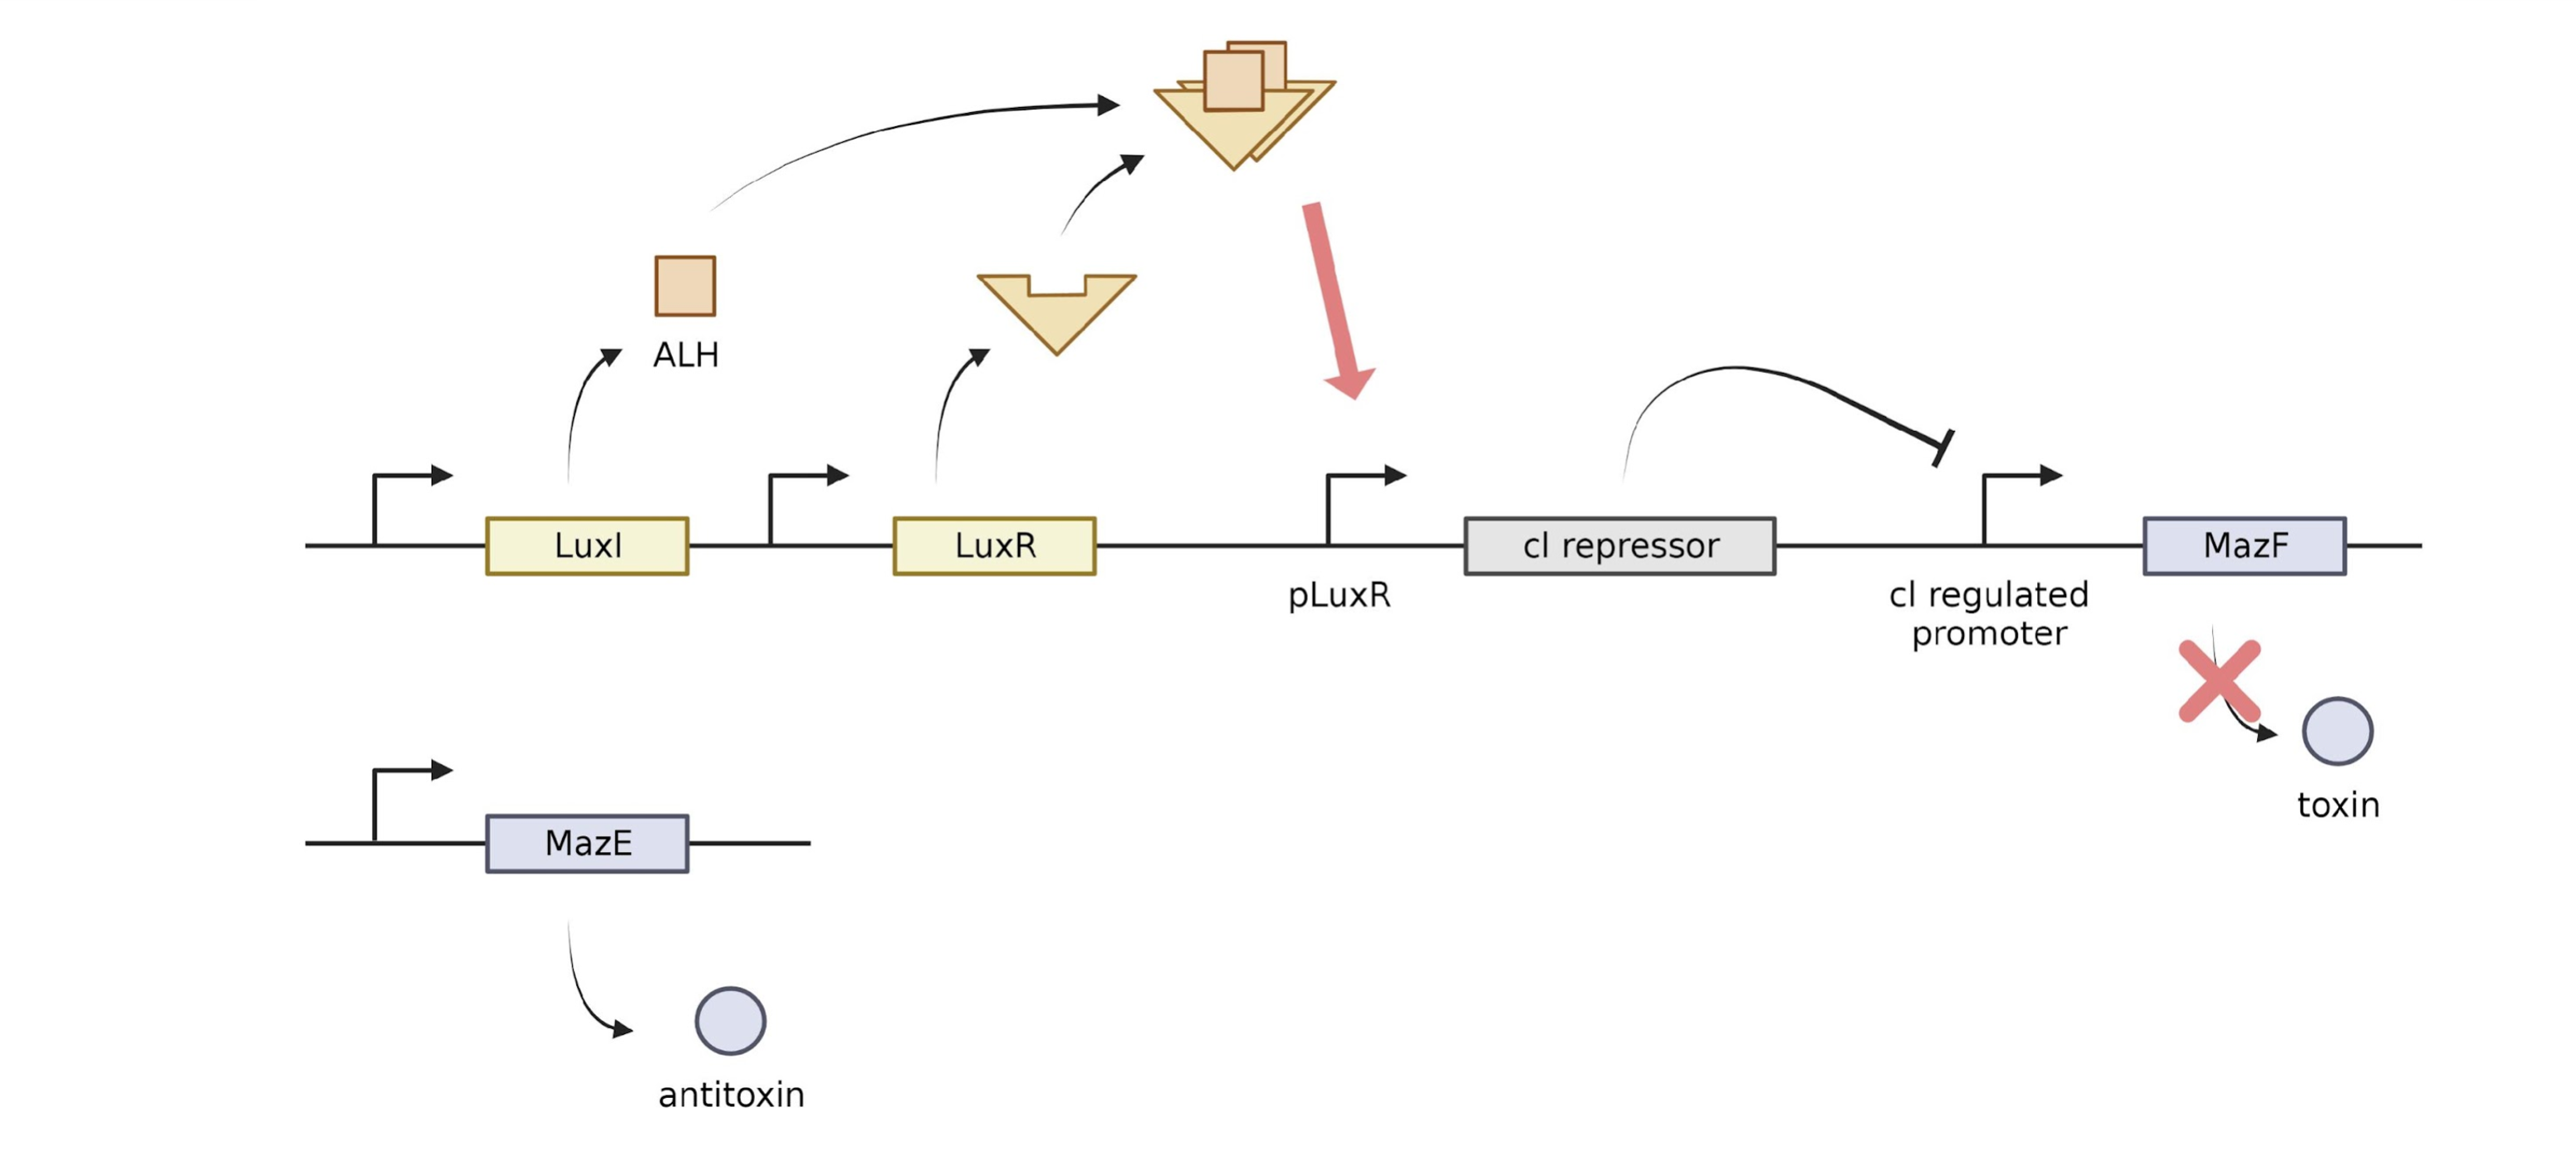
image Above is a diagram of our quorum sensing Kill switch. The system is intended to produce the toxin MazF when a cell detaches from the colony and does not recieve enough LuxR/HSL dimers.
cI at different HSL/LuxR concentrations
In order to know understand the amount of protein(cI repressor) produced by the lux promoter at each transcription factor (HSL/LuxR dimers) levels, we used the Hill equation to plot the graph. For more information about the derivation of the Hill function, see Contributions.
The Matlab code is as below
TF_vs_cl.zipThe result is as below
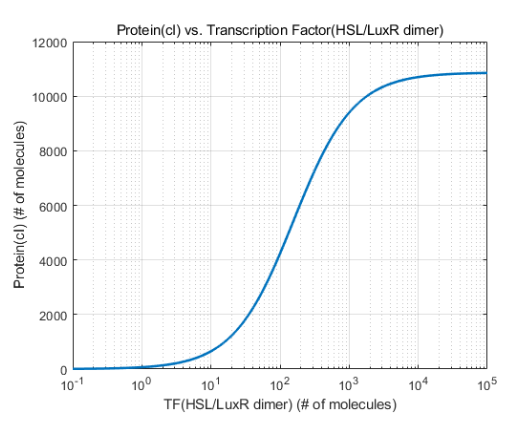
The graph tells us that transcription factors(HSL/LuxR dimer) should be in the range of 10~10^4 molecules, and that half the maximum induction is achieved around 100 molecules.
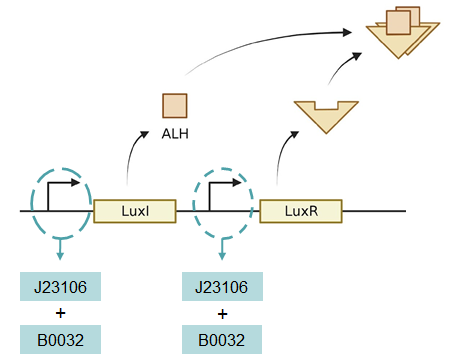
Construct selection
Our initial design of the kill switch comprised of the J23100 promoters and B0034 RBS constitutively expressing both LuxI and LuxR. However, we were not sure if or design would achieve the proper induction at high densities. So, we created ODE models to evaluate the performance of constructs containing different combinations of promoters and RBSs. We created a single cell model to account for cells that have fallen off of the colony and a high density model for cells with in a colony. Constructs with low HSL/LuxR dimers in the single cell model and high HSL/LuxR dimers in the high density model would be chosen as our improved design. First, when a single cell remains free in the environment, it would be reasonable to consider the external HSL as 0. Internal HSL concentration would be always higher than external HSL, so no HSL would return back into the cell. Thus, in this single cell model, external HSL concentration is fixed to 0.
Our model was developed upon the model created by UPV Valencia's project in 2018 (1). The ODEs for the single cell model is as below:
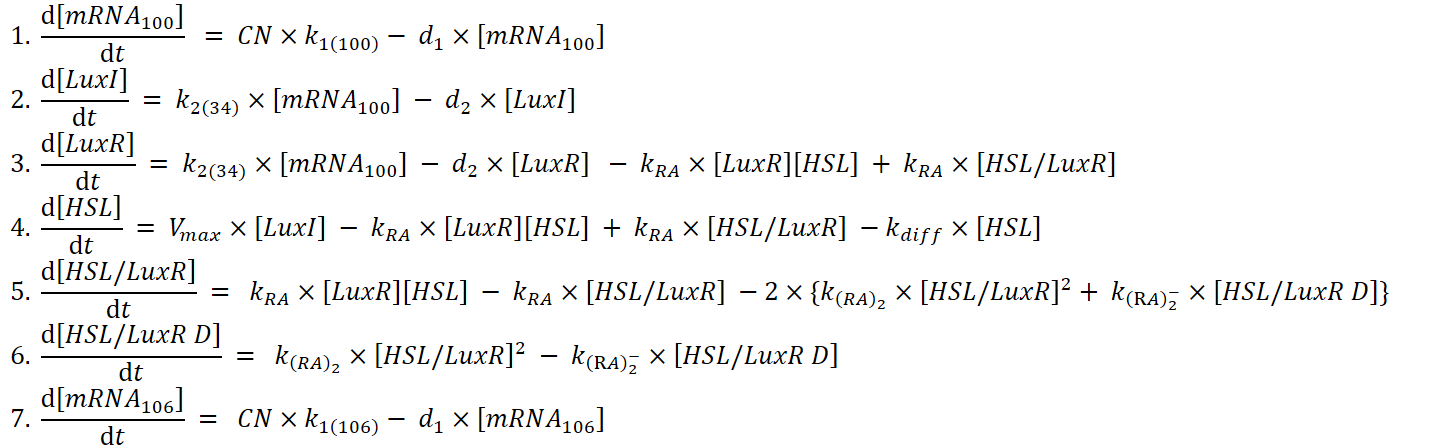
Model Single Cell The code is as below:
SingleCellMatlabModel.zipThe results are in the word file below. In the file, the constructs are indicated in the form of R10034_I10632 which means luxR has J23100 as a promoter and B0034 as a RBS, while luxI has J23106 as a promoter and B0032 as a RBS.
Results_SingleCell.docxThe only constructs that had dimers below 10^2 was R10632_I10032 and R10632_I10632.
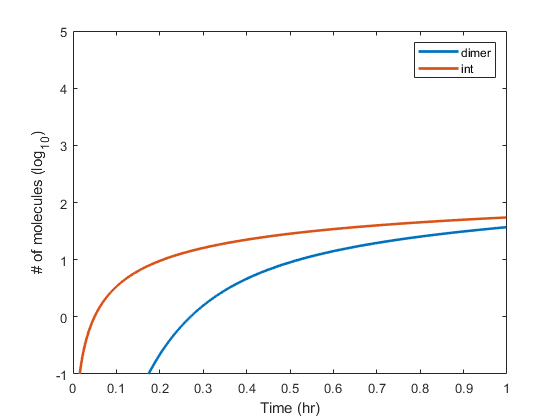
HSL/LuxR dimers(dimer) and internal HSL(int) levels for the construct R10632_I10032
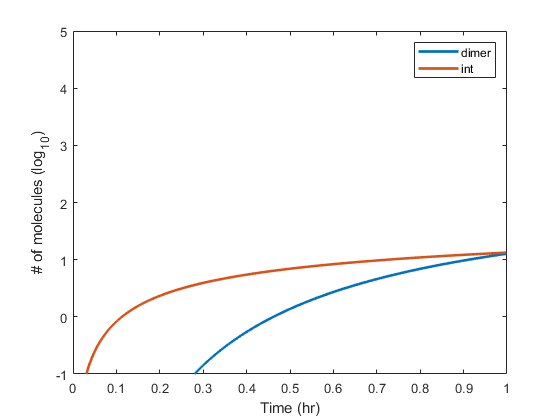
HSL/LuxR dimers(dimer) and internal HSL(int) levels for the construct R10632_I10632
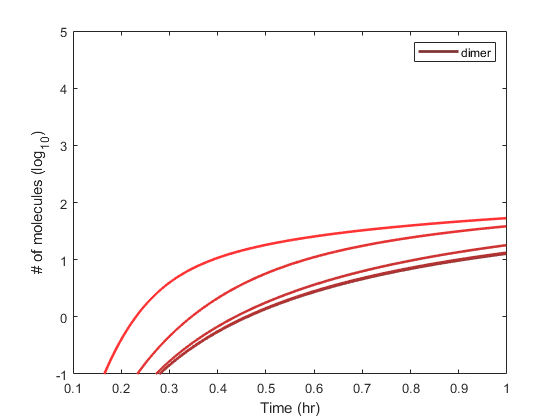
High density culture: closed 1nL env, cells 1(dark color) ~ 1e5(bright color)
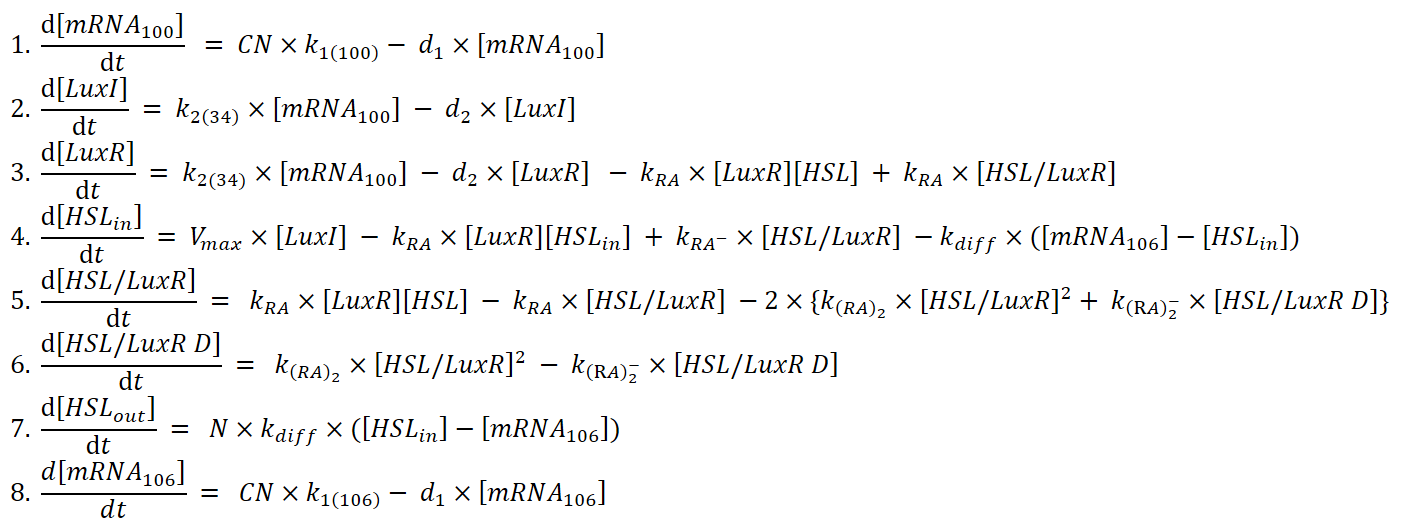
When cells are in high density, it would be fairly reasonable to imagine a region homogenous in HSL concentration. So in the high density model, we considered a nL of closed volume. When cells produce HSL, it will start to accumulate and at some point, HSL will flow back into the cell. The ODEs used in the model is as below.
Using the ODEs above, we plotted 5 graphs, each corresponding to 1 ~ 10^5 cells/nL, for each constructs. The file below contains the Matlab models used for our modeling.
HIghDensity.zipThe results are in the word file below.
Results_HighDensity.docxAmong the different constructs, the only construct with promising modeling results was the construct with J23106 B0032 which showed around 10^1.5 dimers in at 1cell/nL and 10^2.7 dimers at 10^5cells/nL.
The graph above shows the internal(int) and external(ext) HSL in molecules.
The graph above shows the number of HSL/LuxR dimers over an hour.
Therefore, our final design will use J23106 & B0032 for both luxR and luxI
KUAS
Korea University
In-Geol Choi
South Korea
Tel: +82 10 3103 7332
Email: kuaskorea@gmail.com
Sponsor and Special thanks for

CSBL at Korea University
Sponsors