Team:Worldshaper-Nanjing/Model
Problem analysis
There are thousands of enzyme catalyzed reactions and metabolic pathways in microorganisms. These metabolic reactions and pathways play their own functions and influence each other, and finally become a complete system. Engineering of the original metabolic pathways in the cell or the introduction of new metabolic reactions will cause the disturbance of the metabolic system and change the metabolic profile of the cell. The growth characteristics, substrate consumption and product synthesis ability of cells will change accordingly. Through the establishment of cell metabolism model, the metabolic reaction in cells can be simulated, so as to obtain a series of data such as cell growth, substrate consumption rate, and product synthesis rate. Considering the cost of experiments and the best control of variables, we integrated the metabolic model previously constructed and enzymatic properties with the construction of the enzyme-constrained model. By using the existed enzyme-constrained model and MATLAB, we plan to opimize the model ec_iYL647, then the linolenic acid synthetic capacity and the utilization capacity of gutter oil can be predicted. Fermentation conditions could also be simulated and optimized by Robust Analysis algorithm.
Optimization and application of the model ec_iYL647
1. Format conversion of the model ec_iYL647
RAVEN toolbox reads EXCEL format model
model = importExcelModel('ec_iYLI647_batch.xlsx',false)
RAVEN toolbox outputs SBML format model
exportModel(model,'ec_iYLI647_batch.xml')
COBRA toolbox reads SBML format model
model = readCbModel('ec_iYLI647_batch.xml')
COBRA toolbox output EXCEL format model
outmodel = writeCbModel(model, 'format', 'xls', 'fileName', 'ec_iYLI647_batch_COBRA.xlsx')
2. Optimization of the model ec_iYL647
Because the synthetic pathway of linolenic acid is not existed in Yarrowia lipolytica, it is necessary to introduce relevant metabolic pathways into the model ec_iYL647.
Synthesis reactions of linolenic acid
- ① stcoa[c] + h2o[c] -> coa[c] + ocdca[c] + h[c]
- ② ocdycacoa[c] + o2[c] + nadph[c] + h[c] -> linlenoca[c] + 2 h2o[c] + nadp[c]
- ③ linlenoca[c] + h2o[c] <=> coa[c] + octadecacid[c]
Transport reaction of linolenic acid
- ④ octadecacid[c] <=> octadecacid[e]
Exchange reaction of linolenic acid
- ⑤ -> octadecacid[e]
- ⑥ octadecacid[e] ->
After adding the reactions, the model was re-read into Matlab, and the final model contains 2630 reactions, 1733 metabolites, and 632 genes (Fig. 1).
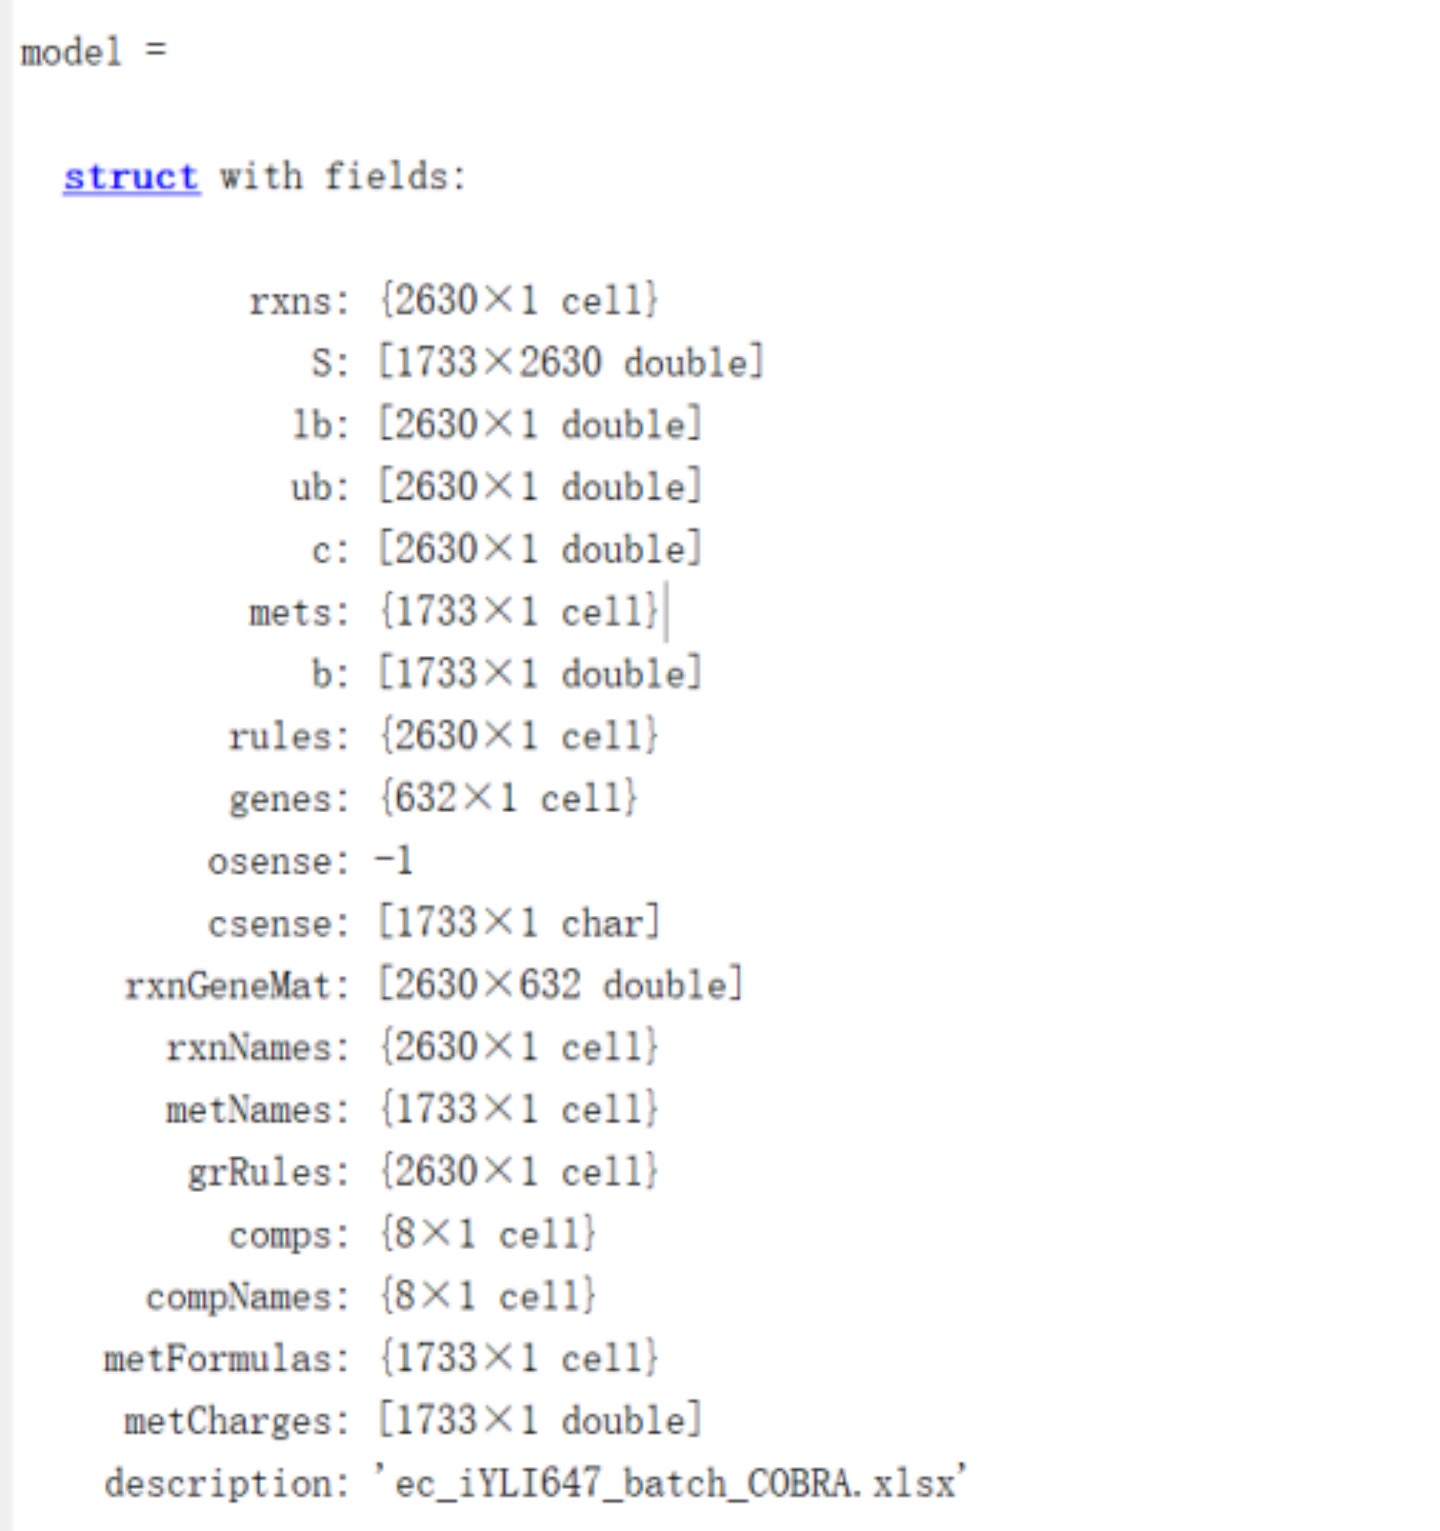
Fig. 1 The model with the linolenic acid synthetic pathway
3. Prediction of linolenic acid synthetic capacity of Y. lipolytica based on the ec_iYL647 model
Using the exchange reaction of linolenic acid (R_EX_octadecacid_LPAREN_e_RPAREN_) as the objective function,defining the lower bound of biomass as 0.1 h-1,and calculating the carbon flux under steady-state conditions (Table 1). The synthesis rate of linolenic acid was 3.06 mmol/gDW/h, indicated that ec_iYL647 has the ability of linolenic acid synthesis.
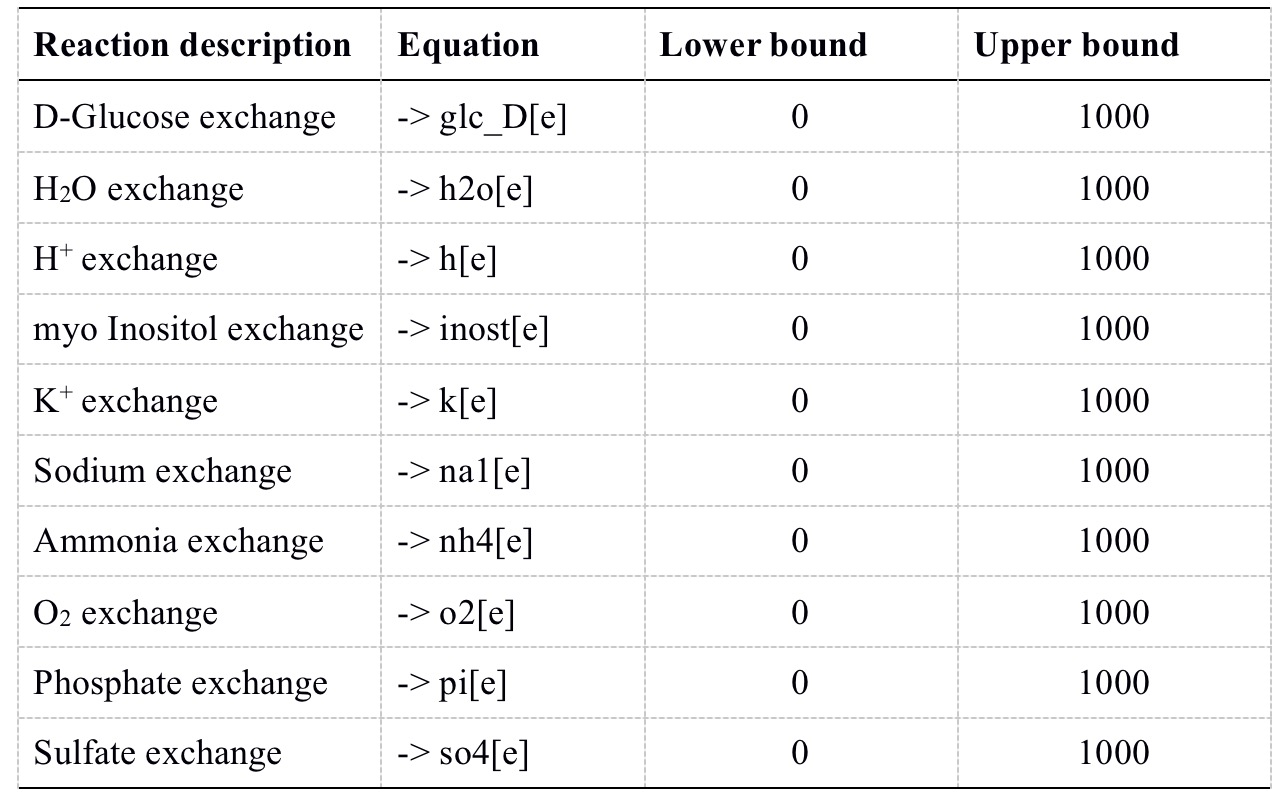
Table 1 Simulation conditions
Optimization of fermentation conditions for Y. lipolytica based on the model ec_iYL647
RobustAnalysis algorithm was used to simulate the effect of different culture conditions on the rate of linolenic acid synthesis separately.
Based on the simulation, it was found that the synthesis rate of linolenic acid increased gradually with the increase of glucose uptake rate (GUR). The synthesis rate of linolenic acid was maximal at 3.06 mmol/gDW/h when GUR reached 33.5 mmol/gDW/h. After GUR was greater than 33.5 mmol/gDW/h, the synthesis rate of linolenic acid gradually decreased and was 0 when GUR reached 500 mmol/gDW/h.(Fig 2.)
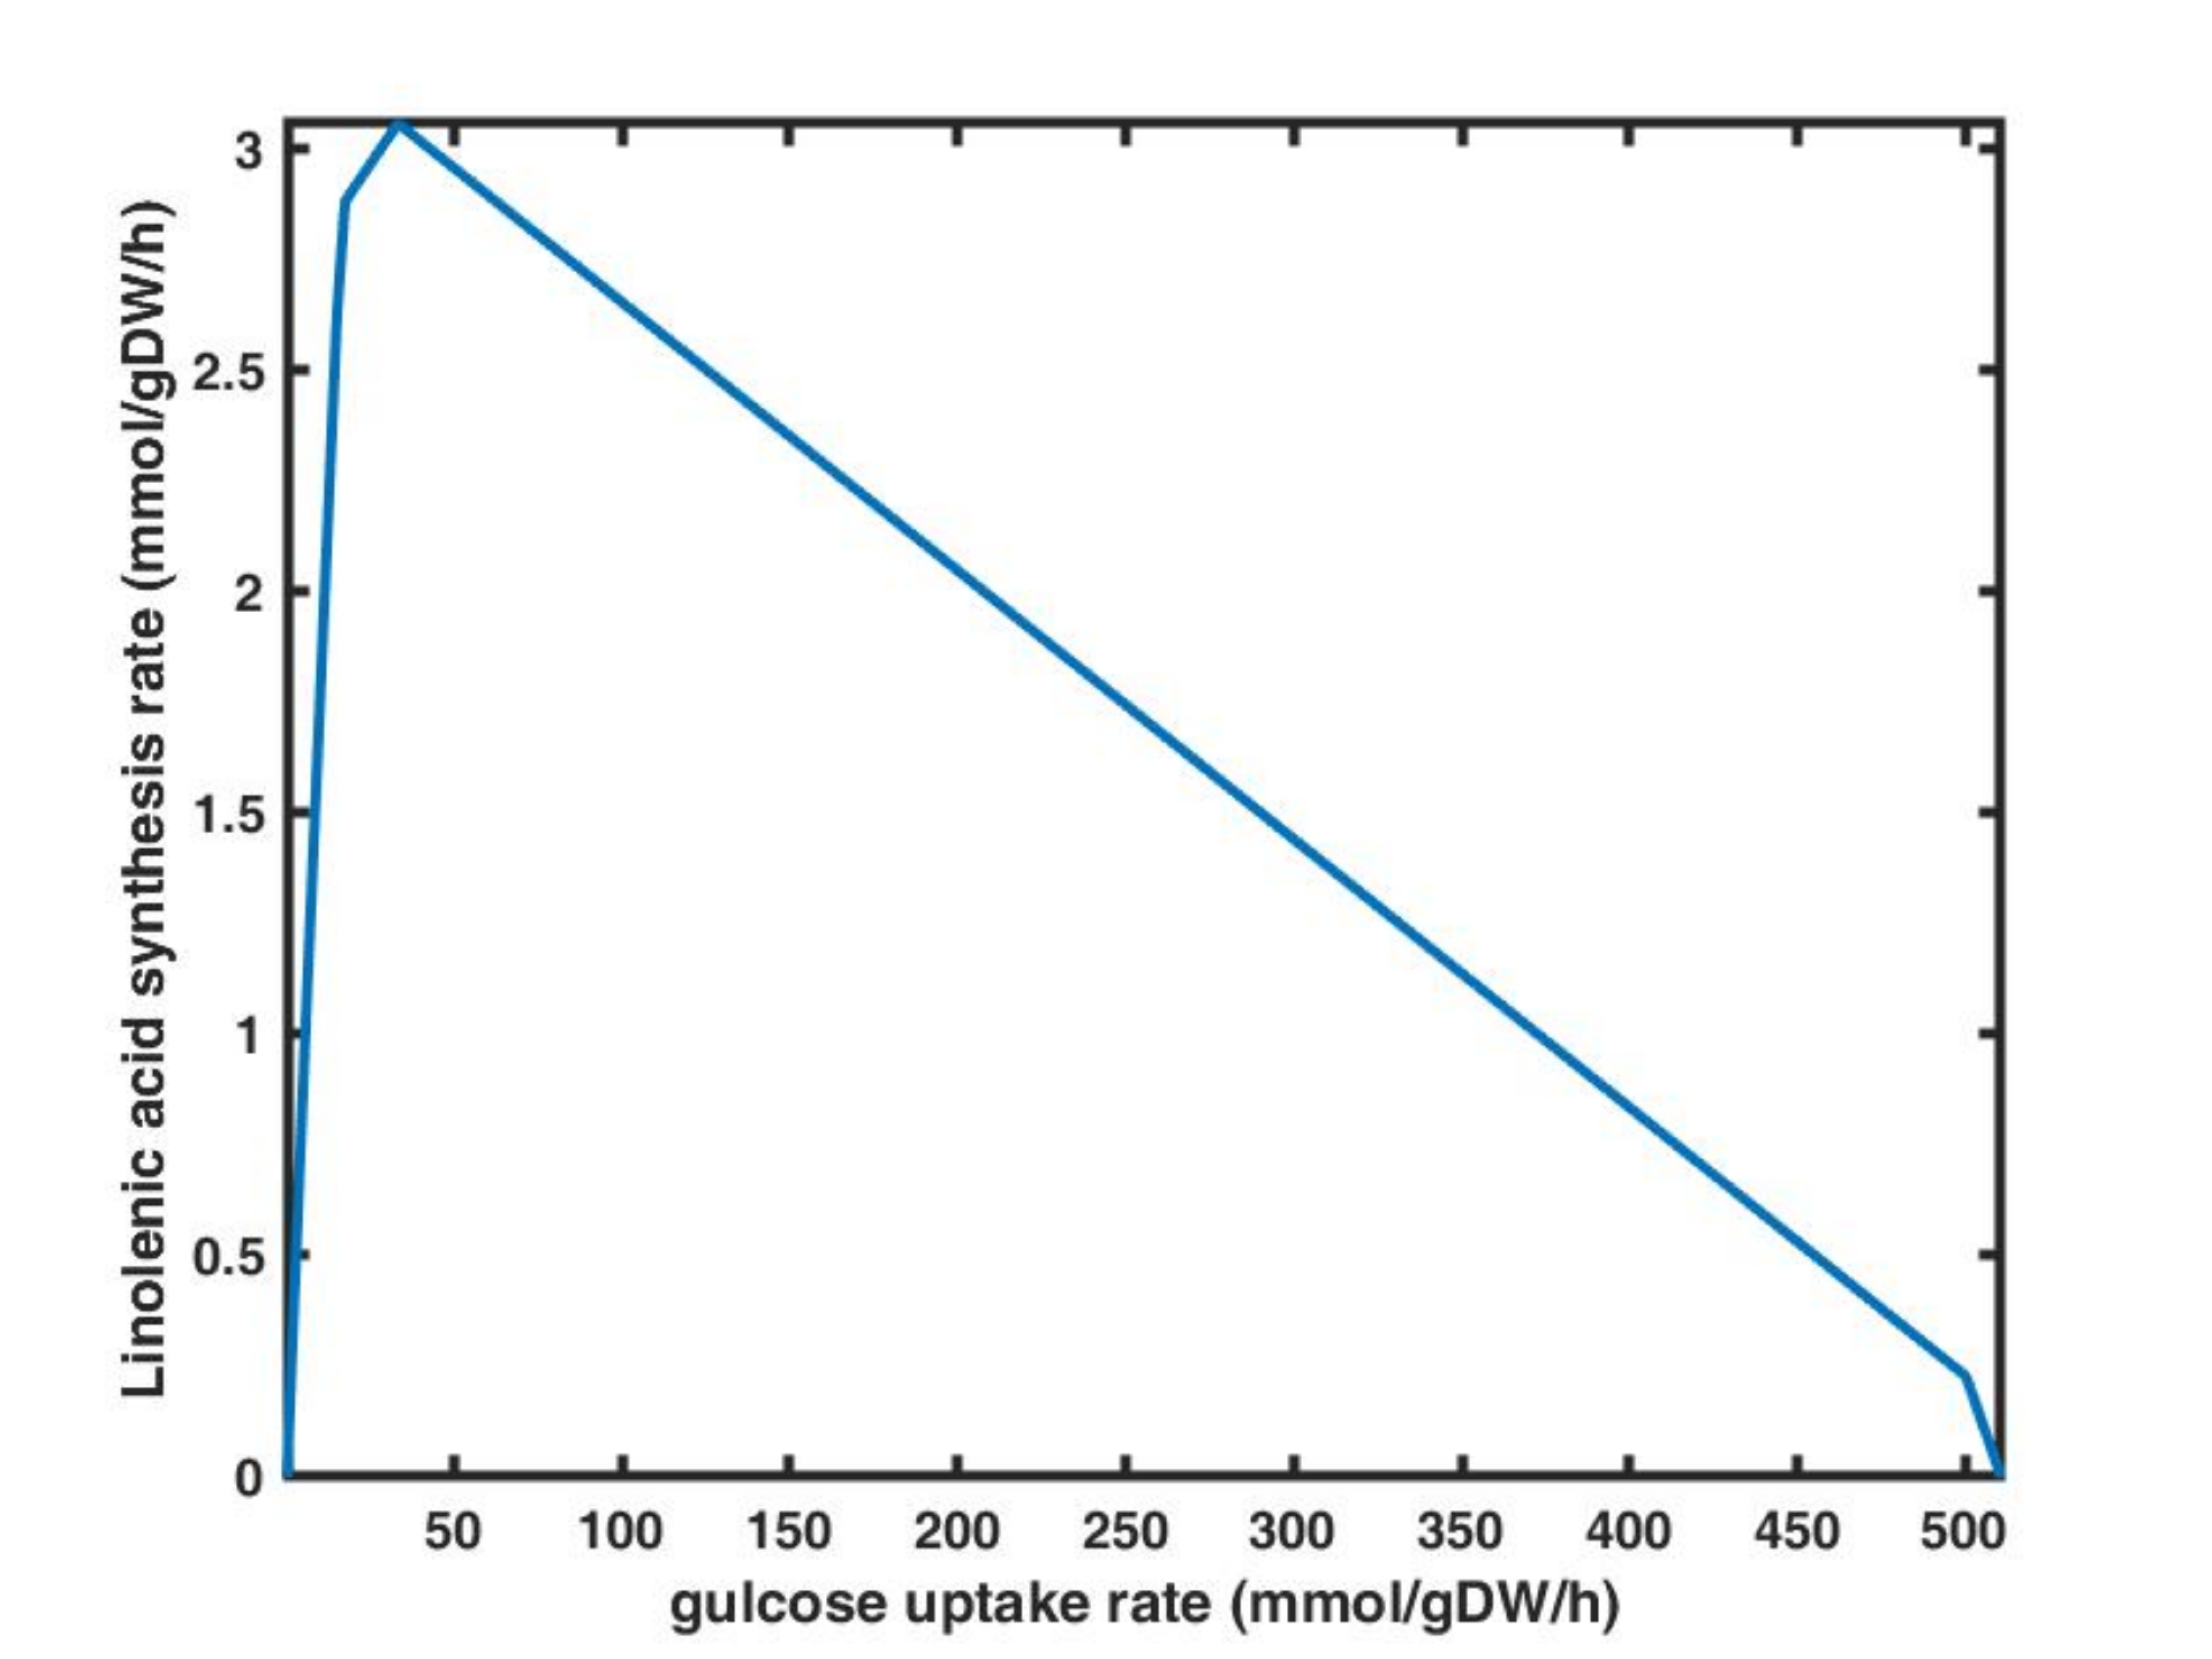
Fig. 2 RobustAnalysis of glucose uptake rate and linolenic acid synthesis rate
In additon, it was found that as the oxygen uptake rate (OUR) increased, the synthesis rate of linolenic acid also gradually increased. The synthesis rate of linolenic acid was maximal at 3.06 mmol/gDW/h when OUR reached 36.8 mmol/gDW/h. The rate of linolenic acid synthesis gradually decreased when OUR was greater than 36.8 mmol/gDW/h and was 0 when our reached 250 mmol/gDW/h (Fig. 3).
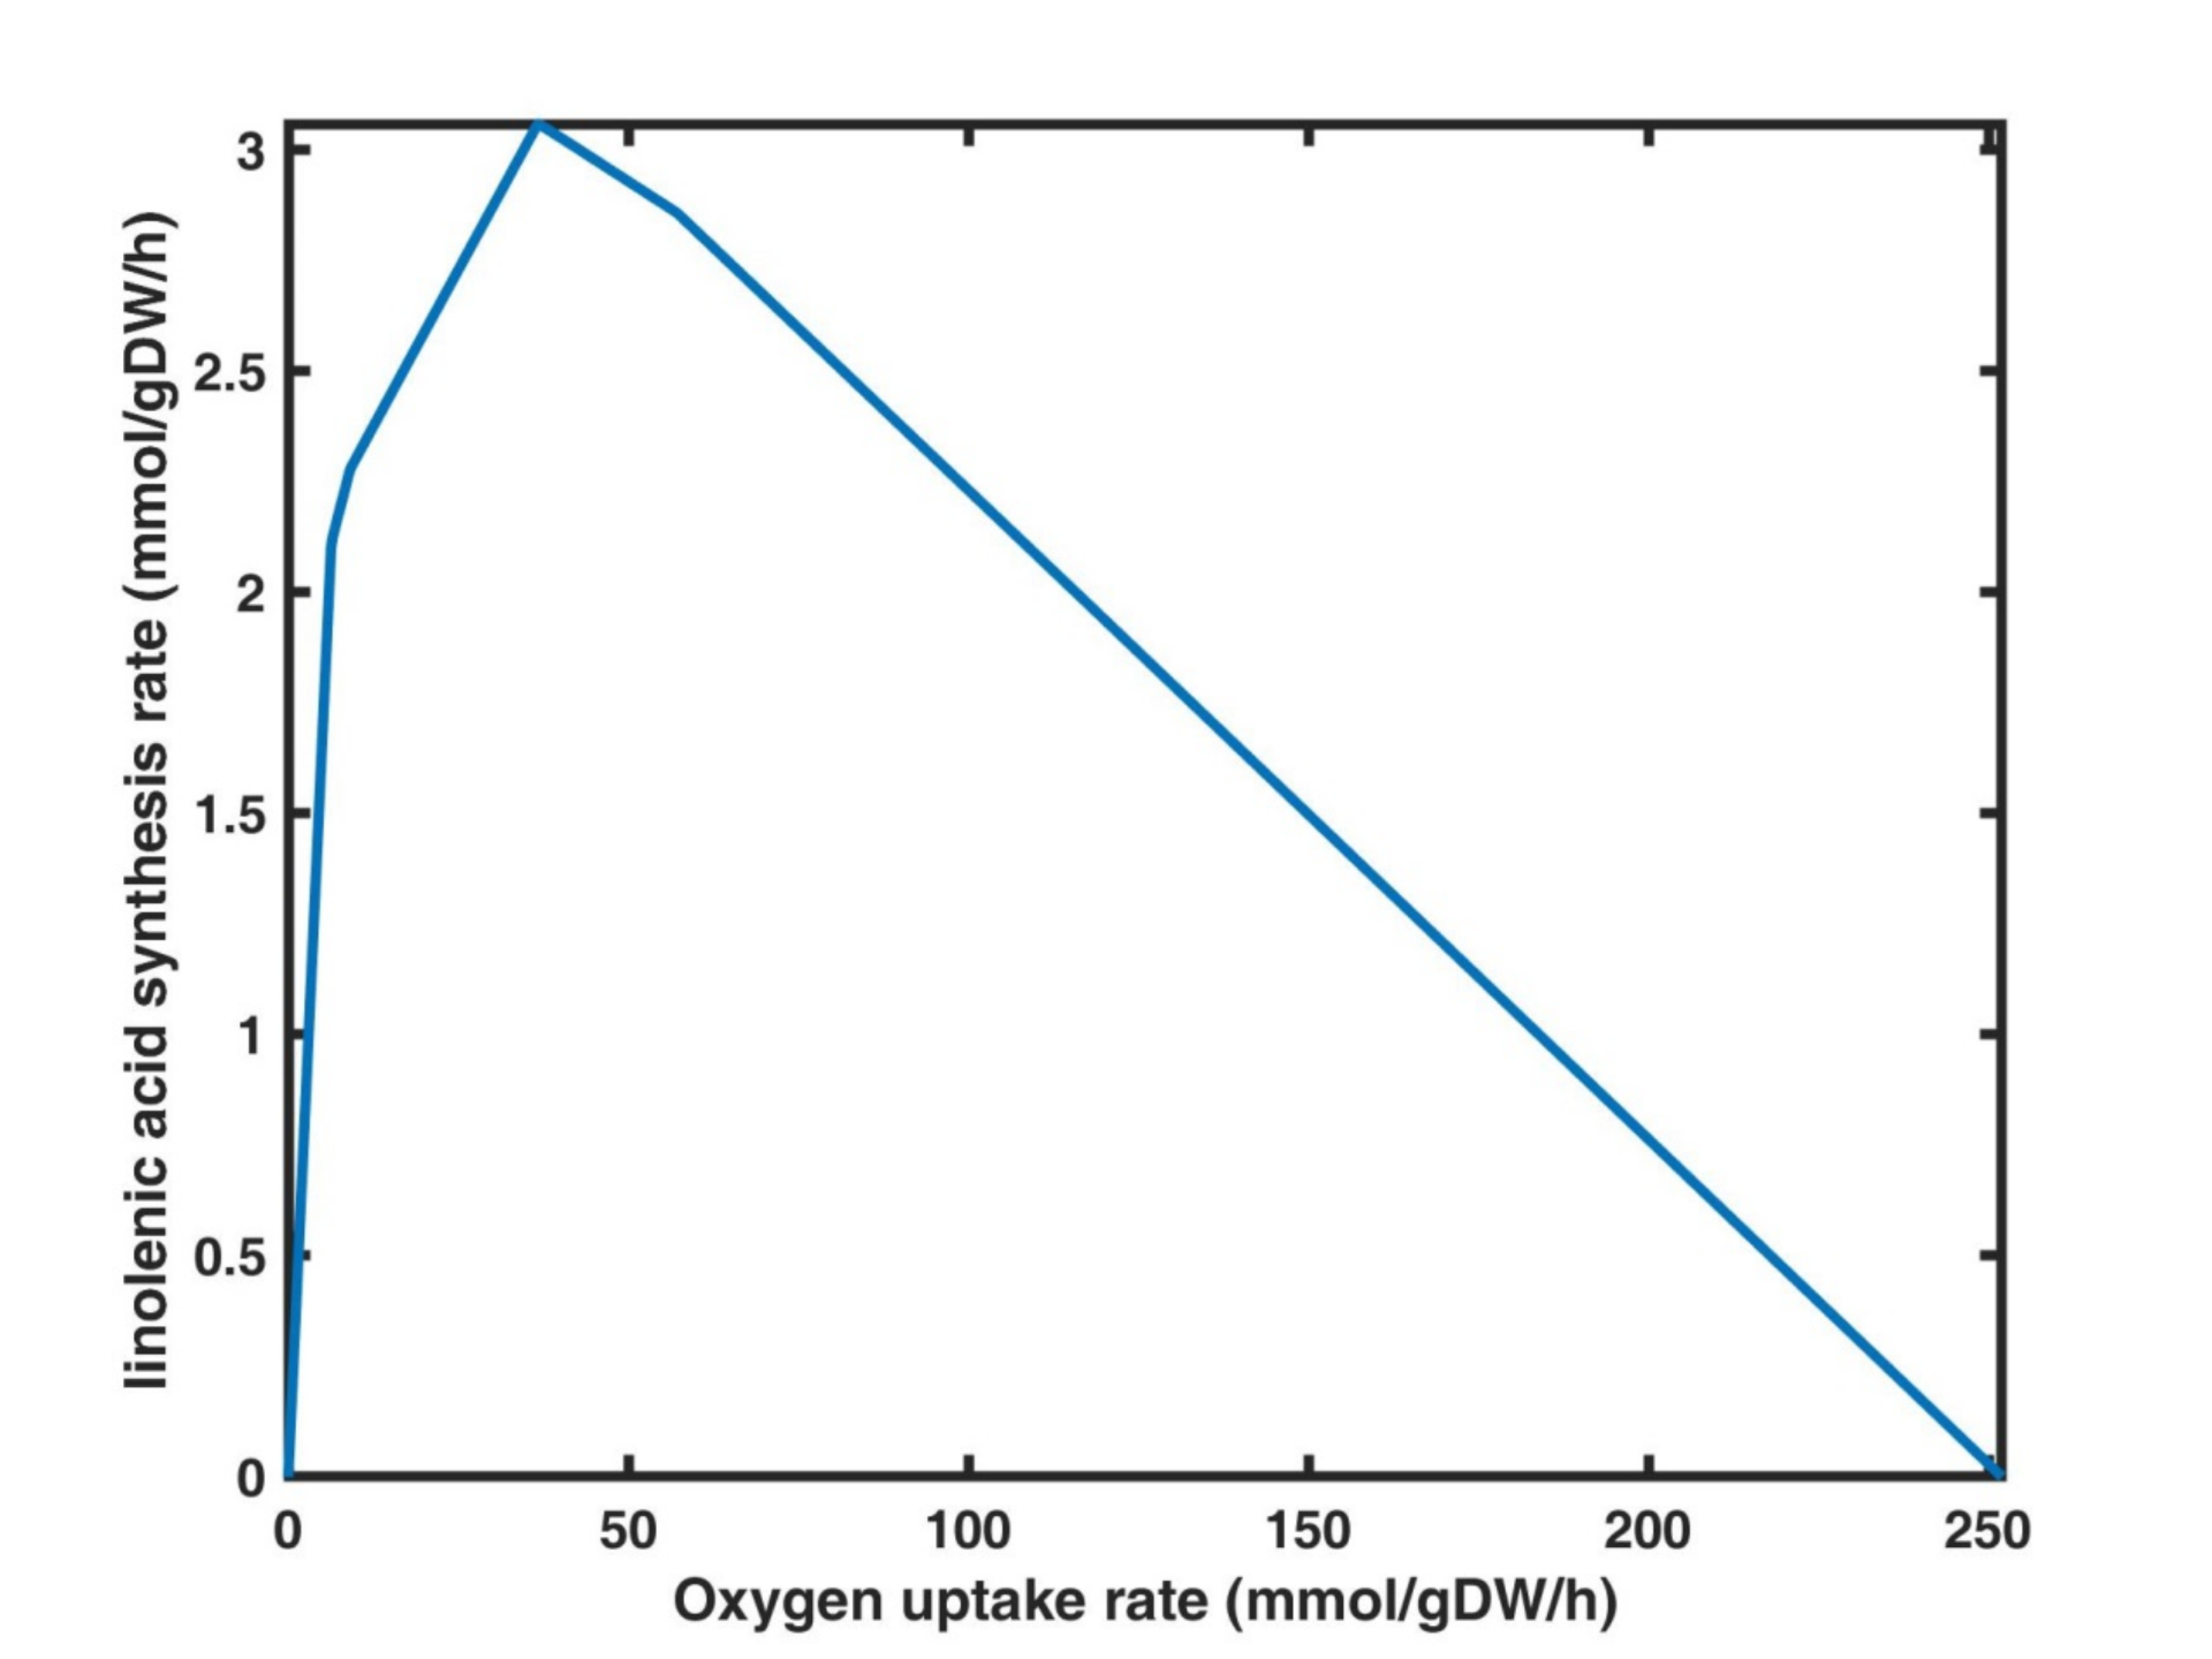
Fig. 3 RobustAnalysis of oxygen uptake rate and linolenic acid synthesis rate
4. Prediction of the ability of Y. lipolytica to utilize the gutter oil based on the model ec_iYL647
In our previous work, we analyzed the utilization of 36 carbon sources by Y. lipolytica and found that it was able to utilize 29 of these carbon sources. Since the major components of gutter oil are tetradecanoic acid, hexadecanoic acid, and palmitoleic acid, we simulated the effects on the growth of Y. lipolytica by using these fatty acids as carbon source.
The simulation results showed that Y. lipolytica was able to utilize these thress fatty acids for cell growth. While the specific growth rate was reduced by 93.7%, 84.9%, and 86.5%, respectively, compared with glucose as the carbon source (Table 2).
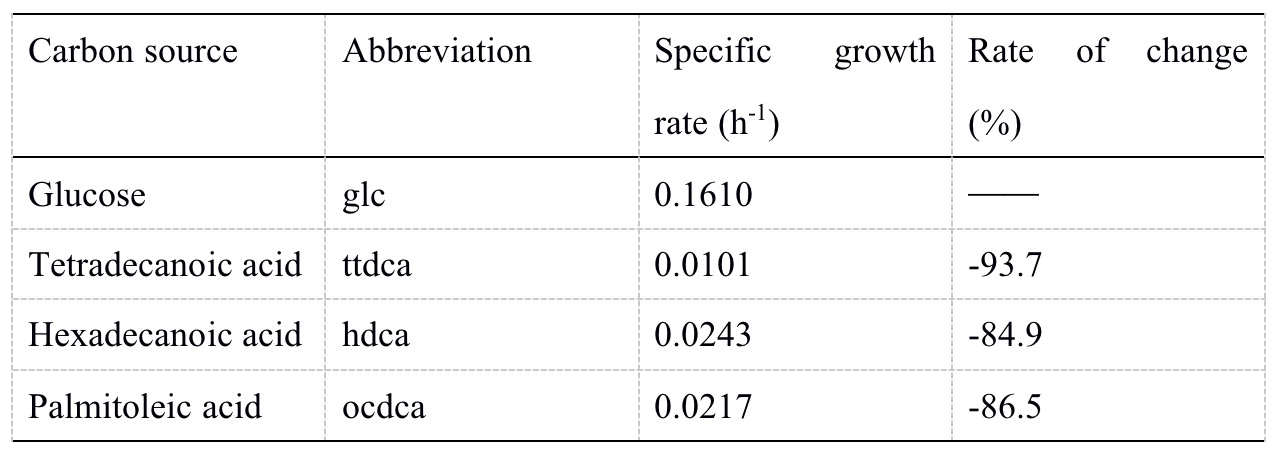
Table 2 Effects of different fatty acids on cell growth
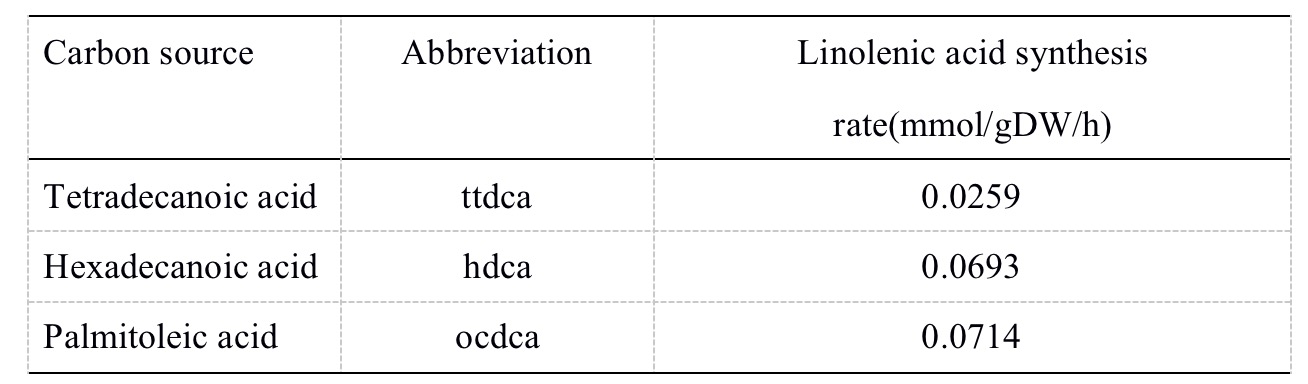
5. Prediction of the ability of Y. lipolytica to synthesize linolenic acid using the gutter oil based on the model ec_iYL647
We limited the specific growth rate as 0.01 h-1, set the exchange reaction of linolenic acid as the objective function. Then calculated the synthesis rate of linolenic acid by using tetradecanoic acid, hexadecanoic acid, and palmitic acid as carbon sources, respectively. Simulations showed that Y. lipolytica was able to not only utilize these three fatty acids but also convert them to linolenic acid. Among them, the synthesis rate of linolenic acid was the largest at 0.0714 mmol /gDW/h, when palmitic acid was used as the carbon source (Table 3).