Team:TAU Israel/Model

Our Model
Introduction
Our models portray an innovative approach to characterize core biophysical processes related to gene expression, not only for one organism but for an entire microbial population. Our calculations were used to optimize these processes for selected members of the community while simultaneously deoptimizing them for others. These automatic models apply to communities with different degrees of characterization and aren’t limited to specific model organisms.
When engineering a microbiome, two subpopulations are defined: the wanted hosts which are the organisms that should express the introduced gene, and unwanted hosts which should have impaired expression of it.
Along the natural course of evolution, different species have adapted to have varying cellular machinery and preferences. In order to utilize these small differences,
These models operate under an integrative engineering approach in which the innate differences between organisms for cellular core processes related to gene expression are detected and modeled. This information is used to re-design a combined plasmid to be as selective as possible.
Additionally, the population is examined through an evolutionary perspective, thus the gene must not create a burden on the optimized organisms, or else it will be “lost”. However, if it does disturb growth in the deoptimized organisms, it will help us achieve long-term selectivity.
The process is divided into 3 main modules:

Figure 1: Left: Entrance into bacterial cell, Center: Transcription, Right: Translation
- Entrance into the bacterial cell: When foreign DNA enters a bacterial cell, the first regulation system it faces is the restriction enzymes. The restriction enzyme footprint of different bacteria is unique, therefore different bacteria contain distinct sets of restriction enzymes. Novel heuristics were applied in order to add and delete restriction sites optimally for the community.
- Transcription: Even when the sites are inserted, a plasmid might still be accepted by a deoptimized organism if it’s passed via horizontal gene transfer (after methylation naturally occurs). Different organisms utilize different transcription factors in order to promote the transcription initiation of genes in prokaryotes, as each factor recognizes different sets of genomic sequences described as “motifs”. State-of-the-art machine learning tools were applied in order to discover motifs that promote transcription selectively, inspired by TU Delft 2017’s Motif-Finder tool. They were then used in order to select and re-design synthetic versions of microbiome-optimized promoters.
- Translation: Ribosomal density calculations were used to control translation efficiency by utilizing established strategies in a cutting-edge approach with customized versions of empirical databases. This module also includes an in-house statistical assessment of the optimization process.
Tuning Parameter
According to the feedback we received from Prof. Elhanan Borenstein, we added an additional “tuning parameter” that allows control over the tradeoff between the degree of optimization and deoptimization. This means that the user can prioritize optimization of expression in optimized organisms over deoptimization of expression in the deoptimized organisms and vice versa.
The value lies between 0 and 1, where 1 means that only optimization for high protein production is important, and 0 stands for prioritizing only the deoptimization. The value of 0.5 means that no specific direction is preferred.
This additional parameter was added to all models.

Figure 2.1: Tuning parameter provides a balance between optimization and deoptimization
Translation Efficiency Model

Figure 3.1: Optimization and deoptimization of translation efficiency
Summary
The open reading frame (ORF), also called coding sequence (CDS), describes the genomic sequence that codes for amino acids. During translation, the ribosome decodes the codons from the nucleotides into their corresponding amino acids. Each codon is coded by 3 nucleotides, creating 64 optional codons (3 are stop codons) coding for only 20 amino acids- thus the genetic code is redundant.
During evolution, cellular machinery has adapted to translate certain codons more optimally than others. Different genetic information can be used in order to infer the profile of preferred codons (also known as the codon usage bias, or CUB) of each organism.
The open reading frame of the optimized gene is re-coded in order to consider the microbiomes codon preferences, thus enhancing the translation efficiency of the optimized organisms while decreasing translation efficiency for deoptimized organisms.

Figure 3.2: Summary of the ORF optimization methods
Part 1: Codon Usage Bias Indexes
The codon usage bias profiles can be calculated under various assumptions, characterized in different indexes, as follows:
Codon Adaptation Index (CAI):

Figure 3.3:CAI scores of E. Coli genes vs. their expression levels
The Codon Adaptation Index (CAI) uses a reference set of genes from a specific species to assess the relative frequency of each codon with respect to its synonymous codons and the total score for the gene [1]. For our model, we used a reference set of highly expressed genes. The high need of the cell for this kind of genes caused the evolutionary design to adapt them to the intracellular machinery, therefore we expect highly expressed genes to have more optimal codons.
Click here to read more about this.


Wobble Hypothesis:
The Wobble hypothesis proposes that normal base pairing (Watson-Crick) can occur between the first and second bases of the codon to the third and second bases of the anticodon, respectively. However, the first base of the anticodon may also be bound to the third base of the codon with Wobble interactions, which do not require a perfect match. In that way, each tRNA can interact with more than one codon, and each codon can be bound by more than one tRNA. It should be mentioned that the affinity of Wobble interactions is lower than that of Watson-Crick [3].

Figure 3.4: The same tRNA can interact with CUC codon by Watson-Crick base pairing (left), and to CUU codon by Wobble interactions (right) [4].
tRNA Adaptation Index (tAI)
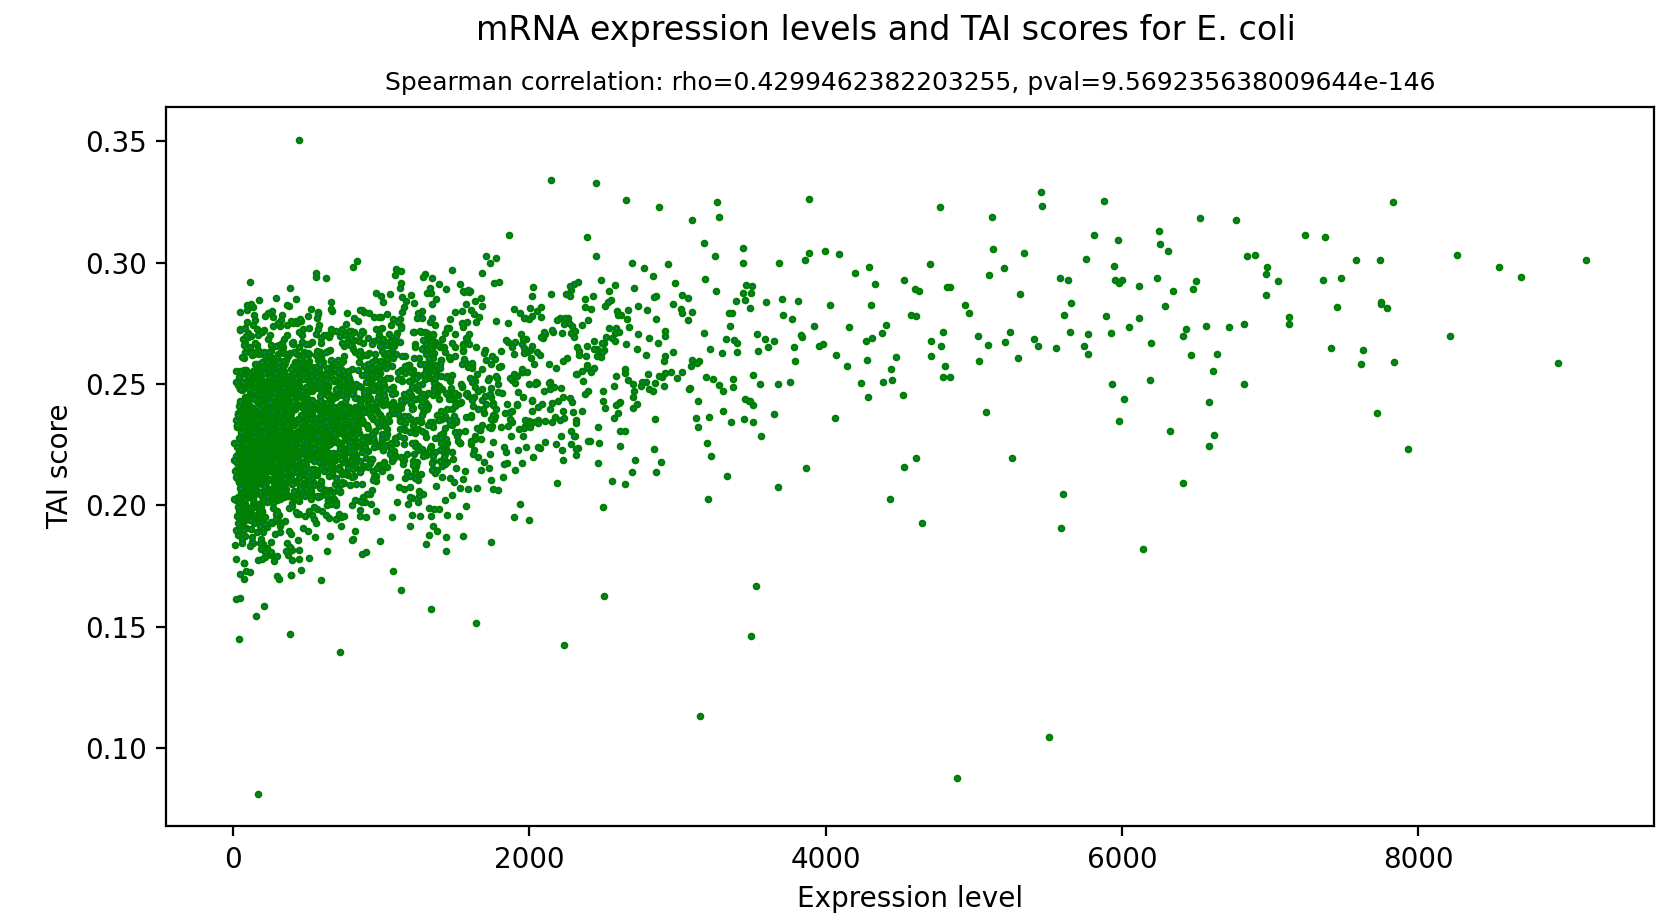
Figure 3.5: tAI scores of E. Coli genes vs. their expression levels
The tRNA Adaptation Index is a measure of translational efficiency which considers the intracellular concentration of tRNA molecules and the affinity of each codon-anticodon pairing. This index is calculated based on a reference set of highly expressed genes from a specific species, since highly expressed genes tend to have higher codon usage bias (CUB) and higher adaptation to the tRNA pool [5]. The score of a gene is in a range of (0, 1], when a score of 1 is given to an optimal gene which is recognized by a lot of tRNAs with high affinity.
Read more about tAI here.


Typical Decoding Rate (TDR) [8]:

Figure 3.7: TDR scores of E. Coli genes vs. their expression levels
This measurement is based on ribosome profiling data (Ribo-Seq), which provides a snapshot of a mid-translation ribosomal position on the mRNA molecules in a cell during certain conditions.
*This index is relatively complicated because the Ribo-Seq data is hard to produce and very noisy. Additionally, the sequences optimized according to this index underperformed in the POC experiment, thus we decided not to add this optimization to our final software.
Read more about TDR here.


In order to visually understand which codons are regarded as selective, the following plots can be examined:

Figure 3.8: Correlation between CAI scores from E. coli and B. subtilis for each codon

Figure 3.9: Correlation between tAI scores from E. coli and B. subtilis for each codon
The interesting codons are those that are far away from the correlation line, meaning that they are either efficiently translated in E. coli and inefficiently translated in B. subtilis, or vice versa. These are the codons that will facilitate different translation efficiencies in the two different organisms, and are selected in our modeling process.
Part 2: Multi Organism Optimization
The usage of codon usage bias profiles in order to improve translation of a transgenic gene is a well-known process called codon harmonization [12]. We decided to create a novel algorithm based on the codon harmonization principle to “harmonize” the codons for an entire microbiome, instead of just one organism.
To do so, we created a novel algorithm that finds the best synonymous codon for each amino acid - not just for one organism but for all of them (based on the selected codon usage bias index), that will improve translation efficiency in the optimized organisms while deoptimizing it for the other organism.
These options take into account the "tuning parameter".
We decided to devise two different strategies:
- Single codon optimization: optimize the codons based only on the profiles themselves, without respect to the initial sequence or the translation efficiency scores that the endogenous proteins receive. This was the first optimization we designed; however, when testing it we saw that in some cases it performs suboptimally (for organisms that are very evolutionarily different the optimization was not significant), therefore we understood that the effects and scoring of the whole proteome should be taken into account and checked for, which caused us to devise our second optimization strategy.
- Proteome optimization: a more holistic approach that integrates not only the codon usage bias measurements themselves but also the scores of the whole proteome for each and every one of the organisms. The motivation to do so is that the profiles are able to point out the preference for a certain synonymous codon among others, but they are not able to show how significant that change is in terms of the whole proteome, if a certain organism tends to have proteins with very similar codon usage bias scores, a small improvement in the score of our optimized gene can be very significant. However, if the scores of the endogenous proteins are very widespread, even a large improvement with the score of our protein might not have that much of an effect.
Click here to read more about the profile optimization.


Figure 3.8: Average CAI score in A. thaliana microbiome histogram

Figure 3.9: STD of CAI scores in A. thaliana microbiome histogram
When choosing this approach, another degree of complexity is added because instead of looking at one codon at a time, the protein is scored as a whole, thus introducing dependency between the different codons. To solve this, we decided to optimize the sequence using a greedy machine learning algorithm called “hill-climbing”.
Click here to read more about proteome optimization
References:
[1]. Paul M. Sharp, Wen-Hsiung Li, The codon adaptation index-a measure of directional synonymous codon usage bias, and its potential applications, Nucleic Acids Research, Volume 15, Issue 3, 11 February 1987, Pages 1281–1295, https://doi.org/10.1093/nar/15.3.1281
[2]. A. Carbone, A. Zinovyev, F. Képès. Codon adaptation index as a measure of dominating codon bias, Bioinformatics, Volume 19, Issue 16, 1 November 2003, Pages 2005–2015, https://doi.org/10.1093/bioinformatics/btg272
[3]. Peretó J. (2011) Wobble Hypothesis (Genetics). In: Gargaud M. et al. (eds) Encyclopedia of Astrobiology. Springer, Berlin, Heidelberg. https://doi.org/10.1007/978-3-642-11274-4_1692
[4]. Verma, P. S., & Agrawal, V. K. (2006). Cell Biology, Genetics, Molecular Biology, Evolution & Ecology (1 ed.). S .Chand and company Ltd.
[5]. Sabi, R., Volvovitch Daniel, R., Tuller, T. stAIcalc: tRNA adaptation index calculator based on species-specific weights, Bioinformatics, Volume 33, Issue 4, 15 February 2017, Pages 589–591, https://doi.org/10.1093/bioinformatics/btw647
[6]. dos Reis, M., Savva, R., & Wernisch, L. (2004). Solving the riddle of codon usage preferences: a test for translational selection. Nucleic acids research, 32(17), 5036–5044. https://doi.org/10.1093/nar/gkh834
[7]. Mario dos Reis, Renos Savva, Lorenz Wernisch, Solving the riddle of codon usage preferences: a test for translational selection, Nucleic Acids Research, Volume 32, Issue 17, 1 September 2004, Pages 5036–5044, https://doi.org/10.1093/nar/gkh834
[8]. Dana, A., & Tuller, T. (2014). Mean of the typical decoding rates: a new translation efficiency index based on the analysis of ribosome profiling data. G3 (Bethesda, Md.), 5(1), 73–80. https://doi.org/10.1534/g3.114.015099
[9]. Joe P. Foley, John G. Dorsey, A Review of the Exponentially Modified Gaussian (EMG) Function: Evaluation and Subsequent Calculation of Universal Data, Journal of Chromatographic Science, Volume 22, Issue 1, January 1984, Pages 40–46, https://doi.org/10.1093/chromsci/22.1.40
[10] L. Lindahl and J. M. Zengel, “Expression of ribosomal genes in bacteria,” Advances in Genetics, pp. 53–121, 1982.
[11] R. Sabi, R. Volvovitch Daniel, and T. Tuller, “STAI CALC : Trna adaptation index calculator based on species-specific weights,” Bioinformatics, 2016.
[12] E. Angov, C. J. Hillier, R. L. Kincaid, and J. A. Lyon, “Heterologous protein expression is enhanced by harmonizing the codon usage frequencies of the target gene with those of the expression host,” PLoS ONE, vol. 3, no. 5, 2008.
Transcription Optimization

Figure 4.1: Transcription Optimization Summary
Summary
During transcription of genes in prokaryotes, cellular machinery recognises genomic areas called “promoters”. These sequences are found upstream to a gene, and are able to recruit supporting factors in order to allow RNA polymerase to start transcription.

Figure 4.2: An illustration of a promoter upstream to a coding gene. The promoter sequence includes sites that are reserved for transcription factor binding.
Different organisms utilize different transcription factors in order to promote the transcription initiation, as each of these factors recognises different sets of genomic sequences described as “motifs”.
In this module, the endogenous promoters of the microbial community are scanned in search for genetic motifs that promote transcription selectively in the optimized organisms, and not in the deoptimized ones. These motifs are then used to rank optional promoters according to both selectivity and expression abilities, and point synthetic changes are introduced to them in order to enhance their activity.

Figure 4.3: A plasmid with a gene of interest entering two bacterial cells, one producing many transcripts (left), the other producing few (right).
This illustration represents our goal from the promoter module in our model, in which the optimized organisms perform transcription faster and more effectively.
Part 1: Promoter and Intergenic Region Detection
Promoters are genetic sequences that activate transcription of the gene sequence adjacent and downstream to it. To start our analysis, we looked into several promoter databases that could be helpful to us in our model. We focused on databases of Escherichia coli and Bacillus subtilis, since these were the bacteria we chose for our wet validation experiments.
For E. coli, we checked:
- RegulonDB [12], a database for transcriptional regulation in the K-12 strain of E. coli. This database contains 8662 promoter sequences, supported by scientific literature and validated in experiments.
- PromEC [5] database for mRNA promoters. Transcription start sites (TSS) for the promoters were detected experimentally and validated. This database contains 472 promoter sequences, obtained from genome documentation, literary review and RegulonDB.
- A transcription network database [6] containing the interactions between transcription factors and the coding sequences they regulate. This database, based on a literary review, extends RegulonDB, and includes 577 of such interactions.
- The iGEM parts registry, with 100 sequences of constitutive promoters submitted by different iGEM teams over the years.
For B. subtilis, we checked:
- DBTBS [7], a database compiled from an extensive literary review, contains 1475 promoter sequences.
- A database [13] of 767 promoters collected from the literature and validated by a promoter-predicting software.
- A database [10] of 84 promoters predicted based on fluorescence in wet experiments.
- A part toolbox [11] containing 61 promoter sequences based on fluorescence experiments.
For our analysis, we mainly used PPD [15]: a vast, generic database of experimentally validated promoters in prokaryotes, containing over 100,000 promoters from 63 different organisms.
Those databases contain information about core promoters of these bacteria, that are defined as the exact area that the sigma factor (a component of the bacterial RNA-polymerase) [9] binds to.
However, the binding sites of sigma factors are nearly universally shared among bacterial organisms, therefore they are not a good candidate for selective motifs. Moreover, we were interested in analysing signals beyond just the core promoter, as transcription factors bind to regions other than the core promoter itself.
In order to develop a new definition of the promoter region that suits the objectives of our model, we first looked into intergenic regions. These are non-coding sequences that are found in-between the genes themselves, and they include, amongst other regulatory sites, the promoters. We analysed the length distribution of intergenic regions in bacterial model organisms:

Figure 4.4: Histogram of intergenic sequences' length distribution in six model organisms
The color brown indicates a complete overlap between all six organisms, and so we can see that distributions are relatively similar, and that most sequences are shorter than 600bp. Note: The plot limits the sequence length to 1.5Kb, as longer sequences are not relevant for this analysis.
Bacterial genomes tend to be compact [2], and many genes are packed together in operons – coding sequences with shared regulatory sites.
As shown in the plot, many intergenic sequences are very short (under 50bp long), thus exhibiting, as expected, the bacterial compact packing principle. This means that the genes adjacent to them likely belong to the same operon, as at least 80bp are needed for sigma factors to recruit RNA-pol, and therefore these intergenic regions will not contain a promoter. We also noted that only a few sequences are significantly longer than 300bp. Given this analysis, for the purpose of our model design we chose to define promoters as the first 200 base pairs upstream to the open reading frame (ORF).
Once the promoter set is created, we use gene expression data (supplied by the user) to extract only promoters that are linked to highly expressed genes in optimized organisms. (specifically, we chose the third most highly expressed genes after testing different percentages, because the 33% gave the most diverse and significant signal in terms of the motifs themself). This is helpful in ensuring that chosen promoters are both very active in the optimized organisms (as the gene is highly expressed), and aren't extremely active or present in the deoptimized organisms - because we optimize against the most highly expressed genes in the deoptimized organisms, meaning that if motifs do appear in them, they aren’t very common or active.
Part 2: Motif Discovery
As mentioned earlier, motifs in promoters are short DNA sequences with an important regulatory role: they are binding sites for transcription factors, and so the presence of strong, active motifs in the promoter will result in a higher expression of the gene downstream to it.
Motifs can be conserved – indicating that they fulfill an evolutionarily-crucial job in the species' cell machinery – or varied across different microbial species and communities.
Motif discovery is considered to be a computationally difficult problem to solve; however since there's been extensive research into motifs for some years now, there is no shortage of proposed algorithms that address this challenge with different approaches and objectives.
We reviewed and compared 34 of the algorithms described in an article by Das and Dai [1], searching for the most suitable one for our project according to the following requirements:
- There is existing software available: this would allow us to build a more stable model, quicker.
- Discriminative: for our purposes, motifs should be enriched in one set of organisms relative to the other.
- Not rigid: the algorithm can handle point mutations in motifs.
- Tested in experiments and found to yield results that are compatible with previous knowledge and findings.
- Able to find multiple motifs and multiple instances of a motif in one sequence.
Based on the results of our survey (you can find them HERE), and inspired by the Motif Finder tool developed by 2017 iGEM team TUDelft,we decided to integrate the STREME [14] tool into our model.
Using STREME, all promoters of a specific organism are scanned for sequence motifs that are relatively enriched in the promoters when compared to a control set. STREME uses a hidden Markov model (of a specified order) to scan the query sequences for enriched motifs when compared to a set of control sequences, up to a certain significance threshold (p<0.05 in this case). Motifs were defined to have a length of between 6-20bp.
If you are interested to learn more about the motif discovery process in STREME, we strongly suggest you go straight to the source and read the original article! [14] Alternatively, core components are summarized below.
Click here to read more about STREME.


For a gene to selectively express in a microbiome, motifs in the promoter should meet two conditions:
- Enhance promoter activity in the optimized organisms
- Inhibit transcription initiation in the deoptimized organisms
In order to satisfy the above requirements, we run STREME in two configurations:
- To ensure that the motif plays an important part in initiating promoter activation, we run STREME for each optimized organism with the promoter set as the primary input (i.e. the sequence set where motifs should be enriched) and the intergenic sequences as the control set (where the motifs should not appear). This way, discovered motifs are common only in regulatory sequences, which indicates that the motifs themselves have a regulatory role and are significant to the promoter.
- To ensure selectivity, we run STREME for each optimized organism against each one of the deoptimized organisms, using the optimized organism's promoters as the primary input and the deoptimized organism's promoters as control. The promoter sets used in these runs for both optimized and deoptimized organisms are those which contain only the 33% most expressed promoters. Discovered motifs are therefore those that are found in the optimized organisms and not in the deoptimized ones.
To sum it up, for an input of n optimized organisms and m deoptimized organisms, m+1 sets of motifs are created for each optimized organism, resulting in n(m+1) motif sets overall.

Figure 4.7: Example of a STREME output file.
Part 3: Construction of a Motif Set
Bearing in mind that we need motifs to be both selective and transcription-inducing, we can see that the raw STREME output is not enough on its own – each discovered motif set only meets one condition but not the other.
In a simplified model, with only one optimized organism and one deoptimized organism, and only two STREME runs (intergenic and selective), the solution is pretty instinctive: we construct a new set of motifs that were discovered in both runs and appear in both motif sets. This new set is constructed according to the “tuning parameter”, which expresses the tradeoff between expression optimization in the optimized organisms and deoptimization in the deoptimized organisms.
Motifs, however, can have variable sites, where nucleotides can be one of several options, making exact comparison between motifs an unreliable measure. Therefore, motifs are usually represented by a Position-Specific Scoring Matrix (PSSM) – a matrix of size 4×L (where L is the motif's length), containing scores that indicate how likely it is for each nucleotide to appear in each position in the motif. The calculation of a PSSM assumes the independence of the motif's sites from one another, and that no insertions or deletions are allowed. These assumptions are reasonable for the purpose of our analysis, considering that they are supposed to represent a binding site of a transcription factor, thus gaps and deletions would change the structure of a motif and prevent it from being recognized.

Figure 4.8: Example of a motif representation.
(A) shows a PSSM of a 7bp motif, and (B) shows the graphic representation (logo) of the same motif's composition (made by STREME). We can see that nucleotides with higher scores in a certain position are more prevalent.
Using the motif PSSMs, we calculate for each pair of motifs their Spearman correlation, which constitutes a measurement of similarity between them. We include in our updated motif set only selective motifs that were found to be highly correlated (i.e. with a correlation score above a certain threshold) to at least one motif from the intergenic set.
This simplified solution is then applied in order to perform multiple-organism optimization - we now want to find motifs that induce transcription across all optimized organisms, while not being too active in the deoptimized ones.
This is a much more complex challenge, and one that doesn't necessarily have one, clear, global optimum or that can be solved within a reasonable runtime, therefore we proposed a system of novel heuristics in order to suit our demands.
Click here to read more about the algorithm.
Motif correlation matrix visualization
As stated, 2 motifs sets are detected- motifs that are enriched in highly expressed promoters compared to intergenic regions, named “intergenic motifs”, and motifs uniquely found in promoters of one organism and not in the other, named “selective motifs”.
Motif sets from both STREME runs were compared in order to find motifs that were both enhancing expression and were selective to the optimized organism. The following comparison process in conducted:
For every pair of motifs from different sets:
- The position specific scoring matrix of the motifs is flattened and turned into a one-dimensional vector
- Spearman correlation between the two vectors is measured- higher correlations (closer to 1) indicate that the compared motifs are similar
- If the two motifs have different lengths, fillers are added to the shorter motif in all possible ways, then the correlation for each filler confirmation is measured- the highest correlation is regarded as the overall similarity score.

Figure 4.9: Correlation between selective (rows) and transcription-enhancing (intergenic) sets (columns) of motifs from both B. subtilis and E. coli.
As seen in the comparison matrices, there is no innate correlation between selective motifs and transcription enhancing motifs originating from the same organism. This highlights the importance of constructing a new motif set, because usage of just one of the generated sets in this case would not have satisfied the requirements for the other selection type. Moreover, this matrix shows that the selection process we chose compliments the nature of this correlation and allows selection of the motifs that are shared between the two sets and accurately represent the properties that are selected for.
Part 4: Promoter Ranking by Motifs
One of the advantages of using STREME is that it is part of a large ensemble of bioinformatic tools designed for all types of motif analysis. This ensemble, named the MEME Suite [8], contains a second useful tool, MAST [4].
MAST (motif alignment and search tool) is used to scan for motifs in a set of promoters, aligning them to the sequences and then ranking the promoters based on the Expect Value (E-value) of those alignments. The E-value is a useful and common measure for the significance of one's findings, and it can be interpreted as the probability of a random sequence matching the motifs as well as the input promoter. Therefore, a low E-value means that a randomly generated sequence will very likely not match the motifs well, indicating that the alignment made by MAST is significant.
The motif set used is the set F created in the previous step of this module, and the promoter set used is defaulted to be the union of all of the highly expressed promoters endogenous to the optimized organisms. Alternatively, the user is able to provide their own set of promoters in order to conserve transcription regulation characteristics (as the promoters define the expression pattern of a gene).
The top quartile of highly expressed promoters were then scanned for the top-scoring motifs using MAST, and the resulting score for each promoter is compared to its expression level, in order to find promoters that are both well-expressed and best match the desired motifs, making them the best candidates for additional synthetic modification.
Click here to read more about how MAST works

MAST's ranking abilities also allowed us to conduct preliminary quality and sanity checks, in order to make sure that the results had a biological sense to them and that we were heading in the right direction.
We conducted these checks on the simplified bi-organismic model with Bacillus subtilis as the optimized organism and Escherichia coli as the deoptimized one. Before applying our model to the data, we asked ourselves what type of results and correlations we would expect to get, according to biological logic. For example:
- We expect to see a low correlation between E. coli promoters that match E. coli-enriched-motifs and E. coli promoters that match B. subtilis-enriched motifs. This means that E. coli promoters which strongly match motifs that are common in E. coli, will likely not contain motifs frequent in B. subtilis.
- We expect that the scoring of motifs that are common in B. subtilis but not in E. coli to E. coli promoters to be relatively weak, exhibiting a higher E-value score. This expectation follows the very core principle of differential enrichment that STREME aims to fulfil.
Motif mapping visualization
After finding the selective motif set for E. coli and B. subtilis, we mapped the found motifs to the top quartile (in terms of expression) of promoters:

Figure 4.11: MAST promoter search for top quartile promoters in B. Subtilis.
Figure 4.12: MAST promoter search for top quartile promoters in E. Coli.
Motif mapping scores
The found sets of motifs were used to score the endogenous promoters of E. coli and B. subtilis.
*Note: as previously explained, a lower E-value is more significant thus indicates a better match between the sequence and the motif set.
Figure 4.13: Scoring E. coli endogenous promoters (red) and B. subtilis endogenous promoters (blue), with the motifs selectively enhanced in E. coli (left) and the motifs selectively enhanced in B. subtilis (right).
A very strong conclusion can be deduced from these graphs- endogenous promoters score better (smaller E-value) with their set of motifs than the motifs of the other organism. Thus, the motifs are able to differentiate between endogenous and non endogenous promoters, promoting the selectivity of expression goal.
Part 5: Promoter Synthetic Alteration
After identifying the best promoter candidates for the job, which contain motifs that help transcription initiation in the optimized organisms and are also selective, we thought of introducing an additional optimizing component to the module.
While looking at the MAST results, we noticed that motif-promoter alignments tend – as they do in many other biological contexts – not to be perfect. This means that when we align a motif to the relevant region of the promoter, mismatches can be found along the sequence, where the nucleotide in the motif and the nucleotide in the promoter are not the same (since motif sites can be variable, we define the motif's nucleotide in a certain position as the nucleotide with the best PSSM score for this position).
Therefore, our model alters the promoter in those mismatched sites, changing them into the motif's nucleotides in order to achieve a better matching to the motif, thus allowing for stronger binding of transcription factors to the motifs and enhancing promoter activity and transcription.

Figure 4.14: Example of an alignment of two motifs to a promoter, made by MAST.
A ‘+’ sign indicates an exact match between nucleotides, and a gap indicates a mismatch. Our model modifies the promoter in every mismatch site to the most prominent nucleotide in the PSSM.
References
- M. K. Das and H.-K. Dai, “A survey of DNA motif finding algorithms,” BMC Bioinformatics, vol. 8, no. S7, 2007.
- P. C. Kirchberger, M. L. Schmidt, and H. Ochman, “The ingenuity of bacterial genomes,” Annual Review of Microbiology, vol. 74, no. 1, pp. 815–834, 2020.
- R. A. Fisher, “Statistical methods for research workers,” Springer Series in Statistics, pp. 66–70, 1992.
- T. L. Bailey and M. Gribskov, “Combining evidence using P-values: Application to sequence homology searches,” Bioinformatics, vol. 14, no. 1, pp. 48–54, 1998.
- R. Hershberg, “PROMEC: An updated database of escherichia coli mrna promoters with experimentally identified transcriptional start sites,” Nucleic Acids Research, vol. 29, no. 1, p. 277, 2001.
- S. S. Shen-Orr, R. Milo, S. Mangan, and U. Alon, “Network motifs in the transcriptional regulation network of escherichia coli,” Nature Genetics, vol. 31, no. 1, pp. 64–68, 2002.
- N. Sierro, Y. Makita, M. de Hoon, and K. Nakai, “DBTBS: A database of transcriptional regulation in bacillus subtilis containing upstream intergenic conservation information,” Nucleic Acids Research, vol. 36, no. suppl_1, 2007.
- T. L. Bailey, M. Boden, F. A. Buske, M. Frith, C. E. Grant, L. Clementi, J. Ren, W. W. Li, and W. S. Noble, “Meme Suite: Tools for motif discovery and searching,” Nucleic Acids Research, vol. 37, no. Web Server, 2009.
- M. Paget, “Bacterial sigma factors and anti-sigma factors: Structure, function and distribution,” Biomolecules, vol. 5, no. 3, pp. 1245–1265, 2015.
- Y. Song, J. M. Nikoloff, G. Fu, J. Chen, Q. Li, N. Xie, P. Zheng, J. Sun, and D. Zhang, “Promoter screening from bacillus subtilis in various conditions hunting for synthetic biology and Industrial Applications,” PLOS ONE, vol. 11, no. 7, 2016.
- S. Guiziou, V. Sauveplane, H.-J. Chang, C. Clerté, N. Declerck, M. Jules, and J. Bonnet, “A part toolbox to tune genetic expression in Bacillus subtilis,” Nucleic Acids Research, 2016.
- A. Santos-Zavaleta, H. Salgado, S. Gama-Castro, M. Sánchez-Pérez, L. Gómez-Romero, D. Ledezma-Tejeida, J. S. García-Sotelo, K. Alquicira-Hernández, L. J. Muñiz-Rascado, P. Peña-Loredo, C. Ishida-Gutiérrez, D. A. Velázquez-Ramírez, V. Del Moral-Chávez, C. Bonavides-Martínez, C.-F. Méndez-Cruz, J. Galagan, and J. Collado-Vides, “RegulonDB v 10.5: Tackling challenges to unify classic and high throughput knowledge of gene regulation in E. coli K-12,” Nucleic Acids Research, vol. 47, no. D1, 2018.
- R. V. Coelho, S. de Avila e Silva, S. Echeverrigaray, and A. P. Delamare, “Bacillus subtilis promoter sequences data set for promoter prediction in gram-positive bacteria,” Data in Brief, vol. 19, pp. 264–270, 2018.
- T. L. Bailey, “Streme: Accurate and versatile sequence motif discovery,” Bioinformatics, vol. 37, no. 18, pp. 2834–2840, 2021.
- W. Su, M.-L. Liu, Y.-H. Yang, J.-S. Wang, S.-H. Li, H. Lv, F.-Y. Dao, H. Yang, and H. Lin, “PPD: A manually curated database for experimentally verified prokaryotic promoters,” Journal of Molecular Biology, vol. 433, no. 11, p. 166860, 2021.
Restriction Sites

Figure 5.1: Restriction sites enable cutting the plasmid in a specific place

Figure 5.2: Summary of restriction enzymes optimization
Summary
Restriction enzymes are part of the natural immune system of bacteria, they digest foreign DNA by cleaving specific areas determined by the nucleotide sequence. The restriction enzyme footprint of different bacteria is unique, therefore different bacterial organisms contain distinct sets of restriction enzymes. The present model generates a database of restriction enzymes that are present in the varying organisms. Such data is used first and foremost in order to avoid restriction sites of enzymes that are present in the optimized organisms. Moreover, restriction enzymes that are found only in the deoptimized organisms are examined and corresponding restriction sites are added to various parts of the designed plasmid (the effect of insertion of such sites in different plasmid elements is experimentally tested).
Part 1: Detection of Target Sites
All relevant restriction sites are found; this includes sites originating from all enzymes within the microbiome, for both optimized and deoptimized organisms. This is done in order to avoid sites present in the optimized organisms and insert sites present in the deoptimized organisms.
To achieve this, we used the REbase,which contains documentation of the origin of the restriction enzyme and the site it recognizes. It is constantly being updated, and we used the latest version present (REbase version 108, published on 30.07.21) which contains 5878 different enzymes.
Part 2: Mapping Sites to Sequence
The retrieved sites are filtered according to their potential presence in the open reading frame. If a site could be inserted into the ORF without causing non-synonymous changes, it is labeled as a relevant site and passed to the next step.
Part 3: Insertion and Avoidance of the New Sequences
The relevant sites are then sorted into two groups: sites present in the optimized organisms, and sites present in the deoptimized organisms.
Step 1: Insertion of novel sites present in the deoptimized organisms into the open reading frame. The main challenge in this step is that insertion of sites that overlap can and usually does disrupt them, therefore we planned a novel algorithm to overcome this:
- Map where each restriction site falls along the open reading frame of the optimized gene
- Insert sites that do not cause conflicts (non-overlapping)
- For overlapping sites: in each overlapping position, insert the site that increases the number of different organisms that have a site in the sequence. If there are a couple of options, pick the site originating from the organism with the smallest amount of restriction sites.
Using this heuristic, we are able to optimize both the number of sites and the number of organisms that have a site inserted in the genetic sequence. This allows us to promote efficient digestion of the sequence in the largest number of deoptimized hosts.
Step 2: In order to avoid sites present in the optimized organisms (again, without causing synonymous changes), we used the corresponding module in the DnaChisel software tool.
The order of these two steps is very important because a possible byproduct of insertion of a site is the creation of a new restriction site that might be present in the optimized organisms, which might accidentally increase digestion in optimized organisms, and should be avoided.
Optimization Score
The following optimization scores are aimed to estimate the change of the codon usage bias, or CUB values of the optimized sequence with respect to each organism in the community, in comparison to the original CUB values.
** It should be mentioned that in case both CAI and tAI optimizations can be performed, the optimization scores are calculated for both optimizations, and the sequence with the more optimal score is selected. For simplification, the following explanation will refer only to CAI, but means to tAI as well.
Optimization Index - weighted mean:
The calculation is performed according to the following algorithm:
The following steps should be performed for each one of the organisms in the community:
- Creating the population by calculating the CAI for each gene of the organism.
- Calculating the CAI of the original sequence, and the CAI of the optimized sequence.
- Calculating the number of standard deviations by which the original sequence score is distant from the optimized sequence score, according to the following formula:

Equation (6.1)
Where:X’ is the CAI of the optimized sequence, X is the CAI of the original sequence, and is the standard deviation of the population.
These scores are then used to calculate two optimization scores:
Weakest link score
This score focuses on the margins of the two groups (optimized and deoptimized)
- The scores of the organism that was least optimized from the optimized group and the organism that was least deoptimized from the deoptimized group are extracted
- A weighted difference between them is calculated and defined as the “weakest link” score:

Equation (6.2)
Where alpha is the optimization tuning parameter.
In this optimization, any positive score indicates that the margins of the two groups are separated, so that even the organism that was least able to be optimized is still better than all of the optimized organisms. Moreother, when looking at the clusters of the two organisms - this score indicates the two clusters are fully separated.
Average difference score
This score describes the average distance in the optimization between the optimized and deoptimized groups, and is calculated according to the following steps:
- Dividing the organisms into two groups: one group in which we want to optimize the gene expression, and another group in which we want to deoptimize the gene expression. For each group, calculating the mean distance according the following formula

Equation (6.3)Where N is the number of organisms in the group.
- Calculating the weighted mean of the mean distances according to the optimization tuning parameter. The calculation is given by the following formula:

Equation (6.4)
Where alpha is the optimization tuning parameter
In this optimization, a positive score means the optimization worked well (higher/lower CUB values with respect to optimized/deoptimized organisms correspondingly, in comparison to the original values). The higher the index, the more selective the optimization.
In the log file of our software, additional scores can be found, such as:
- Average score of the optimized organisms
- Average score of the deoptimized organisms


