Team:TAU Israel/Engineering

Engineering Success

Figure 1: The engineering cycles
In our project, our long-term goal is to broaden the achievable horizons when it comes to microbiome engineering, and to progress biological development in the real world. Due to this ambitious ideology, we had to conduct extensive research on every building block and component inserted, then analyse them together, and finally design the engineering process in a user-friendly configurable manner.
Each one of these three engineering cycles was carefully designed according to the previous cycle, greatly impacting the following one and our general insights regarding this approach. In this section, we aim to introduce you to the engineering process that happened behind the scenes, and expose the various challenges while clarifying the background for our strategies.
Part 1: Designing multi-organism optimizations
As previously stated, in order to achieve our premise, we decided to model and selectively optimize the core biophysical processes related to gene expression. Most of these processes have been modeled to some degree for a single organism, however this knowledge must be used for the following 3 consecutive goals:
- Learn: Finding variability among the species in the microbiome
- Design: Understanding multiorgnaism preferences and trends
- Build: Re-designing genetic components according to the novel information - implementing both optimization and deoptimization simultaneously
- Test out model
This process is demonstrated in all 3 main models:
Entrance into the cells
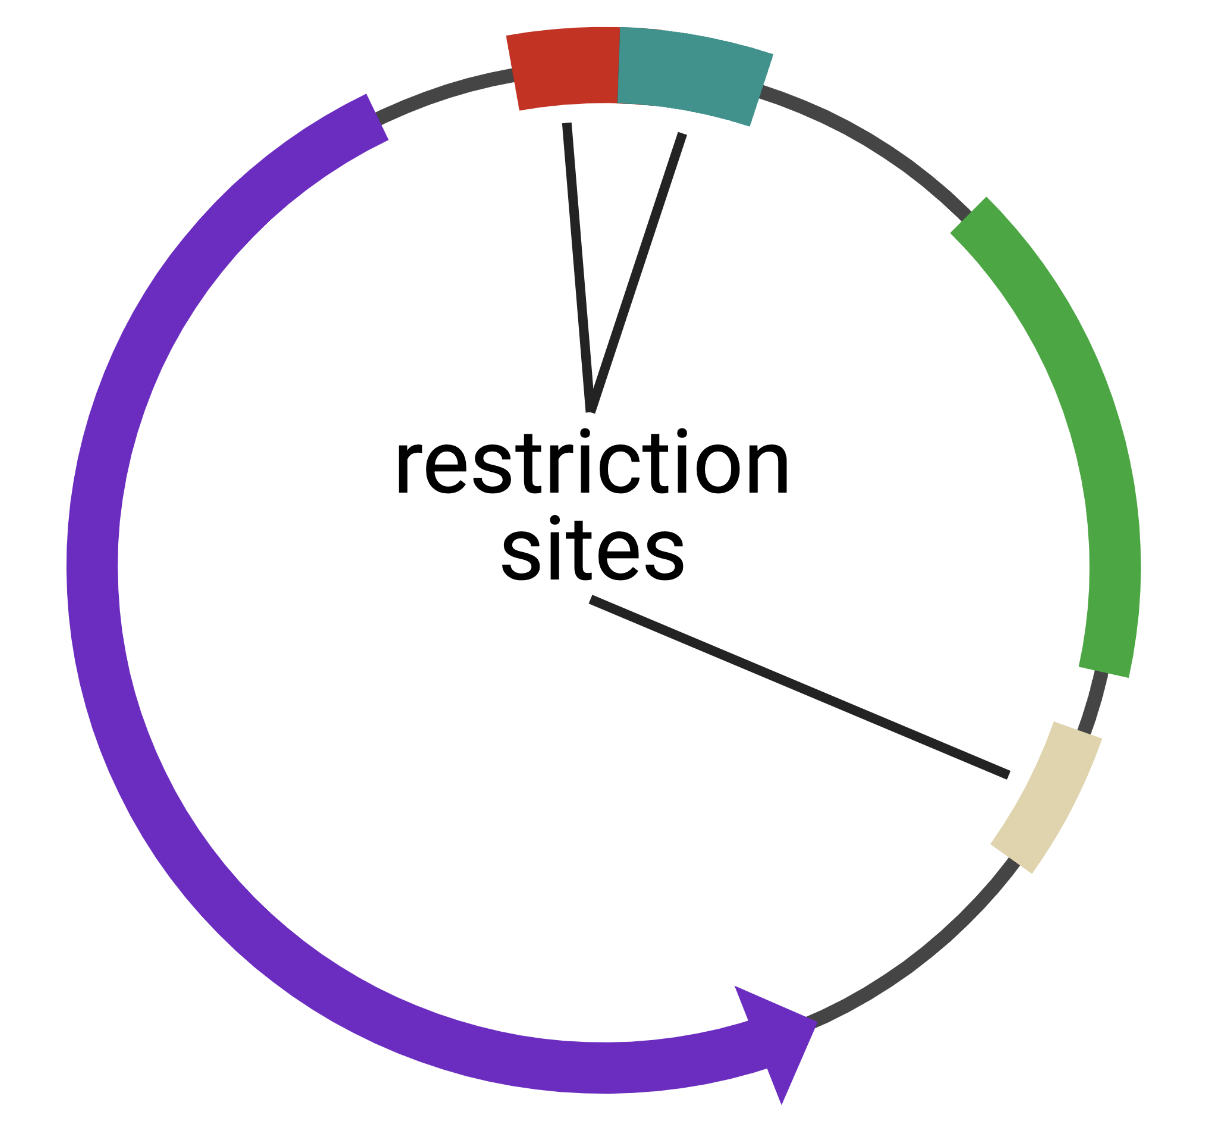
Figure 2: Interfering restriction sites
Our purpose was to optimally edit restriction sites. This problem can easily be solved for one organism, as the degrees of freedom within different genetic components are known.
However, in our approach, we wanted to insert sites present in the deoptimized organisms and avoid any sites present in the optimized organisms.
- Learn: We characterized the restriction enzyme database in order to characterize the origin of different restriction sites and piece together organisms with their correspondingly recognized restriction sites.
- Design: We designed a dual-organism model for one optimized and one deoptimized species, coordinating synonyms insertion and avoidance of restriction sites.
- Build: Our problem was that different restriction sites interfere with each other, causing conflicts and dependencies between different sites and organisms. Thus, we decided to build a novel algorithm and implement it to take the variation in placing and number of sites from each organism into account.
- Test: When applying this model, it did not insert sites from the optimized organisms (despite rare cases characterized in the software log files).
Transcription
Different organisms utilize different transcription factors in order to promote the transcription initiation, as each of these factors recognises different sets of genomic sequences described as “motifs”.
- Learn: We reviewed different motif-finding tools and characterized them in our future contribution.
- Design: We picked the MEME-suite tools and built a dual-organism model, that crosses the set of motifs that are selectively found in one organism compared to the other, with the set found in promoters compared to intergenic regions
- Build: We used the selective-motif principle in order to devise a novel algorithm described in the transcription optimization model that can take those two needed features (efficiency and selectivity) into account. This can be done using the motif set construction strategy.
- Test: We tested our model in our POC; Go check our results!
Translation
During evolution, cellular machinery has adapted to translate certain codons more optimally than others. Different genetic information can be used in order to infer the profile of preferred codons (also known as the codon usage bias, or CUB) of each organism.
- Learn: Researched different CUB - we looked into traditional codon harmonization techniques such as CAI (codon adaptation index) and tAI (tRNA adaptation index), and even examined a new approach using ribo-seq profiling called TDR (typical decoding rate).
- Design: We devised an initial selective optimization strategy similar to the single codon approach, and examined two different implementations- optimization of the score difference between the optimized and deoptimized organism, and optimization of the score ratio.
- Build: We took the mCherry fluorescent gene and optimized translation in B. subtilis while simultaneously deoptimizing it for E. coli. We did this for all specified CUB measurements.
- Test: Tested the results in the wet lab, and found out that tAI worked really well. (See Results)
Part 2: Analysis
Due to the computational and biological novelty of our two goals - whole microbiome design, and simultaneous optimization and deoptimization - this engineering cycle was not conducted perfectly; we had to revisit the steps according to feedback and due non satisfactory results. However, we recognise the importance of this imperfect learning and engineering cycle, as it exhibits the wide potential of analysis and advancements that can be made to and using our models.
Additionally, we hope that this thinking process will inspire future iGEM teams to not to stick to traditional methods and strive to develop basic assessment strategies for their innovations, as well as broaden the arsenal of computational synthetic biology analysis mechanisms to fit the rapid evolution of this field.
Initial cycle
This engineering cycle bridges the individual models with the analysis process
- Learn: when analysing our experimental results we examined the performance of the designed sequences in the lab, we performed many analysis processes which you can find in our results. A consistently evident conclusion was that the two best codon usage bias scores for our optimization were CAI and tAI (Figure 3):

Figure 3: Optimized fluorescence ratio shows optimization successAs seen in this graph, the fluorescence of B. subtilis was nearly 12 times better than E. coli for CAI optimization, and 9 times better in TAI-ration.
After finding out that tRNA optimizations worked exceptionally well, we made an effort to find the optimal way to precisely calculate without impacting the number of organisms that can be optimized by the software. We compared the tGCN (tRNA gene copy numbers) from NCBI and the GtRNAdb only to find that the quality of the tRNA was worth it’s limitations.
- Design: Devised comparison strategies between CUB measurements. Our initial optimization score was a traditional implementation of the statistical Z-score.
Click here to read more about our initial optimization analysis.


Design - second attempt
We re-designed our optimization score (which is the current version) to be more user friendly and biologically correct, by fitting the mathematical nature of the measurement to the behavior of selective translation efficiency optimization.
Test - second attempt
After testing the new statistical optimization score on our Arabidopsis microbiome for the correlation between evolutionary distance and model performance, we still received problematic results:

Figure 4: Correlation between optimization score and evolutionary distance (measured as number of different positions in the sequence alignment of the 16S rRNA).
For more information about this analysis revisit the software analysis page.
In Figure 4:
- Red points = optimization failed
- Green point = optimization succeeded
It is clear from this graph that the optimization is not very successful in most cases, and optimization chances are relatively low for closely related organisms.
After this encounter, we understood that the single codon optimization does not take into account the significance of the codon usage bias score change of the protein in the context of the whole microbiome. I.e., if an organism has very close codon usage bias scores for all proteins, even a small change in CUB can be significant.
For example (Figure 5):

Figure 5: The standard deviation of CAI scores of the proteome of the bacteria in A.thaliana root microbiome which was used for software analysis.
As seen in Figure 5, there is a order of magnitude difference in the standard deviation of CAI scores of the endogenous proteins for different bacteria present in the A. thaliana root microbiome that was analysed.
We the returned to the third step:
Build - third attempt
We devised a whole microbiome hill climbing optimization approach in order to achieve our goal.
Test - third attempt
Once we finished implementing the new optimization strategy, we analysed the results and were able to both improve correlation between the performance and evolutionary distance and improve overall optimization capabilities, especially for closely related organisms. Review our results for all optimization strategies in the software analysis page.


