Team:TAS Taipei/Experiments

ENZYME EXPERIMENTS
Overview
In order to create our system to enzymatically cleave A and B surface antigens from A, B, and AB type red blood cells (RBCs) and convert them to universal O type, we selected three glycoside hydrolase enzymes for their specific functions: α-Galactosidase (α-Gal) to cleave B antigens, α-N-Acetylgalactosaminidase (NAGA) to cleave A antigens, and Endo-β-Galactosidase (Endo-β-gal) to cleave both A and B antigens (Fig 2). We designed plasmid constructs to maximize the expression of these enzymes in BL21 Escherichia coli (E. coli), purified these histidine tagged enzymes, confirmed sizes via SDS-PAGE, and validated their functionality using colorimetric tests, thin-layer chromatography (TLC), and mass spectroscopy. We further evaluated enzyme cleavage on pRBCs/porcine red blood cells (Refer to Fig. 1 for experiments flowchart).

Figure 1 - Enzyme Experiments Overview

Figure 2 - Blood group B antigen (left), Blood group A antigen (middle), Blood group H antigen (right) are represented, with scissors representing enzymes hydrolyzing respective antigens.
Enzyme Properties
We identified the three enzymes: α-Galactosidase (Bacteroides fragilis), α-N-Acetylgalactosaminidase (Elizabethkingia meningoseptica), and Endo-β-Galactosidase (Streptococcus pneumoniae) through a systematic literature search, as well as their properties including optimum temperature, pH, molecular masses, known substrates, and source organisms (Table 1). These enzymes were selected for their ability to cleave respective blood group antigens at either room temperature or human body temperature; furthermore, they are able to exhibit activity at pH levels close to that of human blood, which makes them suitable for our project.
Table 1 - Properties of Selected Enzymes (Liu et al., 2008), (Liu et al., 2007), (Fukuda and Matsumura, 1979), (Shaikh et al., 2009)

Construct Designs
α-Galactosidase (Bacteriodes Fragilis) - BBa_K3717009
α-Galactosidase (α-Gal) is an enzyme that catalyzes the cleavage of the terminal galactose of B type blood antigens (Rahfeld and Withers, 2019). The resultant antigen is the H antigen, which the anti-A and anti-B antibodies are unable to recognize and hence does not elicit an immune response in the human body. Thus, α-Gal can convert B blood types to universal O type.
We obtained the amino acid sequence of the α-Gal protein, derived from Bacteroides fragilis (UniProt, 2021), which served as our Open Reading Frame (ORF; BBa_K3717006). We attached a T7 promoter, derived from the T7 phage, and strong ribosome binding site (RBS; BBa_K525998) upstream of the open reading frame (ORF), a 6x Histidine tag through a flexible Glycine-Serine linker upstream of the enzyme sequence in the open reading frame for protein purification purposes, and a double terminator (BBa_B0015) downstream of the ORF. The composite gene (BBa_K3717009) was synthesized through IDT.

Figure 3 - Construct of α-Galactosidase with T7 promoter, strong RBS, N-Terminal 6x Histidine-tag, and Double Terminator (BBa_K3717009).
α-N-Acetylgalactosaminidase (Elizabethkingia Meningoseptica) (BBa_K3717013)
α-N-Acetylgalactosaminidase (NAGA) is an enzyme that catalyzes the cleavage of the terminal N-acetylgalactosamine of A type blood antigens (Rahfeld and Withers, 2019). The resultant antigen is the H antigen, which the anti-A and anti-B antibodies are unable to recognize and hence does not elicit an immune response in the human body. Thus, NAGA can convert A blood types to universal O type.
We obtained the amino acid sequence of the α-Gal protein, derived from Elizabethkingia meningoseptica (UniProt, 2021), which served as our Open Reading Frame (ORF; BBa_K3717016). We attached a T7 promoter, derived from the T7 phage, and strong ribosome binding site (RBS; BBa_K525998) upstream of the open reading frame (ORF), a 6x Histidine tag through a flexible Glycine-Serine linker upstream of the enzyme sequence in the open reading frame for protein purification purposes, and a double terminator (BBa_B0015) downstream of the ORF. The composite gene (BBa_K3717013) was synthesized through IDT.
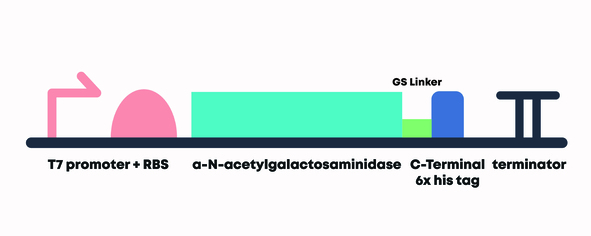
Figure 4 - Construct of α-N-Acetylgalactosaminidase with T7 promoter, strong RBS, C-Terminal 6x Histidine tag, and Double Terminator (BBa_K3717013).
Endo-β-Galactosidase (Streptococcus Pneumoniae) BBa_K3717011
Endo-β-Galactosidase (Endo-β-gal) is an enzyme that catalyzes the cleavage of both A and B type blood antigen trisaccharides such that the remaining sugar can be classified as a precursor to the H antigen, which anti-A and anti-B antibodies are unable to recognize and hence does not elicit an immune response in the human body (Rahfeld and Withers, 2019). Thus, the enzyme can convert both A and B blood types to universal O type.
We obtained the amino acid sequence of the Endo-β-gal protein, derived from Streptococcus pneumoniae, that Kwan et. al performed iterative steps of directed evolution on to increase the activity of the enzyme by around 170-fold (Kwan, 2015). This sequence served as our Open Reading Frame (ORF; BBa_K3717008). We attached a T7 promoter, derived from the T7 phage, strong ribosome binding site (RBS; BBa_K525998) upstream of the open reading frame (ORF), a 6x Histidine tag through a flexible Glycine-Serine linker in the open reading frame, upstream of the Endo-β-gal sequence for protein purification purposes, and a double terminator (BBa_B0015) downstream of the ORF. The composite gene BBa_K3717011 was synthesized through IDT.

Figure 5 - Construct of Endo-β-Galactosidase with T7 promoter, strong RBS, 6x N-Terminal Histidine Tag and Double Terminator (BBa_K3717011).
Protein Expression and Purification
We transformed synthesized plasmids into BL21 (DE3) E. coli cells. We grew cultures at 37°C overnight, diluted those cultures, and then grew them to OD600 0.5~0.6 at 37°C. We then induced expression with 0.5 mM IPTG and allowed cultures to grow overnight at room temperature. We harvested cells by centrifugation and lysed cell pellets through either sonication or with xTractor Lysis Buffer (XTractorTM Buffer & XTractor Buffer Kit User Manual, n.d.) supplemented with 20 mM imidazole. We purified our histidine-tagged proteins using Ni sepharose affinity chromatography. We then utilized SDS-PAGE to confirm the sizes of purified proteins.
Our results show histidine-α-Gal and NAGA-histidine migrating at the expected sizes of 69.7 kDa and 51.7 kDa, respectively (Figs 6-7). We were unable to express or purify histidine-Endo-β-Gal. We buffer exchanged our successfully purified enzymes into 0.1 M Sodium Phosphate buffer (pH 7.4) by dialysis due to unfavorable reaction conditions in the eluent, and concentrated the solution to 0.5 mL using centrifugal ultrafiltration.

Figure 6 - SDS-PAGE results show that E.coli is able to express α-Galactosidase (BBa_K3717009). The expected size of 69.7 kDa is indicated by the red triangle. However, α-Gal did not express as strongly as expected, producing a faint band.

Figure 7 - SDS-PAGE results show that E.coli is able to express NAGA (BBa_K3717013). The expected size of 51.7 kDa is indicated by the red triangle.
Functional Tests
We confirmed the functionality of α-N-Acetylgalactosaminidase (NAGA), α-Galactosidase (α-Gal), and Endo-β-Galactosidase (Endo-β-gal) by using several assays: colorimetric tests, thin-layer chromatography, and mass spectroscopy. Because we were unable to successfully purify Endo-β-gal, we elected to use β-galactosidase from E. coli as a substitute for the following assays. Similar to Endo-β-gal, β-galactosidase is also able to hydrolyze β-glycosidic bonds formed between a galactose and its organic moiety (Garrett, 2013). Therefore, we hypothesize β-galactosidase to be a suitable alternative for our Endo-β-gal functional tests. We averaged results from at least 3 independent trials from the colorimetric assay for each enzyme to calculate Michaelis–Menten constants for enzyme efficiency (see enzyme model in modeling).
Colorimetric Substrate Tests
We obtained colorimetric substrates for each of the enzymes from Sigma Aldrich (Fig 8). These substrates contain either a 4-nitrophenol or 2-nitrophenol leaving group, which turn yellow upon successful cleavage in solution. The concentration of 4-nitrophenol and 2-nitrophenol can be quantified at absorbance 405 and 415 nm, respectively, using a 96 well plate assay (Held, BioTek).

Figure 8 - Colorimetric substrates for α-Gal, NAGA, and Endo-β-gal.
We performed small-scale colorimetric tests to verify the function of the enzymes. To each well, we added 50 μL of 10 mM substrate, 10 μL of enzyme, 30 μL of water, and 10 μL of 10x Glycobuffer 1 (50 mM CaCl2, 500 mM sodium acetate, pH 5.5), a buffer recommended by New England Biolabs to ensure optimal enzyme activity (NEB). Following 2 hours of reaction at room temperature, we diluted the well contents in 1.9 mL of water and took absorbance readings at 405 nm. Results indicate both α-Gal and NAGA successfully cleaved their respective substrates (Fig 9). Moreover, we demonstrated the specificity of the enzymes through the lack of enzyme activity on the other substrate.

Figure 9 - Absorbance of reaction solutions in small-scale colorimetric tests verify the functionality and specificity of the enzymes. a) 96-well plates following enzyme reaction. b) absorbance readings of diluted well contents (accounted for dilution). c) buffers and solutions used in substrate and control wells.
To quantify the activity of the enzymes, we performed enzyme reactions at various substrate concentrations and measured the absorbance at different time intervals over a constant time period (Figs 10-12). We averaged results from at least 3 independent trials for each enzyme to calculate Michaelis–Menten constants for enzyme efficiency (see enzyme model in modeling).

Figure 10 - Absorbance over time for various α-Gal substrate concentrations

Figure 11 - Absorbance over time for various β-gal substrate concentrations

Figure 12 - Absorbance over time for various NAGA substrate concentrations
Thin Layer Chromatography
In order to evaluate the enzymatic activity of β-gal and α-Gal, we used lactose and melibiose, respectively, as the substrates for enzyme reactions followed by detection through normal-phase thin-layer chromatography (TLC), which utilizes the competition of the solute and mobile phase for binding sites to separate compounds based on affinity. β-gal can cleave the glycosidic bonds in lactose while α-Gal can cleave the bonds in melibiose, causing the dissolution of lactose and melibiose into their constituent monosaccharides, glucose and galactose. Expected activity of Endo-β-gal can be extrapolated from β-gal in this test due to their similarity (Fig 13).

Figure 13 - Molecular structure of lactose and melibiose. Enzymatic cleavage of glycosidic linkage results in glucose and galactose monosaccharides.
We detected the cleavage of the disaccharides through TLC. To determine if cleavage occurred, we devised a method to test if the disaccharides were present in solution, or if only galactose and glucose product was present, indicating complete cleavage.
To test our method, we spotted controls of melibiose, lactose, as well as glucose and galactose samples onto TLC plates then run with a mobile phase of ethyl acetate : ethanol : acetic acid : boric acid (5:2:1:1, v/v/v/v) (Fig 14). We visualized the plate with a spraying reagent consisting of sulfuric acid : ethanol (1:1, v/v), followed by heating at 140°C for 5 minutes. We observed bands both in ambient light and at 365 nm, and we measured hRf values as the solute front (orange line) divided by the solvent front (yellow line) multiplied by 100. Based on our experiments, we were able to determine that glucose and galactose migrate significantly further up the plate compared to lactose and melibiose, with hRf values of 55.9 ± 2.8 for glucose and galactose, 33.3 ± 1.3 for lactose, and 33.1 ± 1.4 for melibiose.

Figure 14 - Simultaneous TLC of melibiose, lactose, and glucose with galactose controls. a) Visualized plate at 365 nm. b) TLC parameters used and averaged hRf values calculated.
With our TLC detection method in place, we proceeded to first test the functionality of β-gal. We incubated 10 μL of 10 mg/mL lactose with 5 μL of enzyme or water (negative control) and 5 μL of 0.1 M citrate-phosphate buffer (pH 5.8) at room temperature (Takasaki 1975). After 5, 10, 20, 30, and 40 minutes of reaction time, we spotted a sample of the reaction solution on a TLC plate, to monitor the progression of enzyme activity over time. We use the predetermined (see above) TLC parameters and visualization steps to develop the plate (Fig 15). Our results demonstrate successful cleavage by β-gal, and that complete cleavage occurs at approximately 40 minutes of incubation. The functionality of β-gal suggests that Endo-β-gal may also be functional in hydrolyzing lactose.
We used the same process to test the functionality of α-Gal. We incubated 10 μL of 10 mg/mL melibiose with 5 μL of enzyme or water (negative control) and 5 μL of 0.1 M citrate-phosphate buffer (pH 5.8) at room temperature for a total reaction time of 2 hours. We then spotted the control and enzyme reaction sample on TLC plates and developed them (Fig 16). Our results demonstrate successful cleavage by α-Gal, as indicated by the band with a hRf that corresponds approximately to the measured hRf of glucose and galactose.

Figure 15 - TLC plates of lactose treated with β-gal with lactose and glucose and galactose controls at ambient light (left) and 365 nm (right). Solutions were spotted in the order of lactose control, enzyme reaction after 5, 10, 20, 30, and 40 minutes, and control mixture of glucose and galactose. There is clear cleavage of lactose into glucose and galactose from the enzyme reaction.

Figure 16 - TLC plate of melibiose treated with water and α-Gal under ambient light. There is clear cleavage of melibiose into glucose and galactose from the enzyme reaction.
Mass Spectroscopy Trisaccharide Antigen Tests
Given that the colorimetric results were positive, we wanted to further test the enzymes’ specificity by using trisaccharides as substrates. These trisaccharides contain three monosaccharides that have identical chemical structures to the A and B antigens found on RBCs. To test a proof of concept functionality of α-Gal in cleaving the B-antigen trisaccharide and NAGA in cleaving the A-antigen trisaccharide, we carried out a reaction of the enzyme and its corresponding trisaccharide dissolved in 1X GlycoBuffer (New England BioLabs), deionized water, and purified BSA for 1 hour at 37°C. A-antigen and B-antigen trisaccharides were kindly supplied by Professor Dr. Todd Lowary from the Institute of Biological Chemistry at Academic Sinica (Lowary, 2010).
For each enzyme, a non-specific trisaccharide served as a negative control and the trisaccharide specific to the enzyme served as the experimental unit (Table 2).
Table 2 - Experimental setup for enzyme-antigen tests

After the reaction, the reaction solution was passed through C18 columns to minimize impurities from the reaction solution. We then evaluated the flow through solution with a mass spectrometer to measure peaks in molar mass in order to determine the compounds present in the reaction solution. The original molar mass of the A-antigen is 713.35 g/mol (Lowary, 2010); therefore, after cleavage, two fragments with molar masses of 510.27 g/mol and 203.08 g/mol are expected to form. The original molar mass of the B-antigen is 672.32 g/mol (Lowary, 2010); therefore, after cleavage, two fragments with molar masses of 510.27g/mol and 162.05 g/mol are expected to form (Fig 17).

Figure 17 - Molecular structure and mass of trisaccharides, A-antigen trisaccharide (left), B-antigen trisaccharide (right), and subsequent products following enzymatic cleavage.
The results shown by the mass spectrometer confirm the functionality of α-Gal. The experimental unit shows the presence of the cleaved fragment from the reaction with the B-antigen trisaccharide, indicated by the peak at 533g/mol in the mass spectrum (Fig 18a). The negative control confirms the specificity of α-Gal, as the A-antigen trisaccharide was not cleaved, indicated by the peak at 736g/mol (Fig 18b). Throughout all readings of the mass spectrum, the molar mass of the peaks have been increased by 23 g/mol due to a sodium adduct (Kruve, Anneli et al, 2013). Unrelated peaks/background noise can be attributed to compounds present in the buffer solution.

Figure 18a α-Gal cleaves B-antigen trisaccharide - Mass spectrum of α-Gal and B-antigen trisaccharide reaction solution (experimental unit, flow through). The peak at 533g/mol shows the presence of the cleaved fragment from the reaction of the α-Gal enzyme and B-antigen trisaccharide.

Figure 18b - Negative Control: Mass spectrum of α-Gal and A-antigen trisaccharide reaction solution (negative control, flow through). The negative control confirms the specificity of α-Gal, as the A-antigen trisaccharide was not cleaved, indicated by the peak at 736g/mol
The results shown by the mass spectrometer also confirms the functionality of NAGA. The experimental unit shows the presence of the cleaved fragment from the reaction with A-antigen trisaccharide, indicated by the peak at 533g/mol in the mass spectrum (Fig 19a). The negative control confirms the specificity of NAGA, as the B-antigen trisaccharide was not cleaved, indicated by the peak at 695g/mol (Fig 19b).

Figure 19a. NAGA cleaves A-antigen trisaccharide - Mass spectrum of NAGA and A-antigen trisaccharide reaction solution (experimental unit, flow through). The peak at 533g/mol shows the presence of the cleaved fragment from the reaction of the NAGA enzyme and A-antigen trisaccharide.

Figure 19b. Negative Control - Mass spectrum of NAGA and B-antigen trisaccharide reaction solution (negative control, flow through). The negative control confirms the specificity of NAGA, as the B-antigen trisaccharide was not cleaved, indicated by the peak at 695g/mol
Mass spectroscopy results from the reaction between NAGA with A-antigen trisaccharide, as well as α-Gal with B-antigen trisaccharide demonstrate their ability to cleave their specific trisaccharides, demonstrating the proof of concept that these enzymes are able to cleave these blood group antigens.
Porcine Blood Agglutination Tests
Summary
To establish a proof of concept for our project, we performed a test with porcine red blood cells (pRBCs), which possess similar morphology and antigenic structures to human red blood cells. The test is primarily based on an enzymatic reaction with whole porcine blood and observation of the extent of agglutination to evaluate enzymatic activity in porcine blood qualitatively. The functionality of these enzymes to cleave blood group antigens in whole human blood can be extrapolated from their performance in porcine blood.
Background
Porcine red blood cells share a number of similar characteristics with human red blood cells (Table 3) (Smood et al., 2019), and possess antigens that closely mimic the A and B antigens of human RBCs (Fig 20) (Cooling, 2015). Because of these similarities, porcine blood is the most promising candidate for xeno transfusions, transfusions taking place across species (Cooper 2019), the applications of which we further explore here. The similar properties between pRBCs and human RBCs also make it an ideal substitute for human RBCs in our experiments, which allows us to avoid the safety questions that arise when working with human blood. However, we did not use type B porcine blood in our agglutination tests, since the human anti-B antibody serum we used was unable to recognize and induce agglutination in type B porcine blood.
Table 3 - Hematological similarities between pig and human blood. The RBCs have similar cell diameters and counts, while pig’s blood has a shorter lifespan. These properties make pRBCs an ideal substitute for human RBCs in our experiments (Smood et al., 2019)


Figure 20 - Blood Group Antigens of a) pigs blood and b) human blood. Porcine RBCs have an A-O antigen system, meaning that they do not possess the B blood type antigen. Instead, porcine RBCs have a xenoantigen “α-gal,” that is present on all pRBCs, regardless of type. The structure of α-gal is nearly identical to the human B antigen, but lacks a fucose group branch (Cooling, 2015)
Slide Agglutination Tests
Since the A-O antigen system exists within porcine red blood cells, the activity of NAGA can be evaluated through enzymatic reactions followed by agglutination assays with type A and O porcine blood (Mujahid 2016). In theory, successful cleavage of the A antigen in porcine RBC should eliminate agglutination when human anti-A serum is added to the treated type A porcine blood.
Porcine blood was sourced from a local farm in Hsinchu, a county in Taiwan, specializing in breeding pigs for scientific research purposes. To type the blood type of the received porcine blood, initial slide agglutination was performed with the addition of human anti-A serum to the porcine blood (Dickert, 2016) (Fig 22). Previous studies have confirmed that porcine blood agglutinates well with human Anti-A antibodies, and thus should show visible clumps if the A antigen is present (Kresie, 2006). Our results demonstrated clear clumps in some samples, and no agglutination in others. We used this difference to blood type our pRBCs either as A type or O type.

Figure 22 - Slide agglutination of porcine blood. Clear visible clumps were observed in the left well, indicating that the sample is blood type A. There are no clumps in the middle or right well, indicating that these samples are blood type O.
To test if our enzyme works on type A pRBCs, we used slide agglutination as a qualitative test to visualize our results (Fig 23). We dialyzed our purified NAGA, previously dissolved in 0.1M sodium phosphate buffer, in 1X PBS to limit harm to pRBCs. Following treatment with the NAGA enzyme, A-type porcine blood would no longer agglutinate upon the addition of anti-A antibodies. Such outcome would suggest successful cleavage of the A antigen. Non-enzyme treated enzymes should continue to agglutinate as expected after the addition of anti-A serum.

Figure 23 - Enzyme activity and agglutination test theory. Following addition of NAGA enzyme to A-type pRBCs, cleavage of antigens and hence blood type conversion can be detected with the addition of Anti-A, which will cause agglutination if the A antigens are still present on the RBC surface. Successful blood type conversion should be reflected by the observation of visible differences in agglutination between enzyme treated and PBS (control) treated pRBCs.
Following enzyme treatment for 2 hours, we added human anti-A serum to the blood sample. We then visualized agglutination using 3 different qualitative methods (Fig 24). First, we spread the blood and antibody mixture on standard blood typing slides, to observe for macroscopic clumps. Our results showed that enzyme-treated blood displayed less clumps compared to PBS-treated blood (control), indicating less agglutination and thus suggesting successful blood type conversion.
We then observed the mixtures under a light microscope at 20X magnification (Nikon H550S, Japan). We observed larger and more RBC clumps in PBS control samples compared to enzyme treated samples (Fig 25). The corroborative results from the macroscopic slide agglutination test and observation of RBC behavior under the light microscope provide convincing evidence of successful enzymatic cleavage by NAGA, demonstrating a proof of concept for our project.

Figure 24 - Post-enzyme treatment agglutination results visualized in blood typing wells, glass coverslips, and under light microscope at 20x. In all three methods of visualization, less agglutination was observed following enzyme treatment compared to treatment with PBS control. These results suggest successful A to O enzymatic conversion of pRBCs.

Figure 25 - RBCs clumps were observed at a much lower frequency when treated with enzymes, compared to samples treated with PBS control, suggesting successful enzymatic conversion.
References
B-Gal_Michaelis-Menten_App_Note.Pdf. https://www.biotek.com/resources/docs/B-Gal_Michaelis-Menten_App_Note.pdf. Accessed 18 Oct. 2021.
“BOOKONTHINLAYERCHROMATOGRAPHY.Pdf.” Google Docs, https://drive.google.com/file/d/1TTsnOXKNUDc1DMQvDFh3Gc7s1Epv1iAB/view?usp=sharing&usp=embed_facebook. Accessed 18 Oct. 2021.
Cooling, Laura. “Blood Groups in Infection and Host Susceptibility.” Clinical Microbiology Reviews, vol. 28, no. 3, July 2015, pp. 801–70. PubMed Central, https://doi.org/10.1128/CMR.00109-14.
Gao, Hong-Wei, et al. “Glucose Buffer Is Suitable for Blood Group Conversion with α-N Acetylgalactosaminidase and α-Galactosidase.” Blood Transfusion = Trasfusione Del Sangue, vol. 12, no. 1, Jan. 2014, pp. 61–66. PubMed, https://doi.org/10.2450/2013.0023-13.
Kruve, Anneli et al. “Sodium adduct formation efficiency in ESI source.” Journal of mass spectrometry : JMS vol. 48,6 (2013): 695-702. doi:10.1002/jms.3218
Kwan, David H., et al. “Toward Efficient Enzymes for the Generation of Universal Blood through Structure-Guided Directed Evolution.” Journal of the American Chemical Society, vol. 137, no. 17, American Chemical Society, May 2015, pp. 5695–705. ACS Publications, https://doi.org/10.1021/ja5116088.
Meloncelli, Peter J., and Todd L. Lowary. “Synthesis of ABO Histo-Blood Group Type I and II Antigens.” Carbohydrate Research, vol. 345, no. 16, Nov. 2010, pp. 2305–22. PubMed, https://doi.org/10.1016/j.carres.2010.08.012.
Mujahid, Adnan, and Franz L. Dickert. “Blood Group Typing: From Classical Strategies to the Application of Synthetic Antibodies Generated by Molecular Imprinting.” Sensors (Basel, Switzerland), vol. 16, no. 1, Dec. 2015, p. 51. PubMed Central, https://doi.org/10.3390/s16010051.
Rahfeld, Peter, and Stephen G. Withers. “Toward Universal Donor Blood: Enzymatic Conversion of A and B to O Type.” Journal of Biological Chemistry, vol. 295, no. 2, Jan. 2020, pp. 325–34. DOI.org (Crossref), https://doi.org/10.1074/jbc.REV119.008164.
Smith, Douglas M., et al. “Blood Groups and Transfusions in Pigs.” Xenotransplantation, vol. 13, no. 3, May 2006, pp. 186–94. PubMed, https://doi.org/10.1111/j.1399-3089.2006.00299.x.
Smood, Benjamin, et al. “GENETICALLY-ENGINEERED PIGS AS SOURCES FOR CLINICAL RED BLOOD CELL TRANSFUSION: WHAT PATHOBIOLOGICAL BARRIERS NEED TO BE OVERCOME?” Blood Reviews, vol. 35, May 2019, pp. 7–17. PubMed Central, https://doi.org/10.1016/j.blre.2019.01.003.
Takasaki, S., and A. Kobata. “Purification and Characterization of an Endo-Beta-Galactosidase Produced by Diplococcus Pneumoniae.” Journal of Biological Chemistry, vol. 251, no. 12, June 1976, pp. 3603–09. DOI.org (Crossref), https://doi.org/10.1016/S0021-9258(17)33387-2.
Typical Reaction Conditions α-N-Acetylgalactosaminidase (P0734) | NEB. https://international.neb.com/protocols/2013/01/10/typical-reaction-conditions-p0734. Accessed 18 Oct. 2021.
XTractorTM Buffer & xTractor Buffer Kit User Manual. (n.d.). 10.
Held, Paul. “Kinetic Analysis of β-Galactosidase Activity Using the PowerWave™ HT and Gen5™ Data Analysis Software .” BioTek, 16 Feb. 2007.
Biolabs, New England. “Typical Reaction Conditions for α-N-Acetylgalactosaminidase (P0734).” New England Biolabs: Reagents for the Life Sciences Industry, https://international.neb.com/protocols/2013/01/10/typical-reaction-conditions-p0734.
Schenkel-Brunner, H. “Blood Group Antigens.” Comprehensive Glycoscience, Elsevier, 5 Sept. 2007, www.sciencedirect.com/science/article/pii/B9780444519672000398?via%3Dihub.
UniProtKB - Q5LIM3 (Q5LIM3_BACFN). UniProt, 2 June 2021, www.uniprot.org/uniprot/Q5LIM3. Accessed 20 Oct. 2021.
UniProtKB - A4Q8F7 (GH109_ELIME). UniProt, 2 June 2021, www.uniprot.org/uniprot/A4Q8F7. Accessed 20 Oct. 2021.
Fukuda, M N, and G Matsumura. “Endo-Beta-Galactosidase of Escherichia Freundii. Purification and Endoglycosidic Action on Keratan Sulfates, Oligosaccharides, and Blood Group Active Glycoprotein.” Journal of Biological Chemistry, vol. 251, no. 20, 1976, pp. 6218–6225., https://doi.org/10.1016/s0021-9258(20)81847-x.
Shaikh, Fathima Aidha, et al. “Mechanistic Analysis of the Blood Group Antigen-Cleaving Endo-β-Galactosidase from Clostridium Perfringens.” Biochemistry, vol. 48, no. 35, 2009, pp. 8396–8404., https://doi.org/10.1021/bi900991h.
Liu, Qiyong P et al. “Identification of a GH110 subfamily of alpha 1,3-galactosidases: novel enzymes for removal of the alpha 3Gal xenotransplantation antigen.” The Journal of biological chemistry vol. 283,13 (2008): 8545-54. doi:10.1074/jbc.M709020200
Liu, Qiyong P et al. “Bacterial glycosidases for the production of universal red blood cells.” Nature biotechnology vol. 25,4 (2007): 454-64. doi:10.1038/nbt1298