
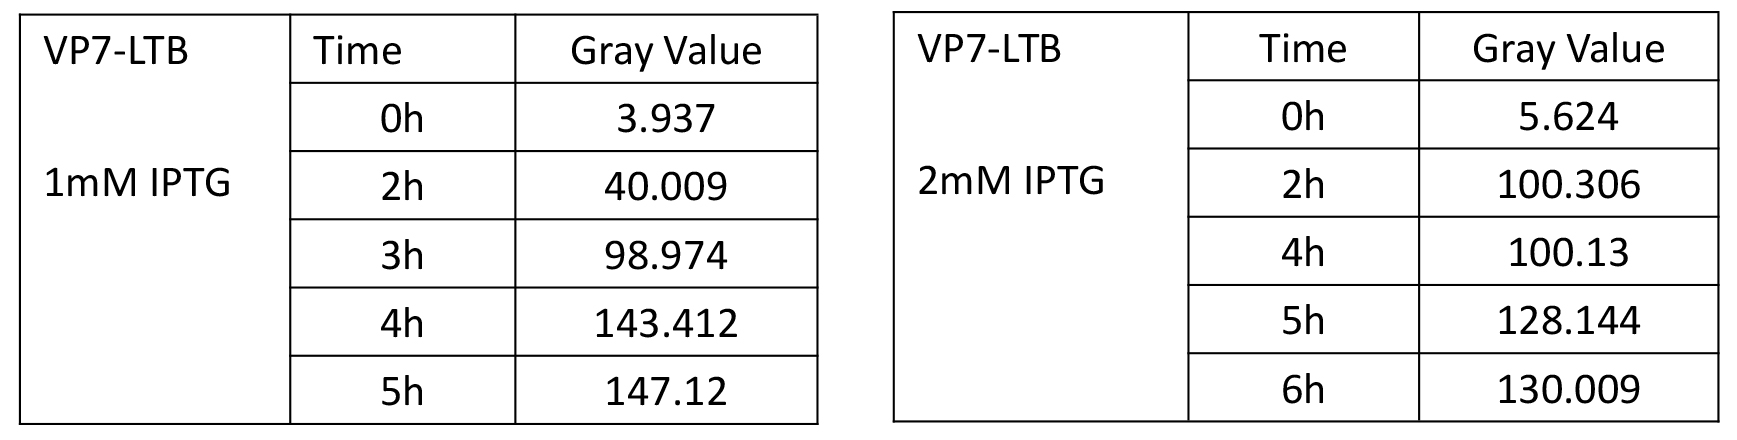
In order to determine the optimum induction duration of our engineered BL21 strains for the antigen protein expression which is designed to induce neutralizing antibody immune response inside the human body, we conducted several Western Blot and collected the gray value which was calculated by ImageJ to quantify the protein expression against hours.
PET28a-VP7
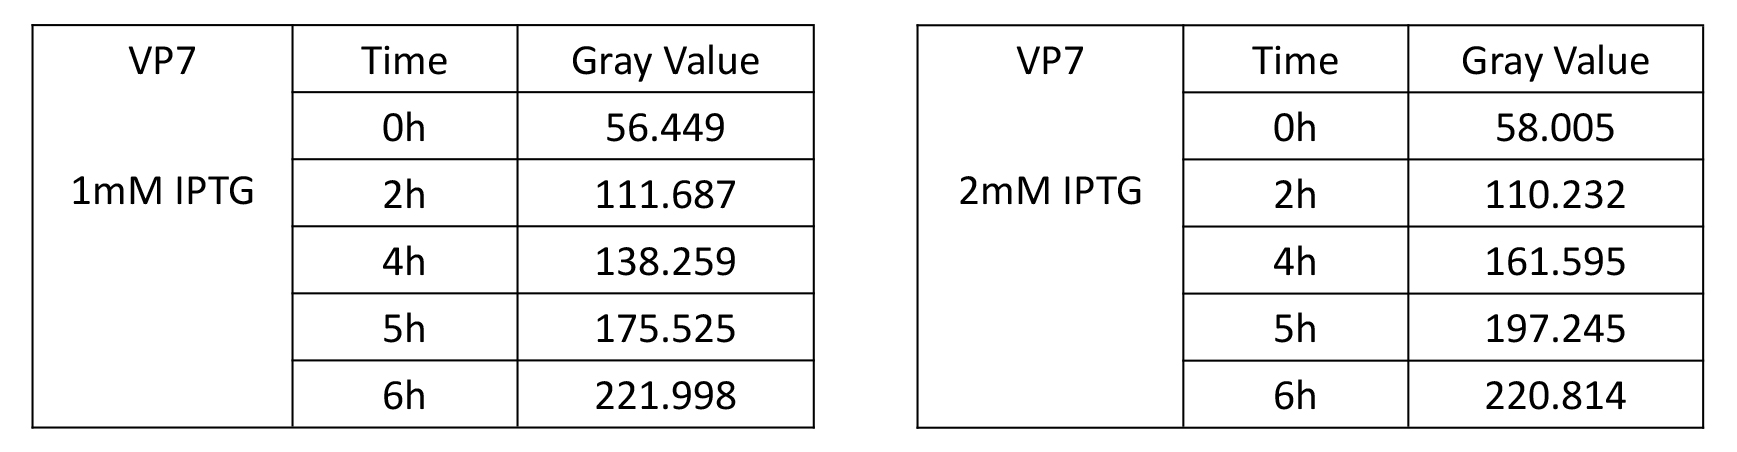
Above two tables can be modeled linearly or exponentially by looking at their scatter plot. From the view of fitting degrees, linear model will be better than exponential model. The principle of linear model is the least square method, which we have learned in school. So here we go straight to the linear model (to assume the growth rate constant): y=kx+b and the model results analyzed by Matlab are showing below (figure 1, 2) .
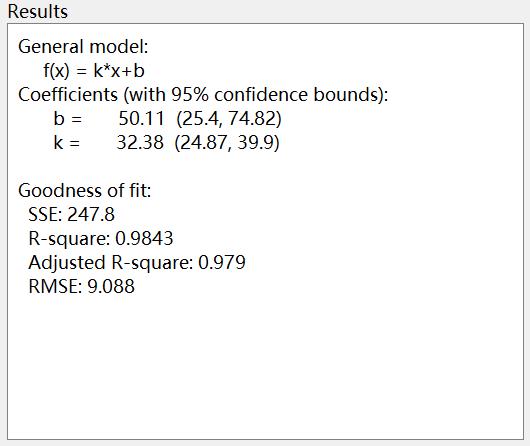 Figure 1. Model result of VP7 when IPTG concentration was given 1mM
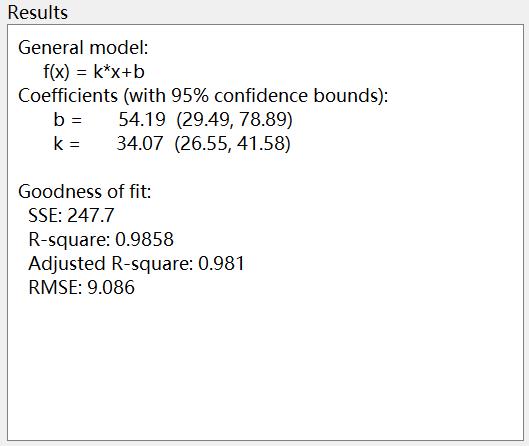 Figure 2. Model result of VP7 when IPTG concentration was given 2mM
Therefore, we can have the curves of these two models about PET28a-VP7 protein expression against hours (figure 3, 4).
As seen below, these two curves present very similar trends with very close k value (curvature). So it indicates that the concentration of IPTG might not affect that much on the protein expression of PET28a-VP7, just a slight promotion. As the increase rate during the induction for the strain PET28a-VP7 keeps almost constant, the protein expression level could be proportional to the induction duration.
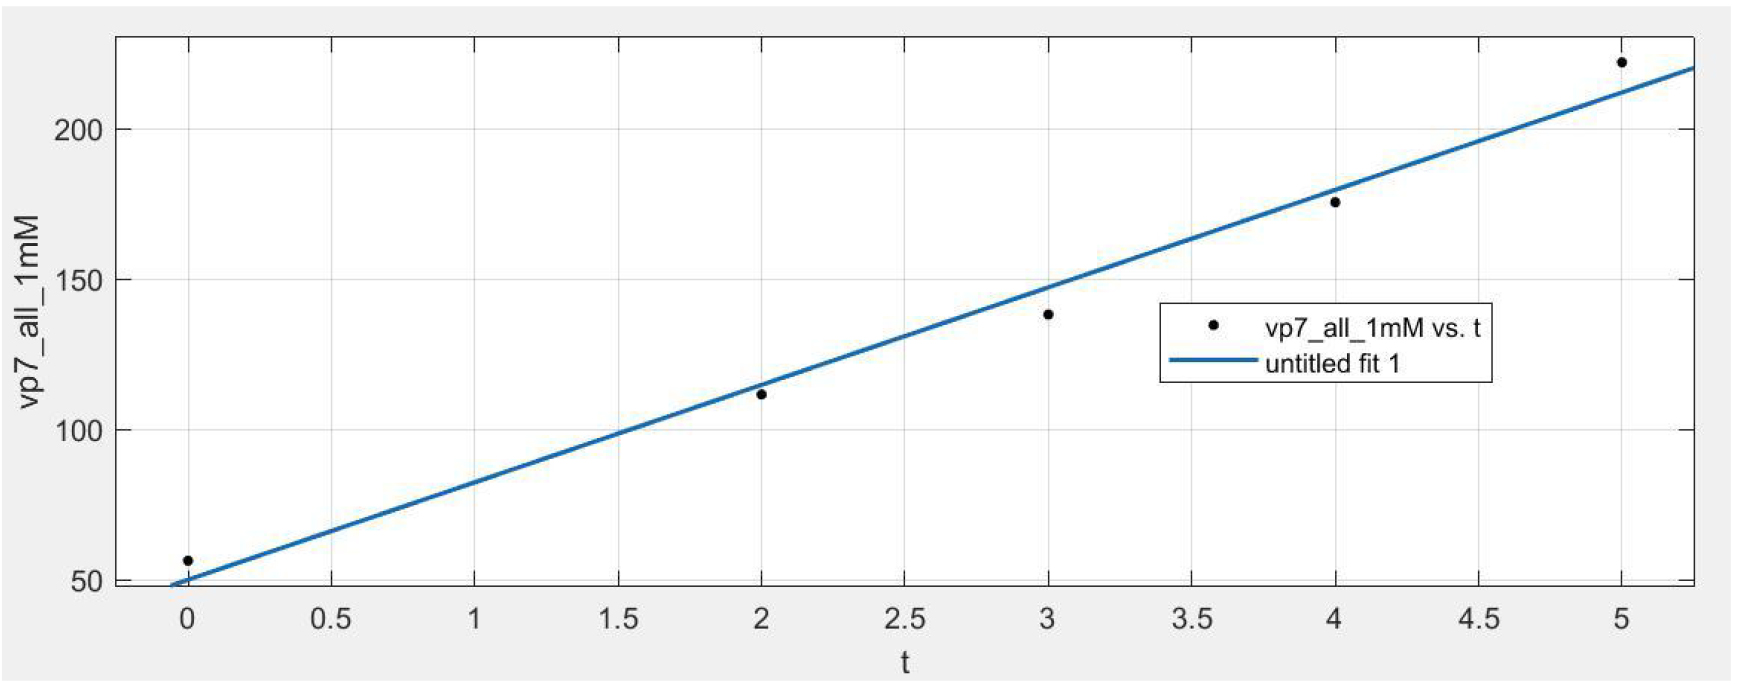 Figure 3. Curve of VP7 model when IPTG concentration was given 1mM
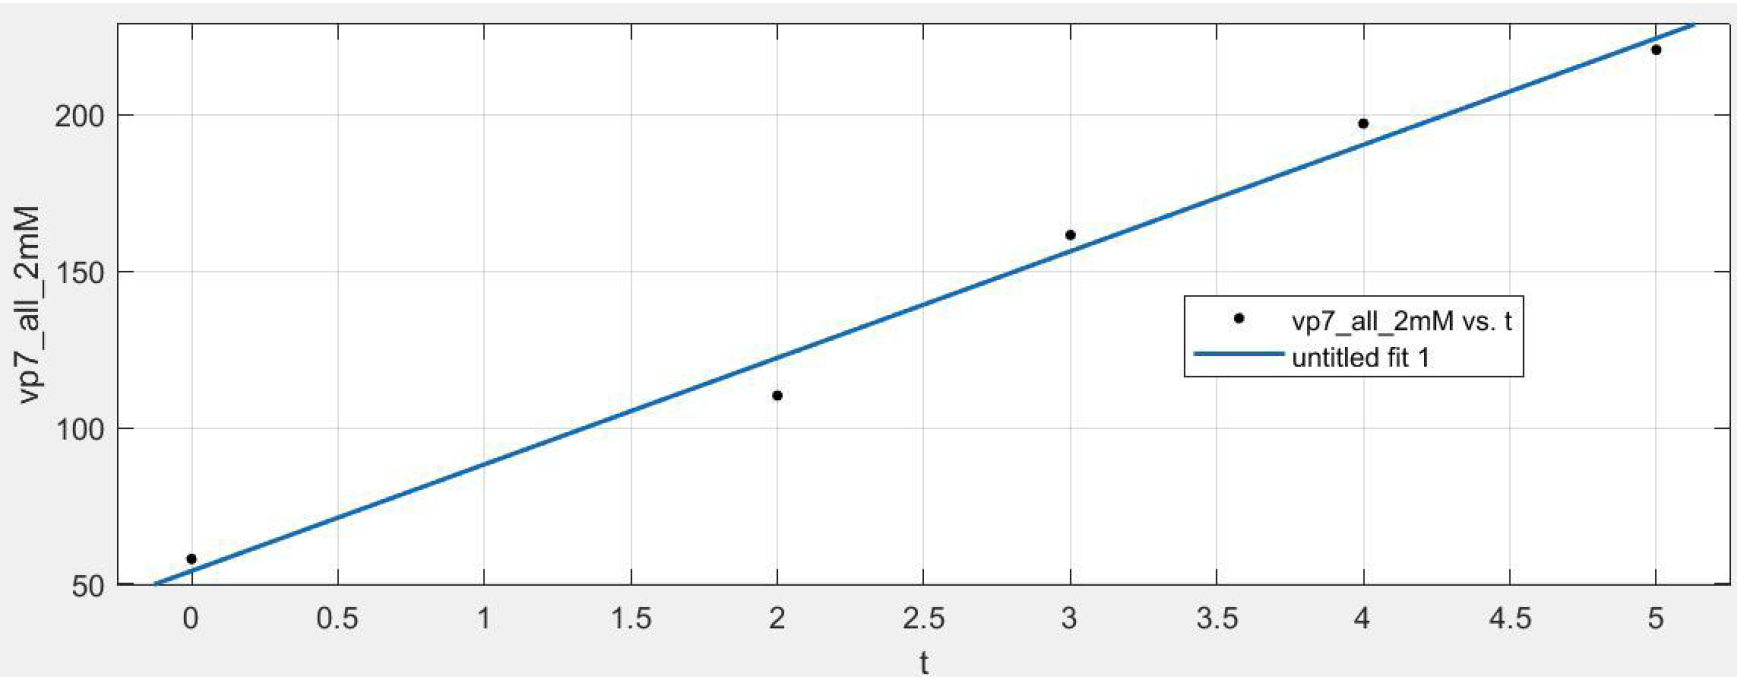 Figure 4. Curve of VP7 model when IPTG concentration was given 2mM
PET28a-VP7-LTB
After analysis, the data conforms to the S-type growth trend, so the Logistic Equation commonly used in biological growth, population growth, infectious diseases and other models is selected.
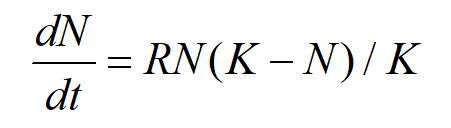
And its analytic expression is:
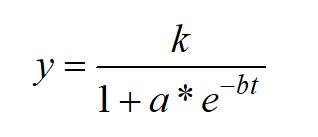
Here we imported the data by Matlab, the model results all indicate good fitting degrees as showing below in figure 5, 6.
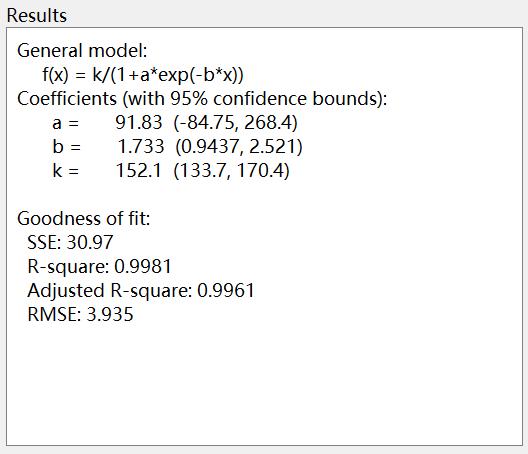 Figure 5. Model result of VP7-LTB when IPTG concentration was given 1mM
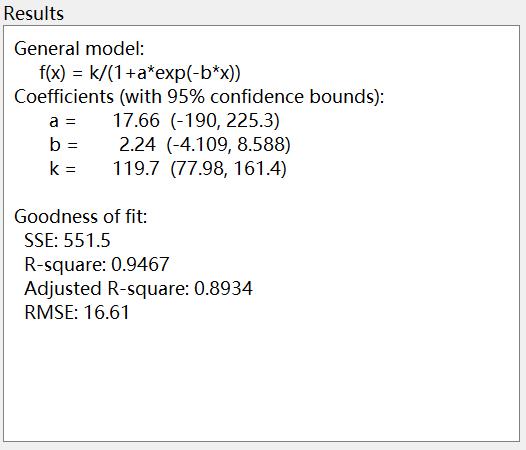 Figure 6. Model result of VP7-LTB when IPTG concentration was given 2mM
In addition, here we obtained the curves of above models showing below (figure 7, 8).
When IPTG concentration was given 1mM, VP7-LTB expresses the most fast during the third hour of the induction and it starts to flatten out after 4 hours. So we could imply that our engineered strain PET28a-VP7-LTB would start its maximum response efficiency after 2 hours and its optimum induction duration will be 4 hours around.
When IPTG concentration was given 2 mM, the strain expresses the fast in the second hour of the induction but it is also earlier to get the steady phase which the peak of gray value is 120 around. In this case, the optimum induction duration of VP7-LTB shall be 2 hours.
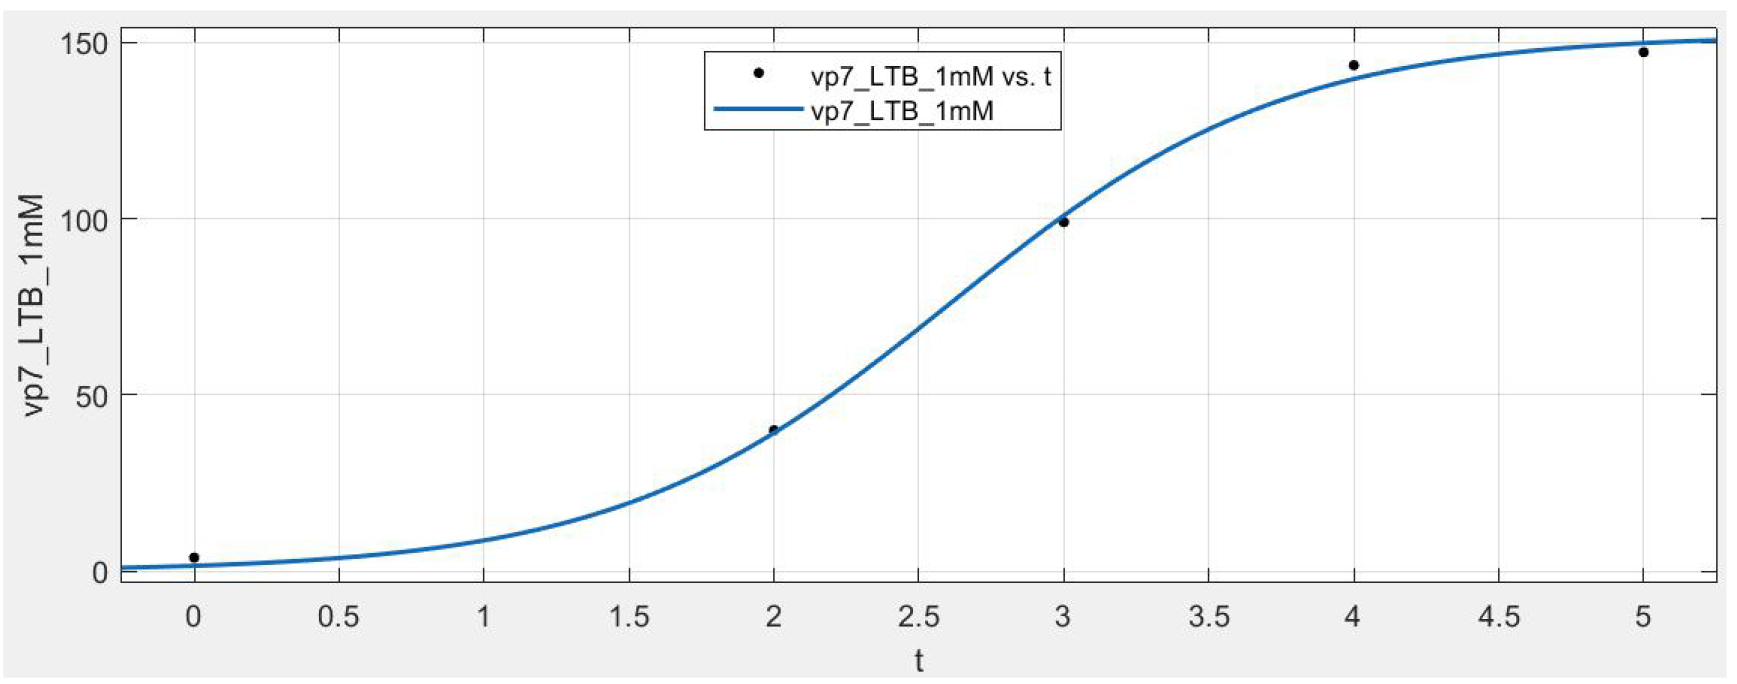 Figure 7. Curve of VP7-LTB model when IPTG concentration was given 1mM
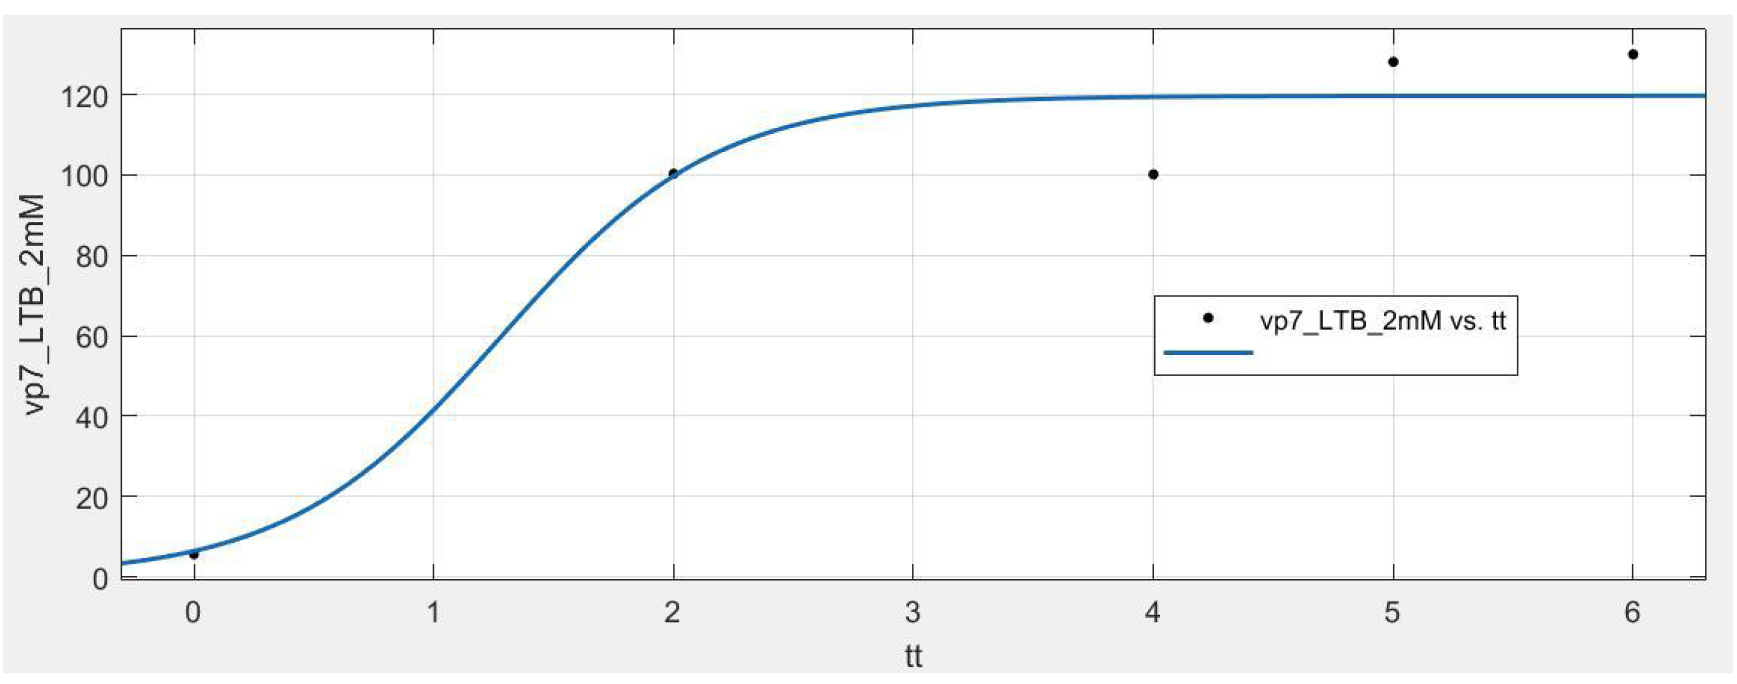 Figure 8. Curve of VP7-LTB model when IPTG concentration was given 2mM