Team:Pittsburgh/Model

Modeling
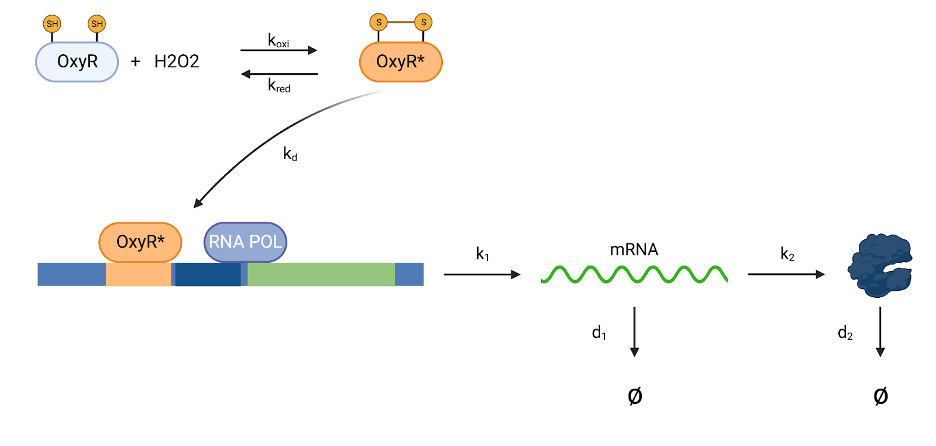
Our goal is to model levels of protein levels expressed by the OxyR transcription activator. OxyR is inactive in the reduced state. In the presence of H2O2, it becomes oxidized. The activated OxyR then binds to its corresponding binding site near the promoter. The binding of OxyR then stimulates RNA polymerase recruitment, which initiates transcription. The proposed mechanism is shown in the figure above.
First, we created an equation to model the amount of oxidized OxyR after H2O2 is added:
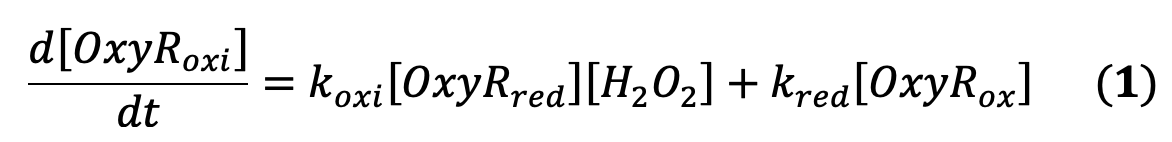
The values for koxi (0.0000062 min-1 molecules-1) and kred (2.5 min-1) were based on a previous study which looked at how H2O2 oxidized OxyR (Åslund et al. 1999).
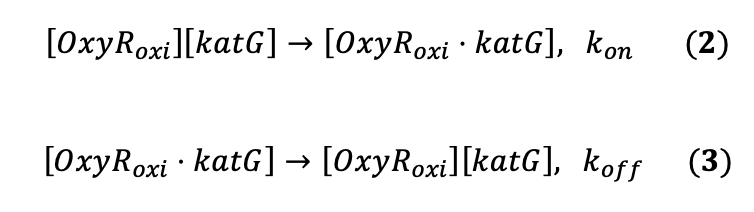
Next, we used the iGEM 2020 “Modeling: ODEs and Hill Functions” presentation by Alejandro Vignoni to guide how we arrived at an equation which modeled protein expression levels in the cells. We first needed to determine how to model the amount of OxyRoxi binding to its associated binding site. While we made our calculations based on the binding between OxyRoxi to the katG binding site, our model is applicable to the other binding sites. This is due to the fact that the binding sequences are conserved between the genes regulated by OxyR. The equations modeling binding between OxyRoxi and katG are:
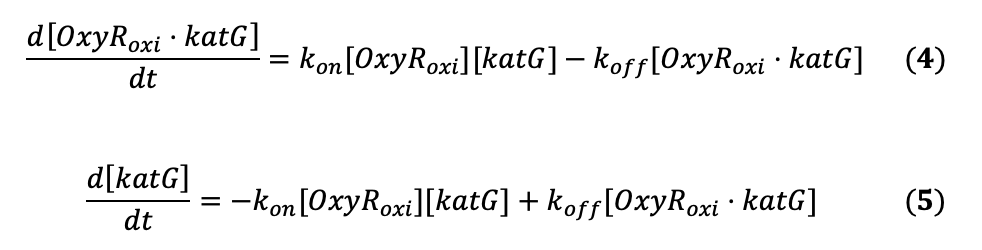
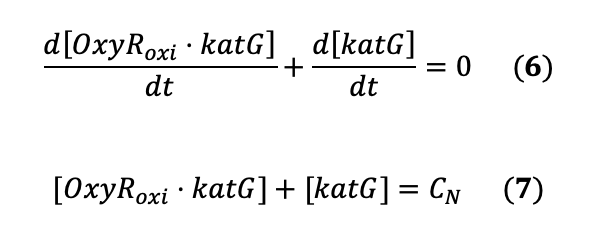
From these two equations, we can arrive at these differential equation:
Adding these equations, we can arrive at:
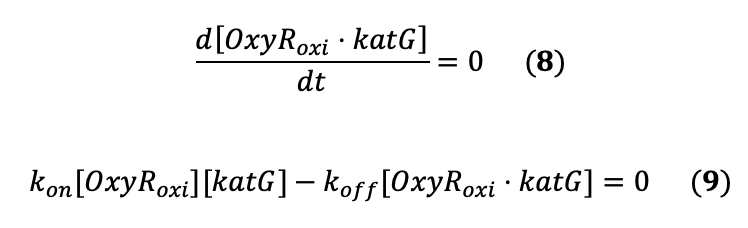
The binding between the OxyRoxi and katG binding site should be in the frame of seconds while the rate of transcription and translation takes place in the scale of minutes and hours. Based on the Quasi Steady State Approximation (QSSA) of chemical kinetics, we can estimate that:
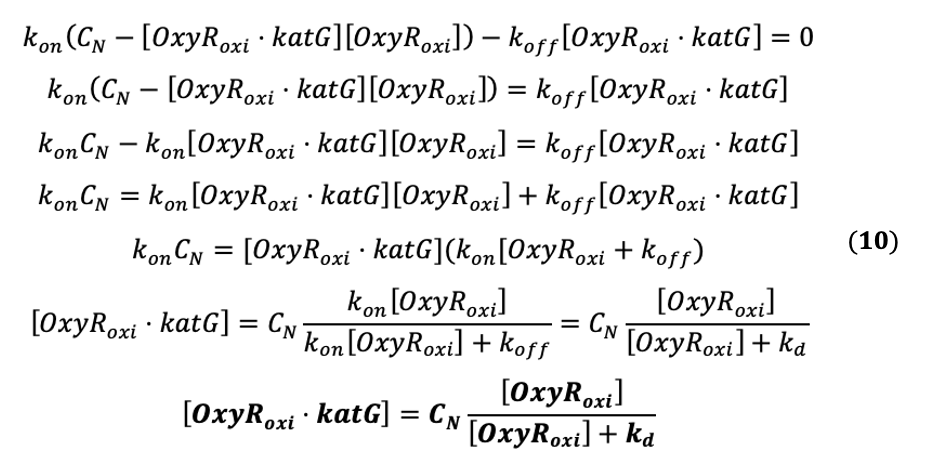
Substituting in the plasmid copy equation, we get:
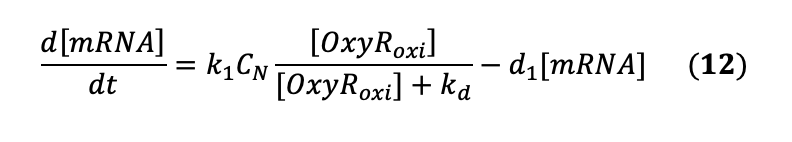
The binding of the OxyRoxi should induce transcription through the recruitment of RNA polymerase. The equation for the amount of mRNA transcribed is:
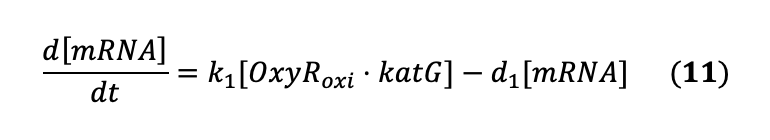
Substituting the [OxyRoxi•katG] with the previous equation, we get:
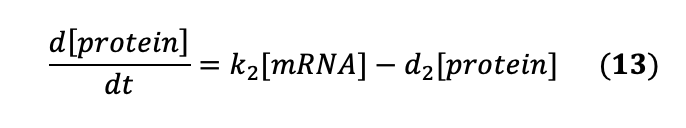
The equation for the translation is:
Since transcription occurs in the range of minutes and much faster than translation, we can use the QSSA to estimate:
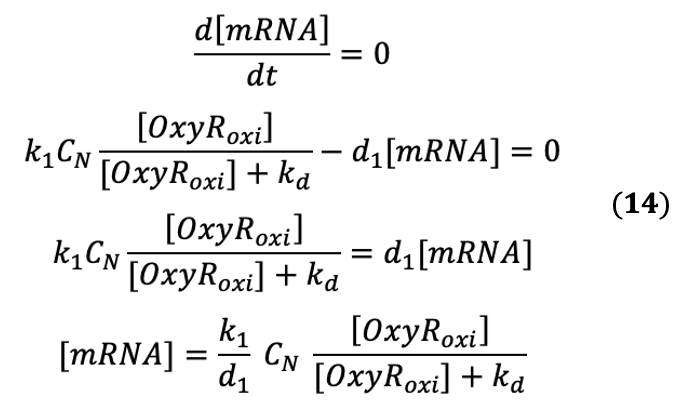
Now, we need to substitute the mRNA concentration to the translation equation to get the final equation we need:
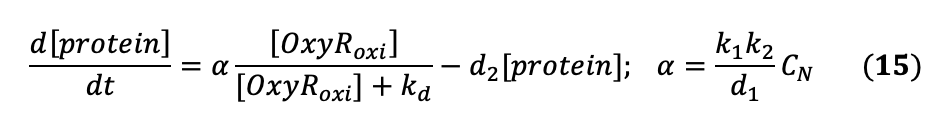
The rate of transcription k1 is estimated to be around 0.5 min-1 (Hausser et al. 2019). The rate of mRNA degradation d1 is estimated to be around ⅓ min-1 (Dong & Kurland, 1995). The rate of transcription k k2 is estimated to be around 8.09 min-1 (Guet CC et al. 2008). The rate of protein degradation d2 is estimated to be around 0.02 min-1 (Vignoni, 2020). The Kd is estimated to be around 0.403 molecules (Kim et al. 2003).
We plotted Equations 1 and 15 using python. Here is our code:
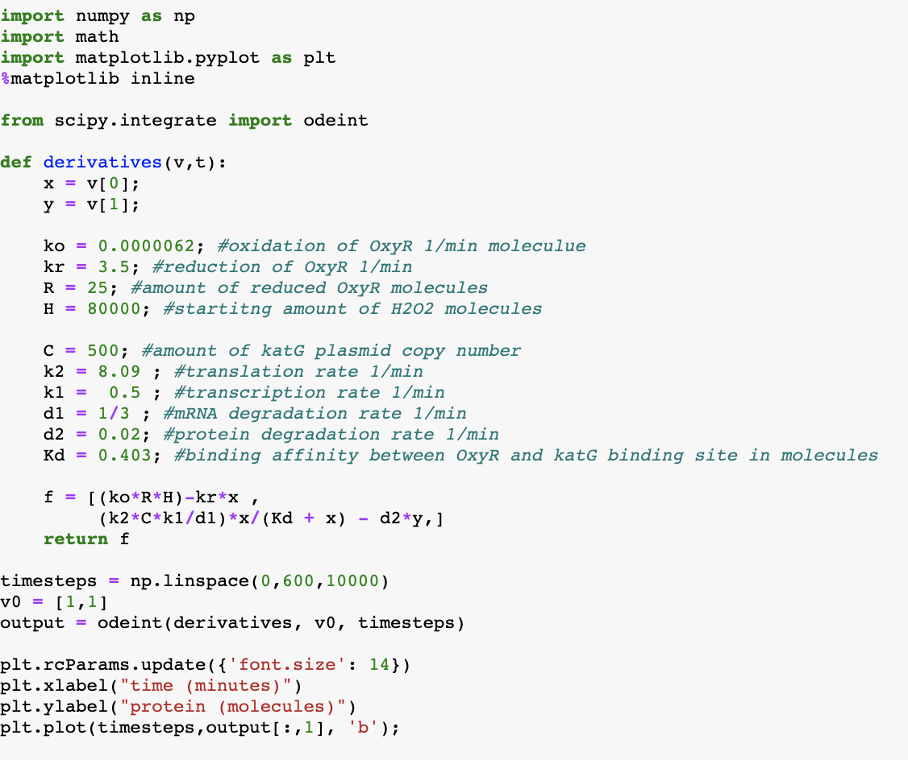
We then ran the two differential equations to plot the final graph. R in the equation represents the amount of OxyRred in the cells in molecules and H in the equation represents the amount of H2O2 in molecules. Since our OxyR binding sites and lacZ-alpha are on pUC19 vectors the plasmid copy number should be around 500 to 700.
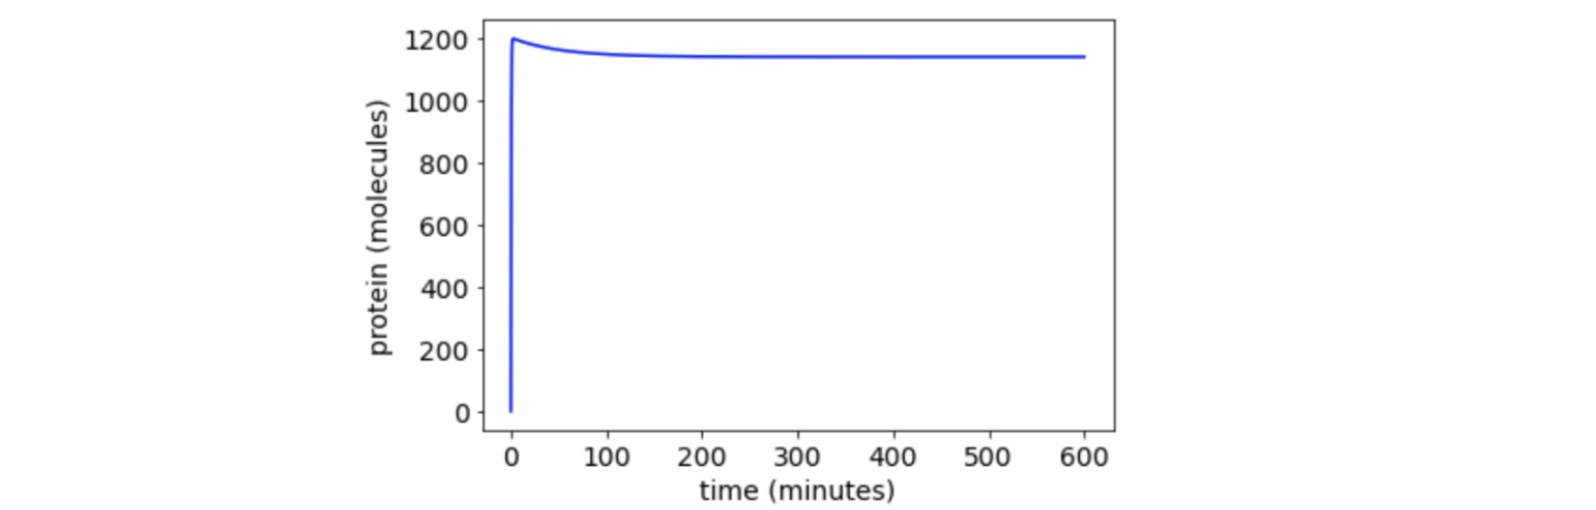
If we have R = 25 molecules and add 200 uM of H2O2, the protein expression levels is:
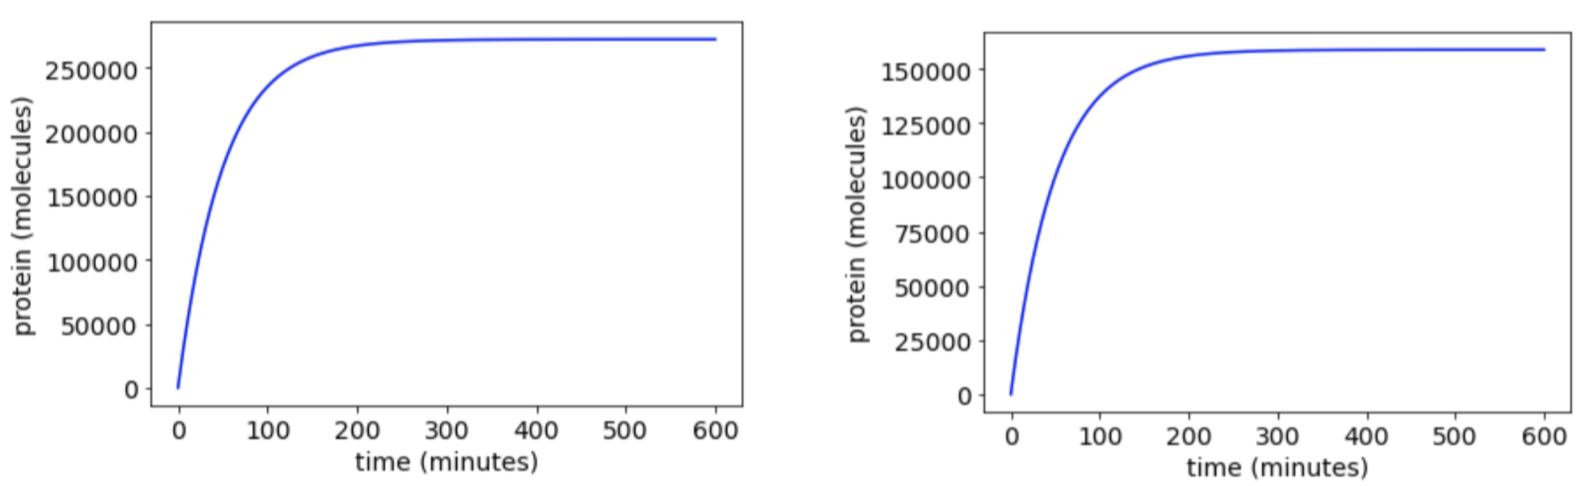
Both graphs show at R = 25 molecules. This indicates the starting amount of reduced/unactivated OxyR proteins are present in each cell. Figure 3a shows it at 200 μM of H2O2, and Figure 3b) shows it at 25 μM of 100 μM H2O2. The change between the two is around a 1.7 fold increase when 200 μM is added instead of 100 μM H2O2.
Next, we tried lowering the copy number from 500 to 10 copies per cell to test if this would make a difference:
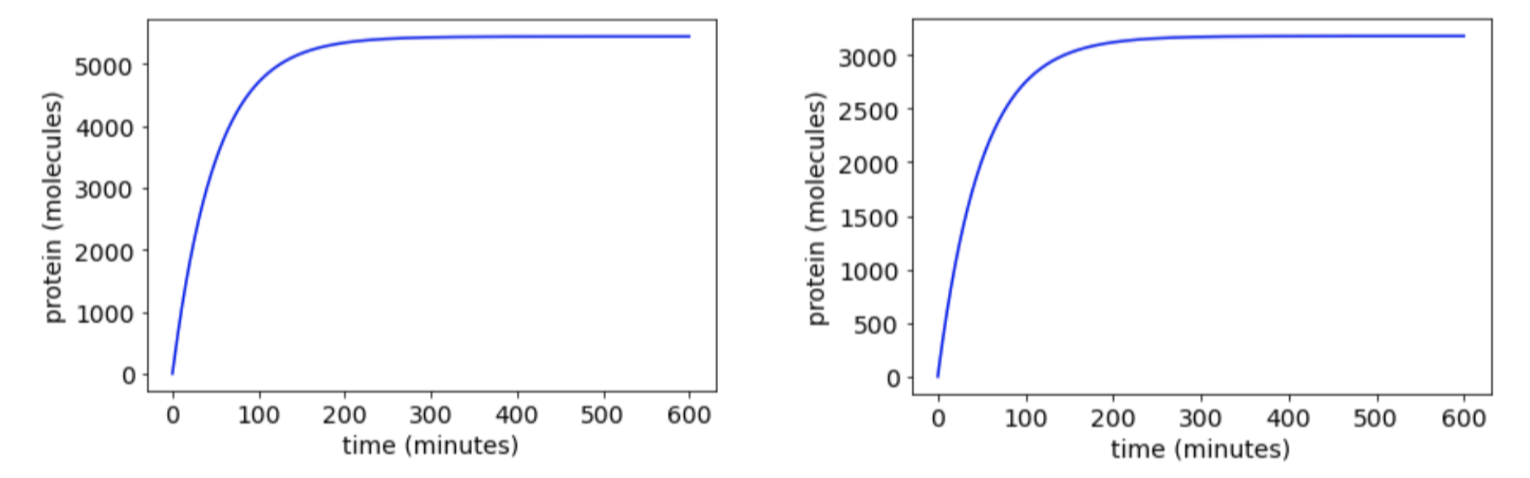
Both graphs show at R = 25 molecules. Figure 4a shows it at 200 μM of H2O2, and Figure 4b shows it at 25 μM of H2O2. The fold change is still about the same.
Then we tried changing the Kd value from 0.403 to 1 molecule. This means that the affinity between the OxyRoxi and its binding site increases:
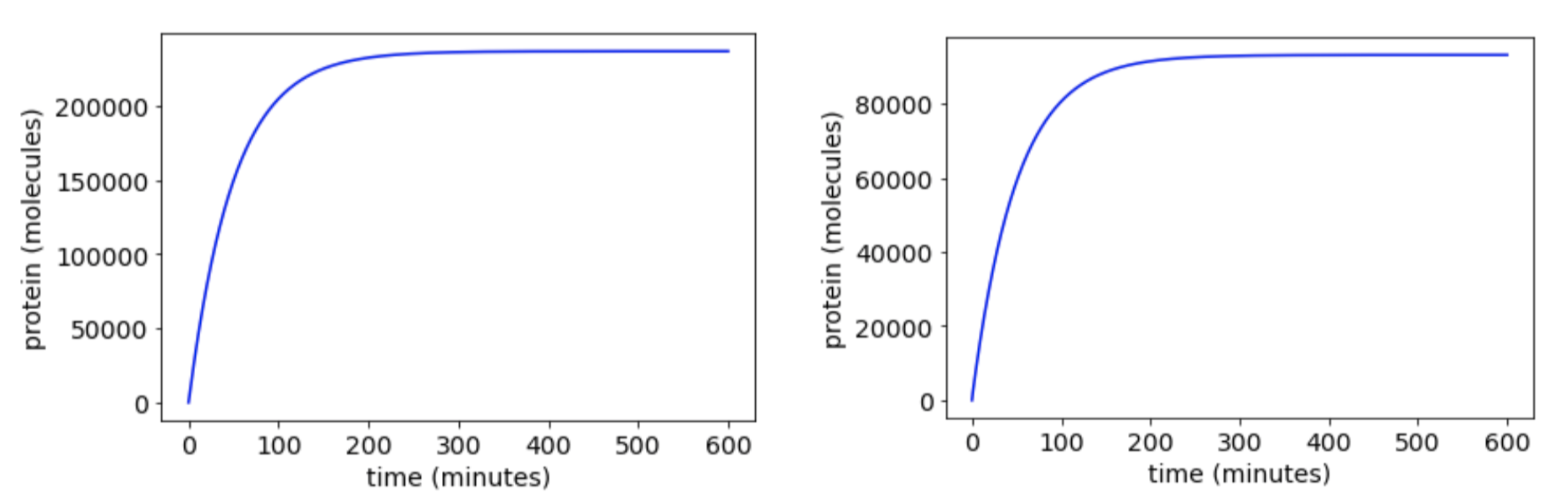
Both graphs above show at R = 25 molecules. Figure 5a shows it at 200 μM of H2O2, and Figure 5b shows it at 25 μM of H2O2. The fold change now is about a 2.5 increase from 200 μM of H2O2 compared to 25 μM of H2O2. We can conclude that when the binding affinity increases, the capacity for our system to detect changes increases.
The protein production levels, based on our modeling, would start deviating from the usual hyperbolic graph when the levels of H2O2 goes below 200 nM. The figure below shows the protein levels at around 200 nM H2O2 with R = 25 molecules:
Overall, our equations model the amount of protein expression levels given the starting amount of unactivated OxyR and H2O2 around the cell.