Team:OUC-R/Model/ODE


ODE
Introduction
After making clear the energy relation of the cross sequence, it is very important to simulate the whole experiment process and predict the behavior of the system.
This reaction can be roughly divided into two steps: in the first step, ZBP1 binds to the APP sequence in the circular DNA, opening the cross sequence where the promoter resides; In the second step, RNA polymerase binds to circular DNA and transcribed in an excess nucleotide environment to produce our target product ribozyme. Therefore, we developed a model to understand the behavior of the entire system.
Modeling
To explore when ribozyme reaches its maximum value, we build ODE model to describe the biochemical process shown in the figure above. Under the condition of binding ZBP1 to App sequence, RNA polymerase binds to circular DNA and generates ribozyme from free nucleotides.
-
- The total amount of cyclic DNA, RNA polymerase and nucleotide does not change with time during the reaction.
-
- Over time, a decrease in the number of free nucleotides leads to a decrease in the transcription rate.
-
- The pre-transcriptional mRNA level was 0.
The process is symbolized as follows:
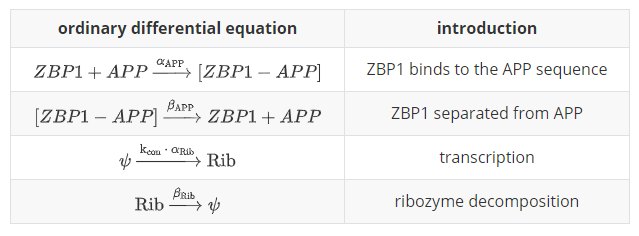
Table 1. Chemical reactions on ODE.
We have:
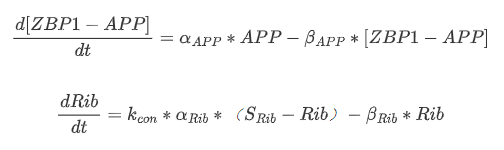
Equation 1. Final ODE system of the model.
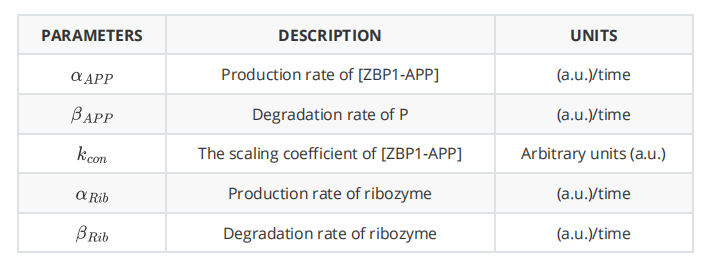
Table 2. Parameters of the model
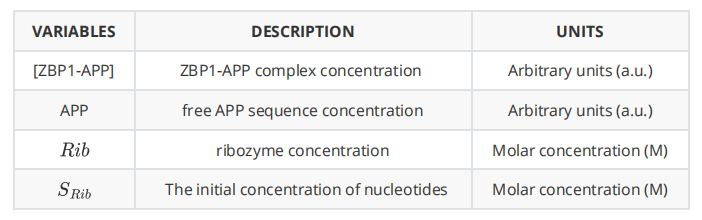
Table 3. Final ODE system of the model.
Because of the long interval between the first reaction and the second, we can assume that when the second reaction begins, the first reaction has reached equilibrium. When we get to equilibrium in the first step, we can get :

Now, we have:
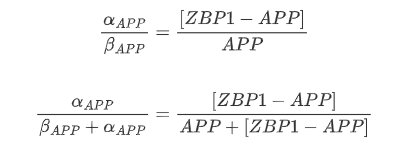
At this time, we define
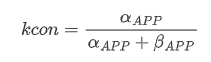
it represents the binding ratio of ZBP1-APP. When the reaction reaches equilibrium, the value of k_{con} does not change over time.
Finally, we substitute k_{con} into the second reaction and use Matlab to solve the ODE mentioned above:
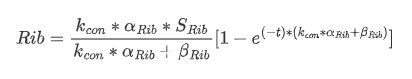
Equation 2. Transfer function of the model.
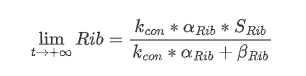
From this equation, we further derive the amount of Rib when the reaction reaches equilibrium:
And the time needed to reach equilibrium is : (assuming that the reaction is close to equilibrium when 99% of the reaction is completed)
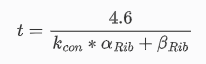
Equation 4. The time when reach equilibrium.
Results and Discussion
We solved the ODE mentioned above using Matlab and simulated different situations by setting different parameters:
-
- without App sequence: k_{con}'< k_{con}
-
- without cross sequence: a_{Rib}'< a_{Rib}
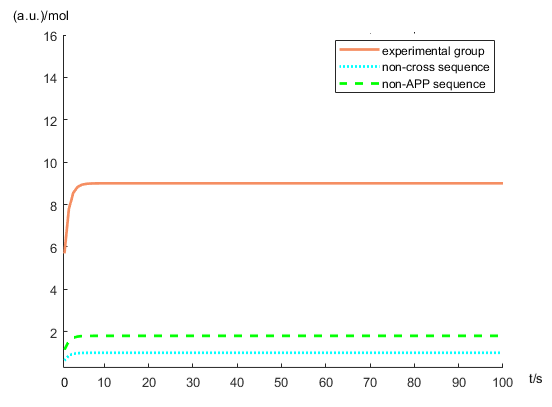
Figure 4. The concentration of ribozyme by model prediction
Being able to understand the behavior of the ODE system and describe it mathematically is important to ensure that the system is fully dynamic. Knowing the dynamic reaction mechanism of the whole system, we can predict the corresponding results of the experiment, which is a key aspect to ensure the success of our experiment. At the same time, our mathematical modeling can be used to describe the results of the control group and predict the possible situations, which provides ideas for us to improve the experiment in the next step.