Team:IISER Kolkata/Contribution
![[preloader image]](https://static.igem.org/mediawiki/2021/d/d6/T--IISER_Kolkata--image-preloader.gif) Loading . . .
Loading . . .


New Information about existing part BBa_K2323004
Summary - We learnt that Team iGEM17_Munich has performed the assay for target-dependent activity of purified Cas13a protein under different concentrations of target RNA molecules. Team ZJUT_China_B 2020 has characterized the base preference of collateral cleavage activity of LwaCas13a protein. Due to limitations in laboratory access, we have contributed more information about this part through literature surveys.
NEW INFORMATION: Zhang Lab devised the SHERLOCK technique which uses isothermal preamplification with specific activation and non-specific cleavage activity of Cas13a to detect small RNA or DNA molecules. This is a significant scientific advancement in the field of rapid nucleic acid detection used in diagnostics and biotechnological applications. LwaCas13a collateral cleavage activity results in the production of cleaved RNA products with hydroxylated 5’ ends and 2’-3’ cyclic phosphate ends. A Type III CRISPR Cas system protein called Csm6 gets efficiently activated by 2’-3’ cyclic phosphate terminated hexadenylated ends [1].
Zhang et al. have further devised SHERLOCKv2 [2] which is an advancement of the SHERLOCK technique [3]. In this method, orthogonal CRISPR enzymes Cas13a and Csm6 are multiplexed together to detect RNA molecules. SHERLOCKv2 acts by the method of initial specific activation of cas13a by target RNA molecules which then goes on to generate cleavage residues/overhangs of 2’-3’ cyclic phosphate by collateral cleavage of RNA in the sample. These overhangs further activate Csm6 which also carries out collateral cleavage. According to literature, it was found that this can be used to detect as low as 2 attomolar input RNA with a preamplification step (Eg: Recombinase Polymerase Amplification). They also devised a lateral flow detection technique where the signal of LwaCas13a is enhanced by EiCsm6(Csm6 from Enterococcus italicus) solely, without the preamplification step by RPA.


Among the crucial experiments we conducted for our wet lab component, is a microtiter plate assay for gauging the optimum conditions for the growth of Pseudomonas aeruginosa biofilms. However, in a number of microtiter plates, we were constantly observing the growth of bacteria and hence, the development of biofilm, in wells where uninoculated control media was present. We were unable to comprehend the reason behind the repeated contamination of control wells with bacterial inoculation which hampered our readings for the control replicates in a microtiter plate. We searched up available literature and came across a study involving the analysis of well-to-well contamination. The study studied the observations of well-to-well contamination and quantified it in the context of microbiome research.
Based on this, we have come up with a set of ideas to deal with cross contamination among wells in a microtiter plate while conducting any experiment. Our inferences are specifically in the context of our experiment of the biofilm formation assay.
Intraplate contamination among adjacent wells in a microtiter plate is often a neglected area of focus when it comes to understanding and eradicating causes of contamination. A major part of the focus is on contaminants which are external in the nature of their origin, such as reagents and consumables, rather than well-to-well contamination which happens within the arena of the plate itself. This is why well-to-well contamination has a lot of importance in experimental results and their significance must be rigorously understood, analysed and their effects be taken care of.
The purpose of inclusion of positive and negative controls in an experiment is to minimise variable changes except the variable that is being tested. However, along with it, controls also play a role in assessing contamination in a study and subsequent removal of contaminants in silico. The problem arises when the controls themselves are hampered and the interpretation of results is rendered a hazy outlook. The contamination of controls by physical cross-contamination by samples is an important reason behind the contamination of controls, more so the negative controls.
We hypothesised that the possibility of cross contamination among wells is a function of the distance between the wells in context. Hence, for a given source well, the possibility of physical cross contamination is greatest in the wells directly surrounding the source well and decreases as we move outwards. We came across a similar line of thought in literature wherein the number of observed events of cross -contamination have been studied as a function of the pythagorean distance from the source well. This is for the case of DNA extraction for microbiome studies. Inevitably, the rate of cross-contamination is higher in the immediate range of the source well.
Well-to-well contamination is important to consider when evaluating experimental results. The risks posed by well-to-well contamination is very significant considering control blanks physically adjacent to samples. The contamination events across different wells are largely independent and one needs to be careful in designing the microtiter plate assay and other aspects of the experiment to minimise well-to-well contamination.

We are compiling a set of points that we deliberated upon while designing our biofilm formation assay and can be used by future iGEM teams while designing microtiter plate assay regarding well-to-well contamination :
- It is not easy to identify the precise moment or step in which cross contamination among wells takes place. Instead of deliberating on this, more focus needs to be on designing the way in which wells have to be filled while doing the assay or study .
- The possibility of well-to-well contamination is the highest in wells adjacent to the source well. The consideration of sample location in plates should be explicitly considered in the experimental design.
-
While designing a plate for an experiment and sample locations in the wells, one should take care of two major effects of well-to-well contamination. One, if treatment samples all are kept together and control samples together, any well-to-well contamination , say, among the treatment wells, will increase the metrics of similarity among the treatment wells only, thereby increasing the chances of detecting false positive signals. On the other hand, randomising the samples without maintaining sufficient separation between controls and treatment wells would possibly contaminate the controls themselves with the treatment wells acting as the source well. Based on this line of thought, the design of the assay must be done considering both the following aspects :
- Sufficient separation between treatment and control wells, preferably more separation between control and treatment wells to ensure control wells are safe from physical cross contamination.
- Randomisation of treatment and control wells to ensure minimum interaction among control wells and on the other side, treatment wells.
- Well-to-well contamination has a major impact on low-biomass samples if they are kept adjacent to samples of high biomass where the high biomass samples can act as source wells.
- It must be noted that the occurrence of cross contamination is a matter of chance and there is no assurance that it would not occur at all. However, adopting certain careful practices and clever experimental designs, one can minimise the hampering of experimental results due to cross contamination between wells.
- While filling wells in a microtiter plate, avoid handling the control wells near laboratory containers with bacterial culture. Handle them such that they are away from the bacterial culture without any possibility of incidental inoculation of the control wells. This is more of a general precaution, but its consequences can be mistaken for well-to-well contamination.
- As a point of precaution, it is always advisable to fill control wells first and then follow it up with test wells. This order of operation ensures that the possibility of incidental contamination of the control wells while handling test wells is less as control wells are already filled and test wells can be handled separately on the lines of the previous point. It is to be noted that this does not exactly lead to cross contamination but its effects can be misinterpreted as cross contamination if one is not careful enough while filling the wells, as per the previous point.
Contamination is indeed a hindrance to scientific research. While well-to-well cross contamination can be generalized as being a widespread problem, the specific nature and mechanism of this problem remains vague. The onus is on us to adopt practices to minimise its occurrence.
MODELLING OF EXISTING PART BBa_K1365006
Summary: This year our team focuses on one segment of this part which is nisA. NisA gene is responsible for the production of the 57-amino acid long pre-peptide. This 57-amino acid comprises a leader peptide, cleavage of which produces a 34 amino acid long Nisin A protein. Nisin Resistance Protein (NSR) is a protein that is expressed on the cell surface of certain pathogenic strains like Streptococcus agalactiae, Streptococcus uberis. NSR is responsible for inactivating nisin by proteolytically cleaving the peptide bond between MeLan28 and Ser29 resulting in a truncated nisin (nisin1–28). NisinPV is a synthetically designed mutant of NisinA with the Mutation of Serine to proline at position 29 (S29P) combined with isoleucine to valine at position 30 (I30V). Nisin PV ( BBa_K379904 ) shows enhanced antimicrobial activity against Streptococcus uberis by inhibiting biofilm formation and decreasing its viability. In the section below we have shown a comparative analysis of the stability of NisinA and NisinPV under the interaction of Nisin Resistance protein.
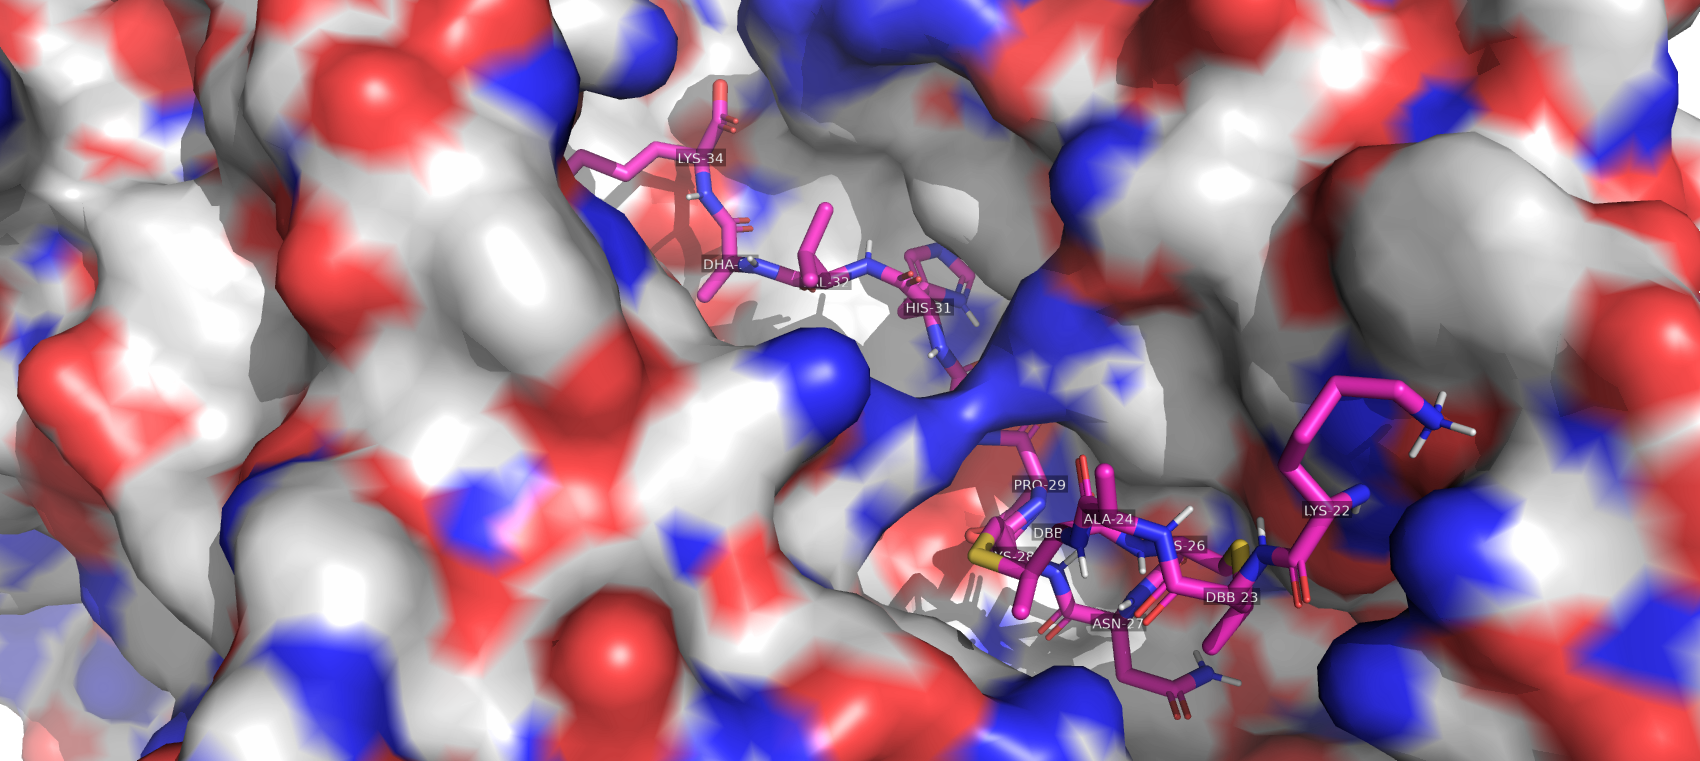
Interaction with Nisin Resistance Protein: The data in this section is adapted from the simulations by Field, Des et al[7]. They carried out MD simulations to predict the difference in molecular dynamics of the NSR protein in its interaction with the nisin C-terminus (residues 22–34) for nisin-A and nisin PV models.
Molecular docking: We tried to replicate the setup used by Des et al. For the NSR (Nisin Resistance protein) molecule, the PDB file 4Y68 was used and for the Nisin the 1WCO PDB file was used. NisinA structure was mutated using PyMol and a PRO-VAL mutation was added to the 29th and 30th residue respectively. To determine a starting configuration for the NSR-nisin complex a docking program Autodock for ligand and protein binding was used where the Nisin (A/PV) was set as ligand and NSR was set as the receptor. We first performed the docking of NisinA with the tunnel region of NSR and selected the lowest energy stage as the starting configuration. The docs location was observed to be consistent with the ligand-binding site of Nisin as discussed in the literature. The ligand-binding site for NisinA was noted and NisinPV was docked using the same coordinates.
The free energies of the configurations obtained from docking are as follows:


The 1st position is the best docking position for both molecules. Subsequent docking positions were also found by this study. This shows both Nisin A and Nisin PV docks similarly to NSR protein, which indicates that binding is not the mechanism by which NSR cleaves Nisin A.
RMSD Analysis

Initially, both models quickly deviate from their reference structure by approximately 3 Å (this happens over the course of the first 0.3 ns during the heating, equilibration, and the start of the production phase of the simulation). From then on in the simulation, the nisin A model continues to deviate until it reaches approximately 5 angstroms. In contrast, the nisin PV model exhibits different behavior. Although it too initially deviates further to almost 5 angstroms early in the simulation it then returns to just under 4 angstroms deviation from its reference structure and remains virtually constant for the rest of the simulation.
This evidence of greater structural change in the nisin A model that is less apparent in the nisin PV model supports the findings of the binding energy analyses for both bond and total energies. Indeed, it is clear that the nisin PV model is more durably bound to the NSR protein and is certainly more robust than the nisin A model.

Hydrogen bond occupancy
These simulations revealed the hydrogen bond occupancy (defined as whether a hydrogen bond is present or absent at every frame over the duration of simulation) for all nisin residues greater than 20%. It is evident that the nisin PV model exhibits higher occupancy values than the nisin-A model for residues corresponding to the region 27-29. In particular, there is a hydrogen bond with 47.65% occupancy between the sidechain oxygen of proline in the nisin-PV model and the hydrogen from the nitrogen sidechain on residue 265 (asparagine) in NSR that may play a role in the inhibition of proteolytic cleavage for nisin PV.
Free energy per residue

Analysis of the total binding energies for each residue in both nisin A and nisin PV models reveals that at the critical residue 29, the total energy for proline is seven times greater than serine (4.6292 kcal/mol for PRO and 0.8775 kcal/mol for SER).
Key takeaways
Considering the binding of Nisin(A/PV) to NSR, there is compelling evidence that NSR has a much more difficult time cleaving the bond at the 29th in the case of NisinPV.
References
- Niewoehner, O., Garcia-Doval, C., Rostøl, J. et al. Type III CRISPR–Cas systems produce cyclic oligoadenylate second messengers. Nature 548, 543–548 (2017). https://doi.org/10.1038/nature23467
- Jonathan S. Gootenberg, Omar O. Abudayyeh, A Max J. Kellner, A Julia Joung, A James J. Collins, A Feng Zhang et al. T Multiplexed and portable nucleic acid detection platform with Cas13, Cas12a, and Csm6. 2018 Science P439-444 V 360 N 6387 doi:10.1126/science.aaq0179
- Kellner, M.J., Koob, J.G., Gootenberg, J.S. et al. SHERLOCK: nucleic acid detection with CRISPR nucleases. Nat Protoc 14, 2986–3012 (2019). https://doi.org/10.1038/s41596-019-0210-2
- https://2017.igem.org/Team:Munich
- https://www.uniprot.org/uniprot/U2PSH1
- Minich, Jeremiah & Sanders, Jon & Amir, Amnon & Humphrey, Greg & Gilbert, Jack & Knight, Rob. (2019). Quantifying and Understanding Well-to-Well Contamination in Microbiome Research. mSystems. 4. 10.1128/mSystems.00186-19.
- D. Field et al., “Bioengineering nisin to overcome the nisin resistance protein,” Mol. Microbiol., vol. 111, no. 3, pp. 717–731, 2019, doi: 10.1111/mmi.14183.