Analysis & Method
The MATLAB script is composed of three parts: (1) automatic band selection, (2) intensity normalization, and (3) signal integration, which are all based on the MATLAB built-in functions.
Step 1. Automatic band selection
Due to the well number on a gel, we need two gels (A and B) to analyze the eGFP harvested at different points. The gel image was first converted to grayscale, and its intensity was inverted to indicate the protein concentration. The boundary of a band was captured using edge and then refined using imdilate combining with strel. The boundaries generated by our script are shown in red in Figure 1.
Step 2. Intensity normalization
Our script also normalizes the image intensity to quantify the protein concentration. Briefly, we chose a range of backgrounds and a band from the markers as the low and high markers (green borders in Figure 1.), respectively. Each image is normalized to have equal low and high markers and the same dynamic range between these two markers, shown in Figure 1.
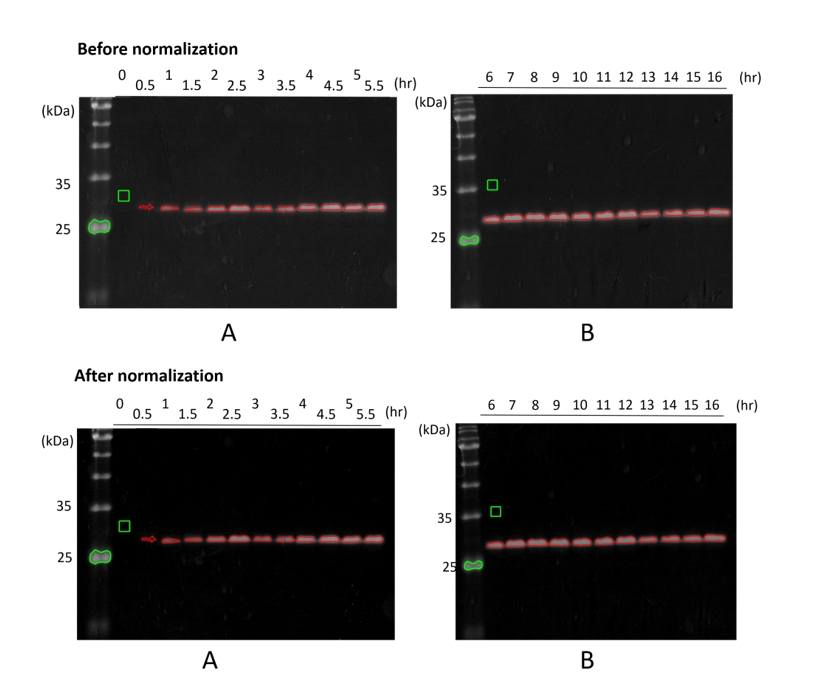
▲ Figure 1: The gel images before and after normalization. The green square on the backgrounds and the green boundaries on the marker serve as the low and high markers, respectively. The red borders define the analyzed band that indicates the protein amounts. Gel A and B have a similar contrast after our normalization procedure.
Step 3. Signal integration
Finally, we integrated the intensities within a selected band (red boundaries) from the normalized images. The time-dependent intensity (i.e., cleaved protein amount), shown in black dots, increases with the reaction time (Figure 2 and Figure 3).
The determination of the order of reaction rate
In order to determine the order of reaction rate, we fitted the integrated intensity from SDS-PAGE using the first- and second-order rate law. The fitting was performed using the curve fitting tool provided by MATLAB 2021a. Judging by the R2 values from the first- and second-order fittings, we believed that the thrombin cleavage tends to behave like a first-order reaction with a rate constant of 0.4393 hr-1.(Figure 2 and Figure 3).
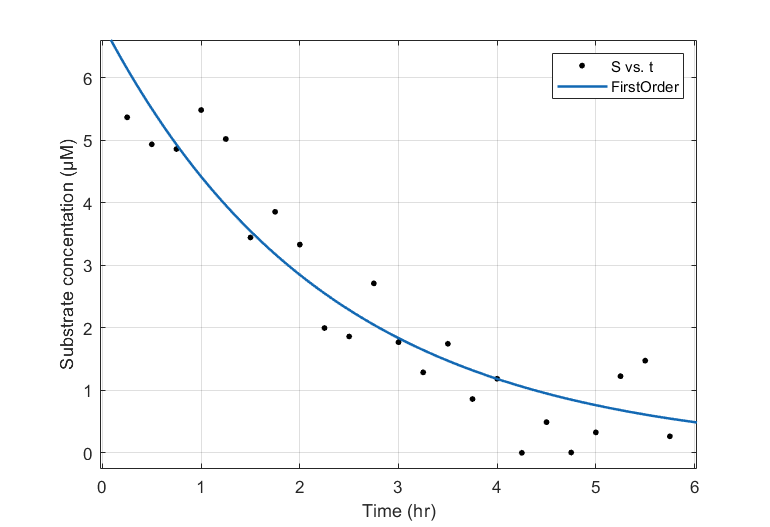
▲ Figure 2: The concentration of cleaved eGFP (black dots) and the fitting based on the first-order rate law ([S] = [S0]e(-kt)), in which the rate constant (k) is 0.4393 hr-1 and R2 is 0.8842.
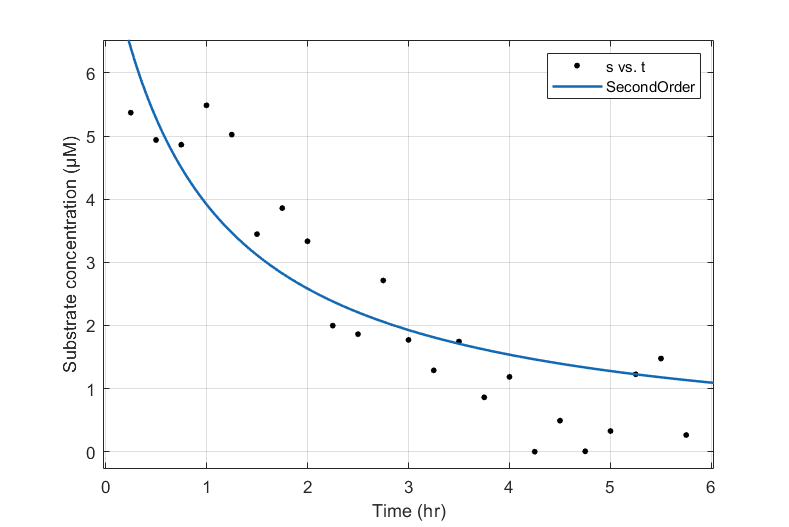
▲ Figure 3: The concentration of cleaved eGFP (black dots) and the fitting based on the second-order rate law (1/[S] = 1/[S0] + kt), in which the rate constant (k) is 0.1319 μM-1hr-1 and R2 is 0.7897.