Team:United Shanghai HS/Model
United_Shanghai_HS


Modeling scheme
Model description
This model is a mathematical modeling model. The content and object of the research is a model for the degradation of plastics by engineering bacteria infiltrating the soil. After expansion, it is a model for degradation of the soil under the presence of earthworms. The characteristics of bacterial colonies cannot be ignored: single-cell biopharmaceuticals are rich in nutrients and multiply very fast; bacteria will get more mutations in the process of mass reproduction, and these mutations are more likely to have the characteristics of decomposing plastics. The cultivation cycle is shorter; the bacteria come from the environment, and the bacteria that decompose plastics only act as decomposers in the ecosystem, decomposing organic matter into inorganic matter, and they are less harmful to the animals in the ecosystem. Therefore, find a suitable one Mathematical model modeling.
Modeling software:
matlabMathematical model:
In the soil, the process of colony transfer and degradation is mainly composed of four components, namely convection, diffusion and penetration, and degradation. The test soil is brown soil (organic matter is about 16.57g/kg, clay is about 26.11%), its bulk density is about 1.47g/cm3, p H>7.5, and water content is about 23%. The test temperature is 20°C, and the pH of the test soil is about 8.16. Describing the infiltration and degradation process of bacterial colonies in the soil is mainly done by finding the mechanism in a large number of statistical models. The general structure of the modeling is:
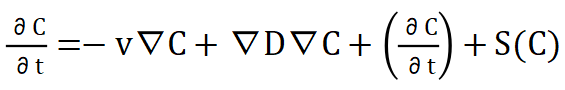
1.Convection process:
In equation (1), the first one on the right represents the convection process in the infiltration process. In relatively sandy soil, the first batch of colonies moves into the soil by convection. In this process, the colonies move through gravity. , Groundwater and air flow through the gaps for convection transfer, and the driving force is described by the gradient of convection. The relationship between the calculated velocity vector v is:
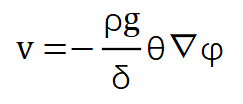
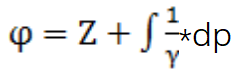
Among them is the osmotic pressure in the convection process:
2.Diffusion and penetration process:
As the convective motion will spread out, this process is diffusion. It is described by the second term on the right side of equation (1). The infiltration process of the colony is assumed to be the sum of two factors, which are the expansion tensors of convection on both sides. , Can be expressed as:
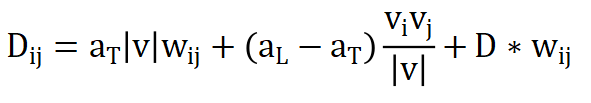
In the process of colony flow in the soil, the movement diffusion is much greater than the molecular diffusion. The D term is whether there are earthworms.
3.Degradation process
The degradation process is the most complicated in the whole process. Degradation is the change and fusion of different phases. The fusion of the phases is carried out according to the balance of the system. The degradation process is the process of gradual changes in the concentration of the degraded material in the soil.
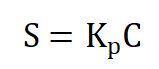
S is the aggregate amount of degraded substances, and C is the concentration component in the soil. K is the distribution process of degradation. If the soil is highly polluted, the definition of soil isotherm needs to be considered.
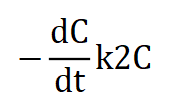
For the hypothesis proposed in this article, the rate of pollutant degradation can be expressed in differential form, as follows:
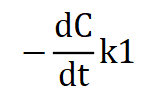
The differential form of the first-order dynamic model of the model is:
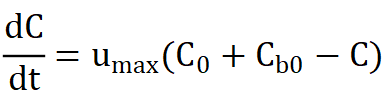
The above dynamic model is used to describe the degradation process, bringing in the previous expansion modulus energy type, and the final diffusion model is:
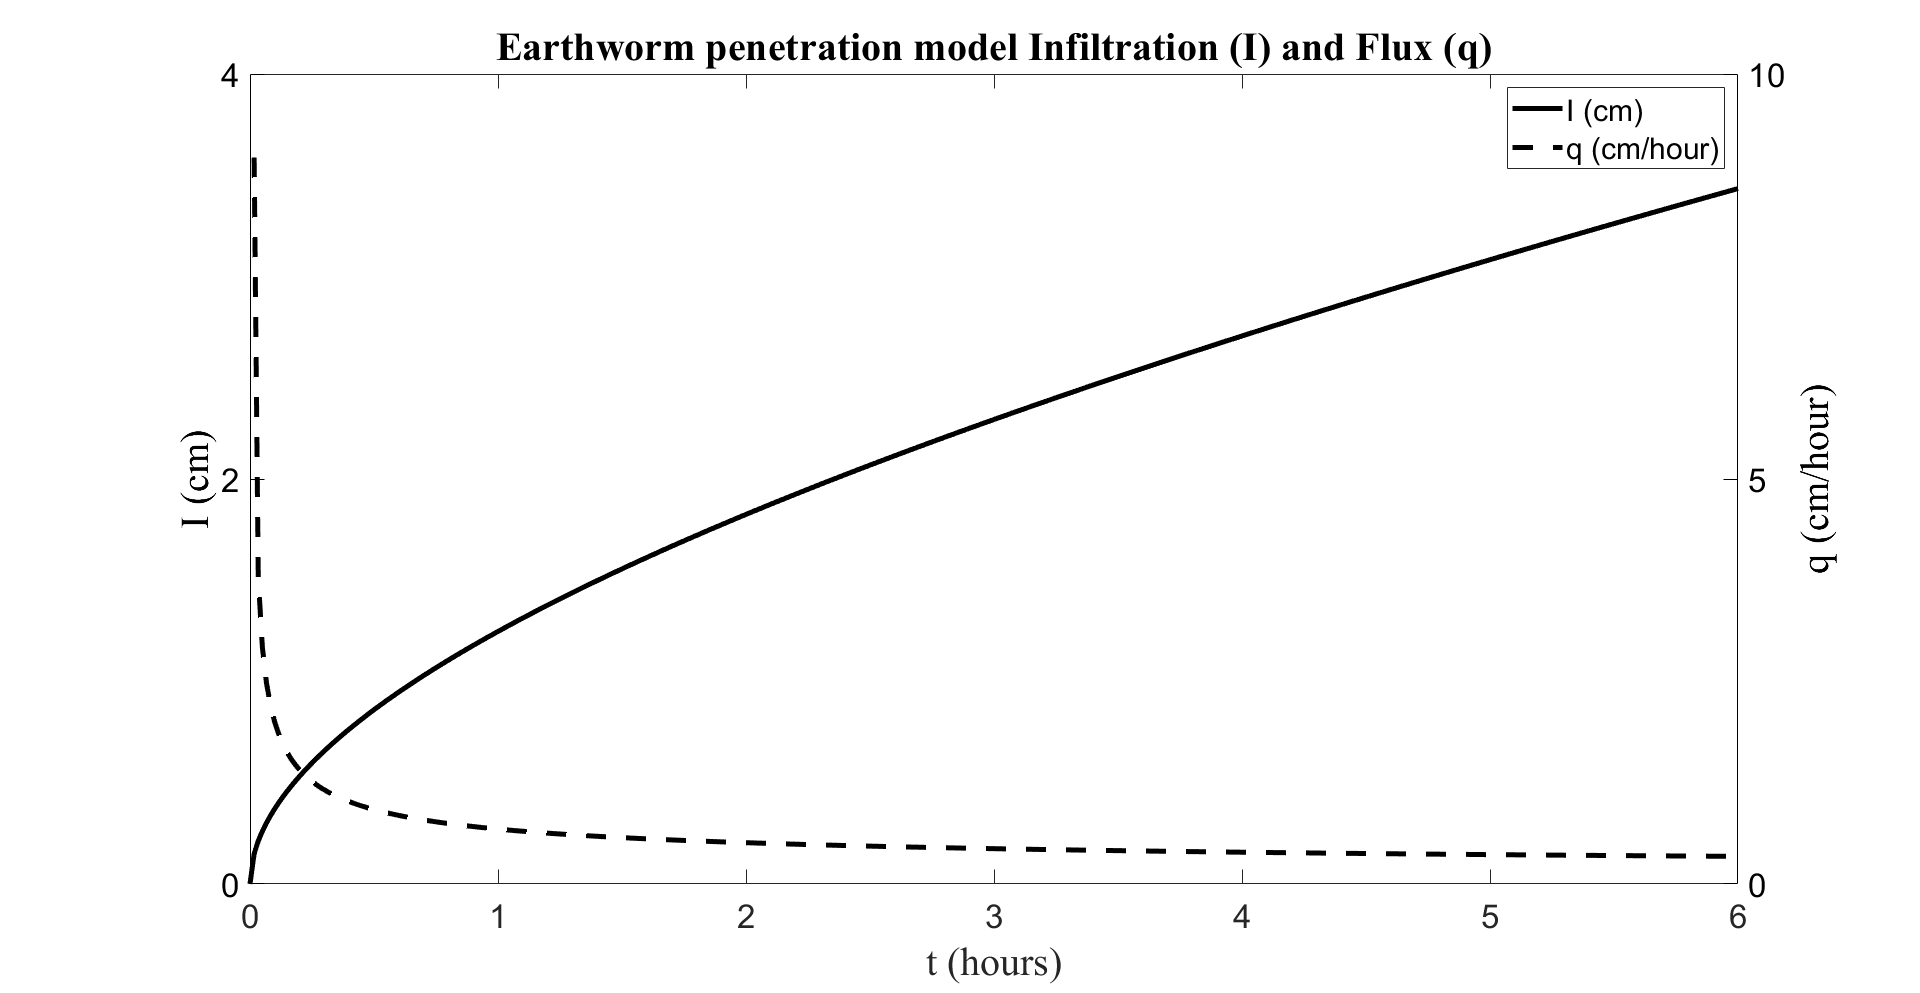
The following specific examples are used to reproduce the above mathematical model and perform calculations.
Individual soil modeling results and analysis:
Table 1 Analysis results obtained by modeling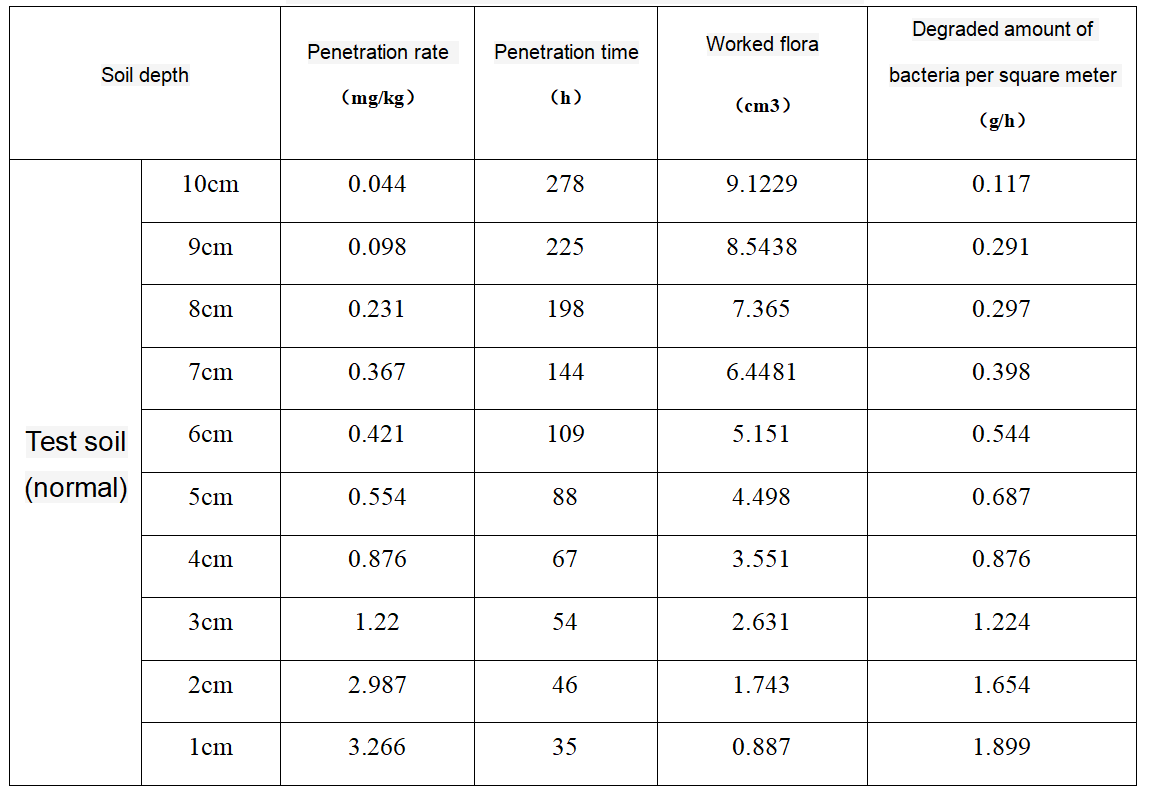
Adding the modeling results and analysis of earthworms
In the figure above, the horizontal axis is the time of penetration, the dashed line on the vertical axis is the amount of earthworms that have already penetrated, and the solid line on the vertical axis is the penetration rate.
Table 2 Analysis results obtained by modeling (including earthworms)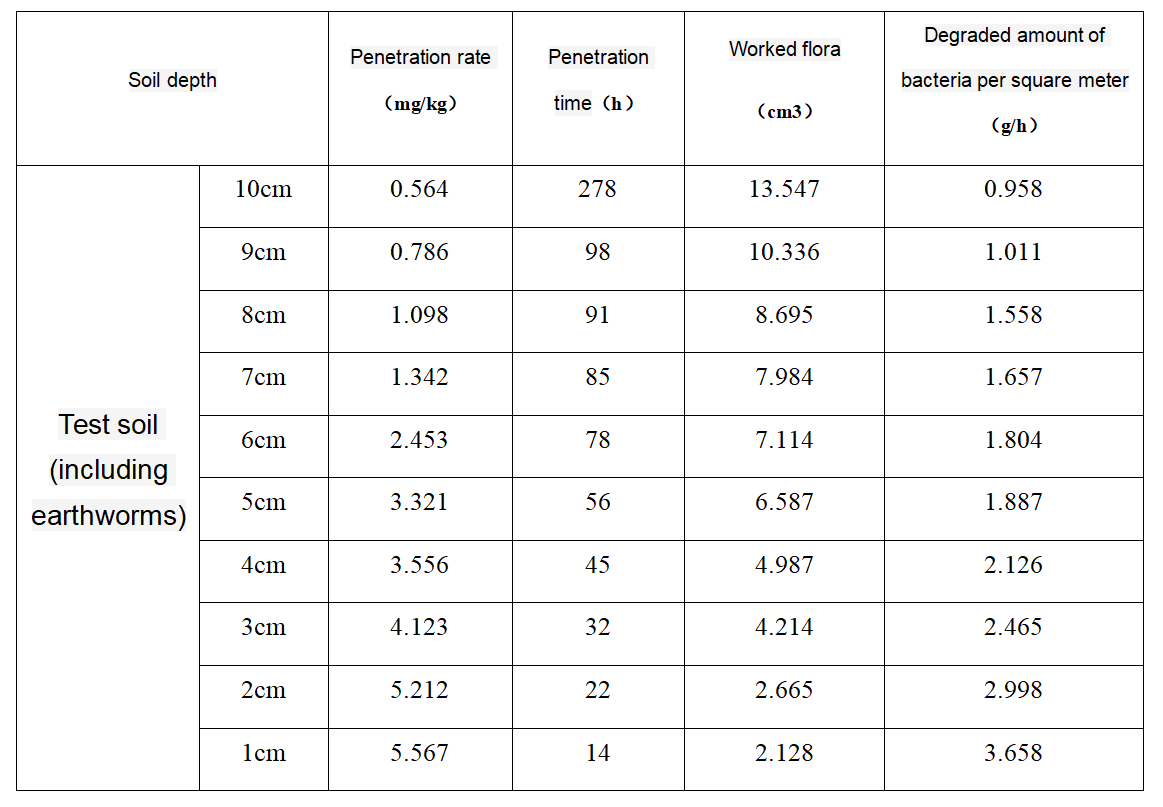
Compare Results
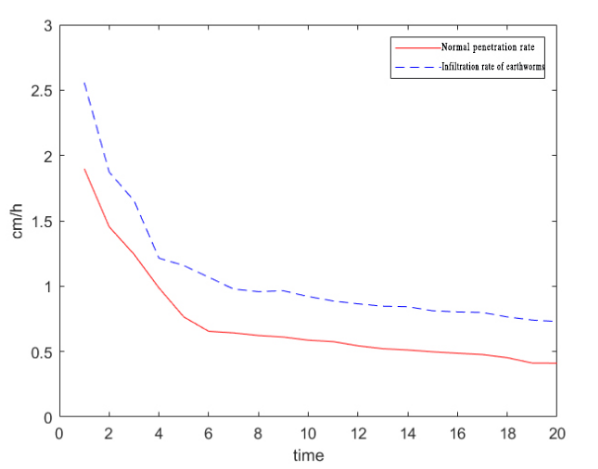
In the above figure, the red line is the penetration rate of fungi in normal soil. As time goes on, the penetration depth of the monitored soil colony is gradually increasing, but the penetration rate in the soil will gradually be affected by the resistance or isolation of the soil. Decrease, when the depth increases to a certain extent, the rate of decrease will become smaller and smaller, tending to stabilize.
In the same way, the blue line is the penetration rate of the presence of earthworms. In the presence of earthworms, the penetration rate will gradually decrease, but the overall penetration rate is greater than that of pure soil.
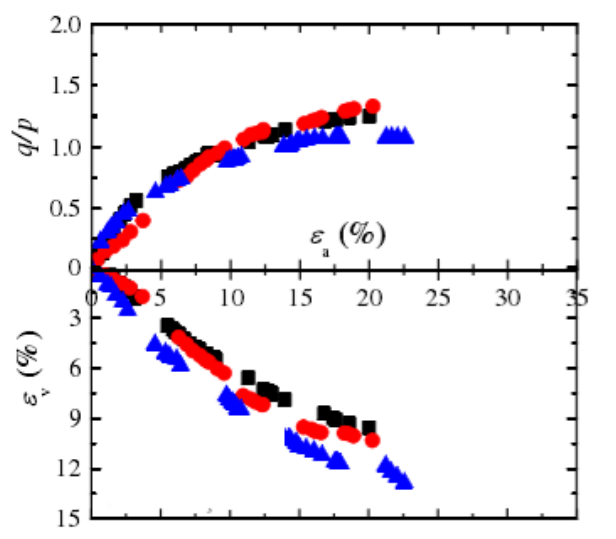
The above figure gives an explanation of the degradation of the colony. The horizontal axis is the permeability of the colony. The permeability is gradually increasing. The upper part shows the specific gravity of the degraded pollution occupying the entire 1 square meter measurement. The following figure shows The effective degrading colony occupies the proportion of the total colony. The blue color contains earthworms, the black color does not contain earthworms, and the red color contains half the number of earthworms as blue.


Contact us:
woxihuan36@foxmail.com
